Ultra Compact Dwarf galaxies in Abell 1689:
a photometric study with the ACS
Abstract
The properties of Ultra Compact Dwarf (UCD) galaxy candidates in Abell 1689 (z=0.183) are investigated, based on deep high resolution ACS images. A UCD candidate has to be unresolved, have () mag and satisfy color limits derived from Bayesian photometric redshifts. We find 160 UCD candidates with mag. We estimate that about 100 of these are cluster members, based on their spatial distribution and photometric redshifts. For mag, the radial and luminosity distribution of the UCD candidates can be explained well by Abell 1689’s globular cluster (GC) system. For mag, there is an overpopulation of 15 5 UCD candidates with respect to the GC luminosity function. For mag, the radial distribution of UCD candidates is more consistent with the dwarf galaxy population than with the GC system of Abell 1689. The UCD candidates follow a color-magnitude trend with a slope similar to that of Abell 1689’s genuine dwarf galaxy population, but shifted fainter by about 2-3 mag. Two of the three brightest UCD candidates ( mag) are slightly resolved. At the distance of Abell 1689, these two objects would have King-profile core radii of 35 pc and 300 pc, implying luminosities and sizes 2-3 times those of M32’s bulge. Additional photometric redshifts obtained with late type stellar and elliptical galaxy templates support the assignment of these two resolved sources to Abell 1689, but also allow for up to 4 foreground stars among the 6 brightest UCD candidates. Our findings imply that in Abell 1689 there are 10 UCDs with mag, probably created by stripping “normal” dwarf or spiral galaxies. Compared to the UCDs in the Fornax cluster – the location of their original discovery – they are brighter, larger and have colors closer to normal dwarf galaxies. This suggests that they may be in an intermediate stage of the stripping process. Checking the photometric redshifts of the brightest UCD candidates with spectroscopy would be the next step in order to definitely confirm the existence of UCDs in Abell 1689.
1 Introduction
1.1 Discovery of UCDs
Recently, Drinkwater et al. Drinkw00 (2000) and Drinkw03 (2003), reported on the discovery of 7 ultra compact dwarf galaxies (UCDs) in the Fornax cluster. These objects are very luminous star clusters in the magnitude range mag, i.e. about 1-2 mag brighter than Centauri. Three different origins for the UCDs are in discussion: (1) they are the brightest globular clusters of very rich globular cluster systems (GCS), like in NGC 1399 (Mieske et al. Mieske02 (2002), Dirsch et al. Dirsch03 (2003)); (2) they are the remnant nuclei of stripped dwarf galaxies which have lost their outer parts in the course of tidal interaction with the Fornax cluster’s potential (Bekki et al. Bekki03 (2003), Mieske et al. Mieske04 (2004)); (3) they are formed from the amalgamation of stellar super-clusters in collisions between gas-rich galaxies (Fellhauer & Kroupa Fellha02 (2002), Kroupa Kroupa98 (1998), Maraston et al. Marast04 (2004)).
These possibilities are discussed in more detail in Mieske et al. Mieske04 (2004). It is found that in Fornax there are 12 bright compact objects with mag, including the UCDs. Applying incompleteness correction, this number rises to 14. The bright compact objects follow a color-magnitude relation in with a slope very similar to that of Fornax dEs (Hilker et al. Hilker03 (2003)), but shifted about 0.2 mag redwards. In addition, they appear to be separated from the fainter compact Fornax members ( mag) in radial velocity and are spatially distributed in a more extended fashion. The properties of the faint compact Fornax members are consistent with the globular cluster system of NGC 1399. The properties of bright compact Fornax members seem to be different from those of normal globular clusters. They are consistent with the threshing scenario of Bekki et al. Bekki03 (2003), who propose tidal stripping of nucleated dwarf galaxies as a source of bright compact cluster members. Their properties are also consistent with the super-cluster scenario as proposed by Fellhauer & Kroupa Fellha02 (2002), suggesting for the first time a color magnitude relation for bright globular clusters, if true.
1.2 UCDs in Abell 1689?
In the case of Abell 1689 (, Tyson & Fischer Tyson95 (1995)) one of the most massive known galaxy clusters (, and kpc, see the lensing studies by Broadhurst et al. Broadh04 (2004) and King et al. King02 (2002)) it is very interesting to estimate the number of UCD candidates. Is Fornax a special case, or are UCDs a more general phenomenon? A consequence of the latter possibility would be that entire tidal disruption of fainter dwarf galaxies might occur in many clusters and could therefore partially cause the “missing satellite” problem (Moore et al. Moore99 (1999), Klypin et al. Klypin99 (1999)). Detailed numerical simulations regarding this issue might become necessary. However, it must also be addressed to what extent the number of UCD candidates can be accounted for by the very rich GCS of Abell 1689 (Blakeslee et al. Blakes03 (2003)). As Abell 1689 consists of several sub-clusters in radial velocity (Teague et al.Teague90 (1990), Girardi et al.Girard97 (1997)), there is the possibility of merger events having occurred in the recent past. This might cause the creation of stellar super-cluster (Fellhauer & Kroupa Fellha02 (2002))and therefore also contribute to the number of UCDs. Abell 1689 has a mean redshift of z=0.1832 (NED database). Assuming km/s/Mpc, and , the corresponding distance modulus is 39.74 mag. Taking into account k-correction, which is about 0.3 mag for at the redshift of Abell 1689, we look for objects in the apparent magnitude range mag, a task which requires very deep imaging.
The aim of this paper is to estimate the number of UCD candidates in Abell 1689 and to investigate their distribution in luminosity, color, and space using deep ACS imaging data. Sect. 2 describes the ACS data. In Sect. 3 the properties of UCD candidates are investigated. In Sect. 4, the findings are discussed. Sect. 5 presents the conclusions.
2 The data
The photometric data used in this paper are extracted from deep ACS images of Abell 1689, obtained from the ACS Guaranteed Time Observations deep imaging cluster Wide Field Camera (WFC) data in June 2002. The WFC covers a FOV of 202 202 arcsec, with 0.05′′ pixels. The data are presented in more detail in Broadhurst et al. Broadh04 (2004). A total of 20 orbits were taken in the four passbands F475W(g), F625W(r), F775W(i) and F850L(z), corresponding to the Sloan (g ,r ,i ,z ) Digital Sky Survey (SDSS) filters. The PSF full-width at half-maximum (FWHM) is 0.10′′–0.11′′, or about 2 pixels, in each filter. The limiting magnitude for detecting point sources with at least 5 pixel above 1.5 is mag. The faint limit of the UCD magnitude regime of mag corresponds to mag (Fukugita et al. Fukugi96 (1996)).
At the distance of Abell 1689, 0.1′′=310 pc. All UCDs in Fornax have scale lengths of 10-20 pc. Their analogs hence are detectable but unresolved on the ACS images of Abell 1689.
Detection and analysis of unresolved sources was done using SExtractor (Bertin & Arnouts Bertin96 (1996)) on the ACS images, where all bright galaxies were previously subtracted (see Zekser et al.Zekser04 (2004)). SExtractor was run in dual mode, detection of sources on the detection image (inverse-variance weighted average of the four passband images, see Benitez et al. Benite04 (2004)), and then, carrying out their analysis on each single passband. Sources were defined as unresolved when the SExtractor Star-Classifier value was larger than 0.6. Magnitudes were determined from aperture photometry.
Using the technique outlined by Benitez Benite00 (2000), Coe et al. Coe04 (2004) provide Bayesian Photometric Redshifts (BPZ) for almost 2000 sources in Abell 1689. The ACS data was complemented by VLT optical and infrared photometry. In this paper these photometric redshifts are used to help distinguish unresolved cluster members from background galaxies.
The analysis of the resolved sources and thereby of the normal dwarf galaxy population in Abell 1689 is presented in a separate paper (Infante et al. Infant04 (2004)).
3 Photometric selection and properties of UCD candidates in Abell 1689
In this paper two different methods to separate cluster members from background galaxies are applied: first, a color selection applied to unresolved objects, based on and complemented by photometric redshifts; and second, a statistical background subtraction using the radial density distribution of the color selected objects. The background contaminations derived from both methods are compared. To search for UCD candidates, a circular region of 92 ′′ (285 kpc) radius centered on the brightest cluster galaxy was analysed. This was the largest possible circular region imaged entirely by the ACS. See the paper by Broadhurst et al. Broadh04 (2004) for the optical ACS image of the cluster.
3.1 Color selection and background contamination from photometric redshifts
The left panels of Fig. 1 show two CMDs in and , respectively, of all unresolved sources in the ACS field of Abell 1689. The faint magnitude limit for UCD candidates is mag. To help define color selection windows for UCD candidates, photometric redshifts from Coe et al. Coe04 (2004) are indicated in the right panels of Fig. 1 to separate cluster member candidates from background galaxies: Circles are for , and crosses are for . In addition, the color windows in and corresponding to the colors of UCDs in Fornax are also indicated. The color transformations were calculated using the calibrations of the ACS bandpasses described in Sirianni et al. Sirian04 (2004), including -corrections.
The limit between cluster and background objects is clear by inspecting Fig. 2. It shows a histogram of the photometric redshift distribution of sources in the field of view of the Abell 1689 ACS image (Coe et al. Coe04 (2004)). Apart from the most probable photometric redshift , also the smallest and largest possible redshifts and are shown (2 sigma). Apparently there is a pronounced peak around 0.25, corresponding roughly to the redshift of Abell 1689. The distributions of and show, however, that photometric redshift values much closer to 0 and also up to about 0.5 are possible for objects whose 0.25. We therefore adopt a limit of for cluster membership assignment based on photometric redshifts, providing an upper limit on the number of cluster members. The spectroscopic survey of Abell 1689 by Duc et al. Duc02 (2002), in particular Fig. 1 in that paper, indicates that the redshift space behind the cluster is very sparsely populated until at least z=1. The ratio of background to cluster galaxies is only a few percent. The same holds for the number of foreground galaxies. Therefore, the limit should yield a fair estimate of the real number of cluster members. It is important to note here that the use of photometric redshifts helps defining the color window only for UCD candidates, as fainter than that no photometric redshifts are available.
In , the limit between and is well defined at about mag. This color is hence adopted as the red limit for UCD candidates. The red color limit of UCDs in Fornax is mag. Using the ACS bandpass calibrations from Sirianni et al. Sirian04 (2004), this corresponds to mag, almost identical to the adopted red color limit based on photometric redshifts. The blue color limit is adopted as mag, as this is the approximate blue limit of point sources with reliable colors. The objects bluer than that are dominated by fainter sources with large color errors, see Fig. 1. In total, this yields the color window mag for UCD candidates. In , analogous considerations yield a color window . The color selection windows are quadratically broadened by the object’s color error for each object. The final selection criteria for UCD candidates are: SExtractor star-classifier larger than 0.6, mag, mag, and distance from the cluster center .
For objects with photometric redshift that fall into the color selection windows, the background contamination can be estimated. There are 33 objects with in the color window, spanning the magnitude range mag. Out of these, 17 have . This corresponds to a background contamination of 48.5 12%.
3.2 Background contamination from radial density distribution
Fig. 3 shows the surface density distribution of the UCD candidates in Abell 1689 as selected in the previous section, together with the distribution of all unresolved sources. In total, there are 160 UCD candidates within a radius of 92′′, which is the distance from the cluster center to the image limit. The UCD candidates are strongly clustered, with their distribution agreeing very well with that of all unresolved sources. Note that the latter objects are dominated by Abell 1689’s globular cluster system (Blakeslee et al. Blakes03 (2003)).
The total number of 160 UCD candidates in Abell 1689 must be corrected for the contribution of background number counts. To do so, a Sersic-profile plus a radius-dependent background density was fit to the surface density distribution of UCD candidates. Note that a Sersic-profile yielded a better fit than a power-law. The inclusion of a radius-dependent background density takes into account that the lens magnification changes the number density of observed background objects. Following Blakeslee Blakes99 (1999) and King et al. King02 (2002), we adopt a simple isothermal profile for the magnification , yielding
| (1) |
We adopt as the Einstein radius of Abell 1689, which is the mean of the values derived by King et al. King02 (2002) from weak lensing and Broadhurst et al. Broadh04 (2004) from strong lensing. Given the undistorted background number density , it holds for the observed background number density :
| (2) |
Assuming a power-law distribution with (Benitez et al. Benite04 (2004)) and applying equations (6) and (7) of Blakeslee Blakes99 (1999) then yields
| (3) |
The fact that the exponent is positive shows that the decrease of surface density of background sources dominates over the number count increase of detectable objects due to the magnification. In other words, the density of background objects decreases towards the cluster center. In this case, by about 10% as compared to a constant, radially independent background density.
The result of the fit is that the total background contamination for r92′′ is 26 22 %. This means that taking into account the effect of lensing on the number density of background objects increases the number of cluster members by about 3%. The error of the background contamination is considerable due to the fact that four variables (central surface density, scale radius, Sersic index, background density) are fit at the same time. When fixing the fitted values for scale radius and Sersic index, the error of the background contamination decreases from 22% to 13%. In either case, the result of 26% 23% (or %) agrees to within its errors with the background contamination of 48.5 12% estimated from photometric redshifts in the previous section. Adopting the mean of both values, i.e. 37%, about 100 out of the 160 UCD candidates should be cluster members. This means that there are about 7 times more objects in the color-magnitude range of UCDs than in Fornax, where 14 UCDs are found (as Mieske et al. Mieske04 (2004)). A further discussion of this is given in Sects. 3.5 and 4.
3.3 Luminosity distribution of UCD candidates
Fig. 4 shows the luminosity distribution of UCD candidates in Abell 1689. The counts have been corrected for the contribution of background sources using the value of 37% contamination derived in the previous Sect. 3.2. Gaussian GCLFs with width , 1.3, 1.4 and 1.5 mag all match reasonably well the number counts for 26.8 mag ( -12.7 mag), resulting in a total number between 135400 for and 17100 for mag. The value of the fit is best for mag, consistent with what is usually found for GC systems (Kundu & Whitmore Kundu01 (2001)). Note that unlike for the Fornax case, where the GC system of NGC 1399 has been investigated beyond the turnover magnitude (TOM), this is not possible for Abell 1689. In , the TOM lies at about 31.8 mag, far beyond the reach of even the ACS. This is why the total number of GCs can be restricted only poorly with the existing data. Crowding is not a significant effect: random position simulations of globular clusters belonging to a GCS with TOM mag, mag and show that only 1.5% of the clusters with mag – 1 mag fainter than the completeness limit – are less than 2 FWHM away from their next neighbor.
For magnitudes brighter than 26.8 mag ( mag), there is an overpopulation of UCD candidates with respect to any of the adopted Gaussian LFs. The number of GCs with mag expected from the GCLF with width mag is 4.8, while the number of candidate UCDs is 20.9. The two values are inconsistent at the 3.5 level. Note that the non-integer numbers are caused by the statistical background decontamination.
The faint magnitude limit of mag for the overpopulation is about 1 mag brighter than the faint magnitude limit of UCDs in Fornax. This might indicate that the objects equivalent to UCDs in Fornax are brighter in Abell 1689. Before making that conclusion, it must be clarified whether the several to GCs that are needed to explain the number counts for mag, can at all be contained in the GC system of Abell 1689. Assuming 6, a value found for example for the Fornax cluster’s central galaxy NGC 1399 (Dirsch et al. Dirsch03 (2003)), the total number of GCs belonging to the ten brightest cluster galaxies in Abell 1689 ( mag, Zekser et al. Zekser04 (2004)) is 44500, being of the order of the values found above. Thus, it is not necessary to introduce other objects than genuine GCs contributing to the number counts for 26.8 mag.
Therefore, from the magnitude distribution we conclude that for 26.8 mag we find evidence for an overpopulation with respect to the GCLF, while for 26.8 mag the number counts are consistent with a regularly rich GCS following a Gaussian LF.
3.4 Color distribution of UCD candidates vs. normal dwarf galaxies
In order to investigate the sub-population of UCD candidates which constitute an overpopulation with respect to Abell 1689’s GCLF, Figs. 5 and 6 show CMDs of UCD candidates with mag in and , respectively. The colors of resolved objects with are given to illustrate the location of the CM sequence for dwarf galaxies in the cluster. A detailed paper on these resolved objects is in preparation (Infante et al. Infant04 (2004)).
The following main features are extracted from the CMDs:
-
1.
UCD candidates extend to much brighter magnitudes than in Fornax. The brightest UCD candidate in Abell 1689 has -17 mag, about as bright as the cE M32 (Mateo Mateo98 (1998)).
-
2.
UCD candidates and dwarf galaxies follow color-magnitude trends in the sense that color becomes redder with growing luminosity. For the UCD candidates, the slope is -0.069 0.006 for and -0.027 0.005 for .
-
3.
UCD candidates are redder than dwarf galaxies of the same brightness, a behavior which is more pronounced in (about 0.3 mag difference) than in (between 0.0 and 0.2 mag difference).
-
4.
UCD candidates are more consistent with the red than the blue peak of the bimodal GC color distribution.
Features 2, 3 and 4 are qualitatively consistent with what has been observed for UCDs in the Fornax cluster (Mieske et al Mieske04 (2004)). The interpretation is that UCDs are created by tidally disrupting nucleated dwarf galaxies (dE,Ns), which after some passages through the cluster’s potential well can only retain the nuclear part, hence become “ultra compact” (Bekki et al. Bekki03 (2003)). In a CMD a dE,N moves towards fainter magnitudes at unchanged color. The final products of this threshing procedure, namely the UCDs, then define a CM relation with similar slope to that of dEs, but shifted red-wards. The most interesting feature is that the Abell 1689 UCD candidates reach the luminosity of very bright “normal” dwarf galaxies: they extend to 17 mag, while the magnitude limit between dwarf and giant galaxies is only 1-2 mag brighter (Hilker et al. Hilker03 (2003)). This could mean that at least in the case of the brightest UCD candidates we are seeing objects in the transition phase between dE,Ns and UCDs, as a magnitude difference of about 4 mag between dE,N and UCD is expected (Bekki et al. Bekki03 (2003)).
The idea that the brightest UCD candidates are just the smallest genuine dEs of a continuous distribution is another possible explanation for our findings. However, Fig. 7 shows that the size distribution of all (unresolved and resolved) objects in the magnitude range mag is not consistent with that assumption. The size distribution of resolved sources has a sharp lower cutoff at about 0.2′′ FWHM, twice as large as the FWHM of the UCD candidates. This dichotomy is as well present in the CMD in Fig. 5, where the UCDs are well separated from the resolved objects.
In Sect. 4, the implications of our findings will be further discussed.
3.5 Radial distribution of UCD candidates vs. normal dwarf galaxies
Fig. 8 shows the cumulative radial distribution of UCD candidates and dE candidates in Abell 1689, with the latter data taken from Infante et al. Infant04 (2004). The sample of UCD candidates is split into three overlapping sub-samples: mag (UCD1 hereafter), mag (UCD2) and mag (UCD3). In addition, the distribution of unresolved objects with mag in the color range of UCD candidates (GCS hereafter) is indicated. Note that the sample GCS contains the UCD candidates with mag and also all fainter sources and is therefore dominated by genuine globular clusters, according to the results of Sect. 3.3.
From Fig. 8 it is evident that the UCDs with mag are more strongly clustered than the two brighter sub-samples and also the dEs. A KS test shows that the cumulative radial distribution of UCD1 is drawn from the same distribution than GCS at 97% confidence. The distribution of UCD1 is inconsistent with that of the dEs at the 98% confidence level. This disagreement with the dEs drops to 53% for UCD2 and 68% for UCD3. UCD1 is inconsistent with UCD2 at 77% and with UCD3 at the 95% confidence level. For the six objects contained in UCD3, no clustering is detectable.
These findings show that only for () mag, UCD candidates show a different radial distribution compared to the globular cluster system of Abell 1689. The fact that their distribution agrees better with that of the dwarf galaxies is consistent with the threshing scenario. Going back to the luminosity distribution of UCD candidates as shown in Fig. 4, it is found that in the magnitude range mag, the predicted number of GCs from the best fit GCLF is 4.3, while the number of UCD candidates is 12.1, inconsistent at the 2.2 level. For mag, the disagreement is much stronger: only between 0 and 1 GC are expected from the GCLF, compared to 10 actually found objects.
In conclusion, UCD candidates are well separated in luminosity and spatial distribution from GCs for () mag. For () mag, our data suggest that genuine GCs are an important fraction. UCD candidates in that magnitude regime cannot be distinguished from GCs, and they might mix up with them. A minimum number of about ten UCDs with is then consistent with our results.
4 Discussion
The aim of this section is twofold: first, compare the expected number of stripped dE,N nuclei in Abell 1689 with the number of UCD candidates derived in the previous section. Second, discuss several alternative possibilities for the identity of the very bright UCD candidates.
4.1 Number of UCD candidates
Based on their simulations, Bekki et al. Bekki03 (2003) predict the number of UCDs expected from threshing dE,Ns for the case of the Fornax and the Virgo cluster. For Abell 1689 no such simulations exist, yet. Abell 1689 has a several times higher x-ray temperature than Virgo (Young et al. Young02 (2002), Xue & Wu Xue02 (2002)) and about half as many spirals per E/S0 galaxy (Ferguson Fergus89 (1989), Balogh et al. Balogh02 (2002)). However, the two clusters are similar in terms of enclosed mass and size, two factors which predominantly determine the number of UCDs expected from threshing dE,Ns. While , and a scale radius kpc for Virgo (Bekki et al. Bekki03 (2003)), , and kpc for Abell 1689 (Broadhurst et al. Broadh04 (2004), King et al. King02 (2002), Tyson & Fischer Tyson95 (1995)). The mass value for Abell 1689 differs somewhat depending on the method used to derive it. The strong lensing study of Broadhurst et al. obtains , King et al. get from weak gravitational lensing, while current X-ray estimates (Xue & Wu Xue02 (2002), Andersson & Madejski Anders04 (2004)) yield lower results than the King et al. values by a factor of about 2.
For the Virgo cluster, 46 UCDs are expected with a maximum projected radius of 700 kpc (Bekki et al. Bekki03 (2003)). The number of UCDs and their radial extension should therefore be expected similar for Abell 1689. Note that for the Fornax cluster, which has an almost ten times smaller mass and three times smaller scale radius, Bekki et al. predict 14 UCDs, in very good agreement with the number of UCD candidates found in Fornax by Mieske et al. Mieske04 (2004).
The maximum projected radius of the present investigation is about 285 kpc. According to Bekki et al.’s simulation for the Virgo cluster, about 50% of UCDs created by threshing dE,Ns are expected within this radius. Therefore, of the order of 20-25 UCDs should be found in the ACS image of Abell 1689. As shown in Sect. 3.3, only for mag ( mag) is it possible to reasonably estimate the number of UCD candidates, as they are distributed spatially more extended and are brighter than expected for even the brightest GCs of Abell 1689’s GCS. In that magnitude range, 10 UCD candidates are found. This number constitutes, of course, a lower limit on the number of UCDs. The overpopulation found for mag with respect to the GCLF would contribute another 6-7 objects, but note that in this magnitude range the radial distribution of UCD candidates is indistinguishable from that of the GCs. Fainter than mag, the majority of objects are GCs, but there can be UCDs mixing up with them.
In total, a number of 20-25 of UCDs is consistent with our findings, which provide a lower limit of about ten UCDs. Spectroscopic data of the (brightest) UCD candidates is necessary in order to definitely determine their cluster membership.
4.2 Dwarf galaxies caught in the act of threshing?
If all UCD candidates with mag really were members of Abell 1689, this would imply that there are very bright UCDs reaching luminosities of mag ( mag), almost 4 mag brighter than in Fornax. We might therefore see dwarf galaxies that are still in the process of disruption, being in the early stages of the threshing process as simulated by Bekki et al.Bekki03 (2003). The assumption that the UCD candidates originate from dwarf galaxies rather than globular clusters is supported by the fact that the very bright UCD candidates have a radial distribution which is more consistent with that of Abell 1689 dwarf galaxies than with the GCS. Moreover, the brightest UCD candidates are by far too luminous for globular clusters.
Another supportive finding is that the UCD candidates follow color-magnitude trends both in and , see Figs. 5 and 6, which place them redward of the dwarf galaxies. For the very bright UCD candidates with mag, these relations are best defined. For , the slope in that magnitude regime is -0.086 0.012. The slope of the dwarf galaxy relation is -0.095, consistent with that of the UCD candidates. The mean color difference between the UCD and dwarf CM relation is 0.28 mag. Assuming that the UCD candidates are (partially) threshed dE,Ns of unchanged color (see Mieske et al.Mieske04 (2004)), that means that the UCD candidates are about 3 mag fainter than their progenitors. In , the UCD slope is -0.0315 0.01 and the dwarf galaxy slope -0.068 0.02, with the mean color difference between both relations being 0.092 mag. This implies a magnitude difference of 2 mag between UCD candidates and progenitor dE,Ns.
These differences are smaller than the 4.1 mag difference between UCDs and progenitor dE,Ns predicted by Bekki et al.Bekki03 (2003) and the difference of about 5 mag between dE,Ns and their nuclei found observationally by Lotz et al.Lotz01 (2001). It therefore supports the hypothesis that the very bright UCD candidates are dE,Ns that have not yet transformed entirely to naked nuclei, as also suggested from their higher luminosities as compared to the Fornax cluster.
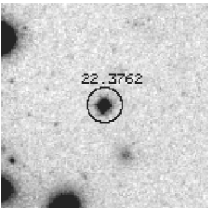
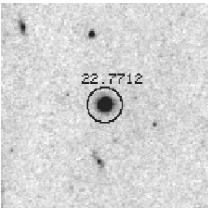
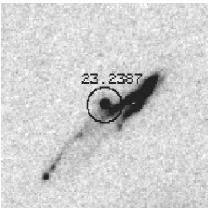
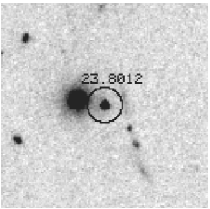
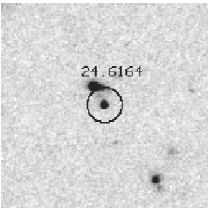
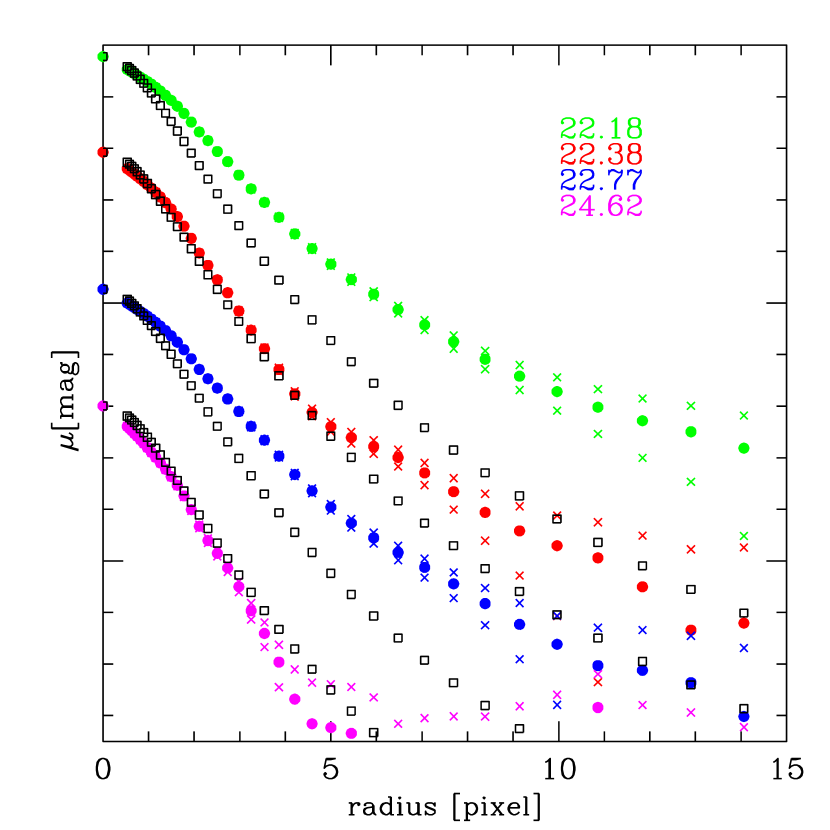
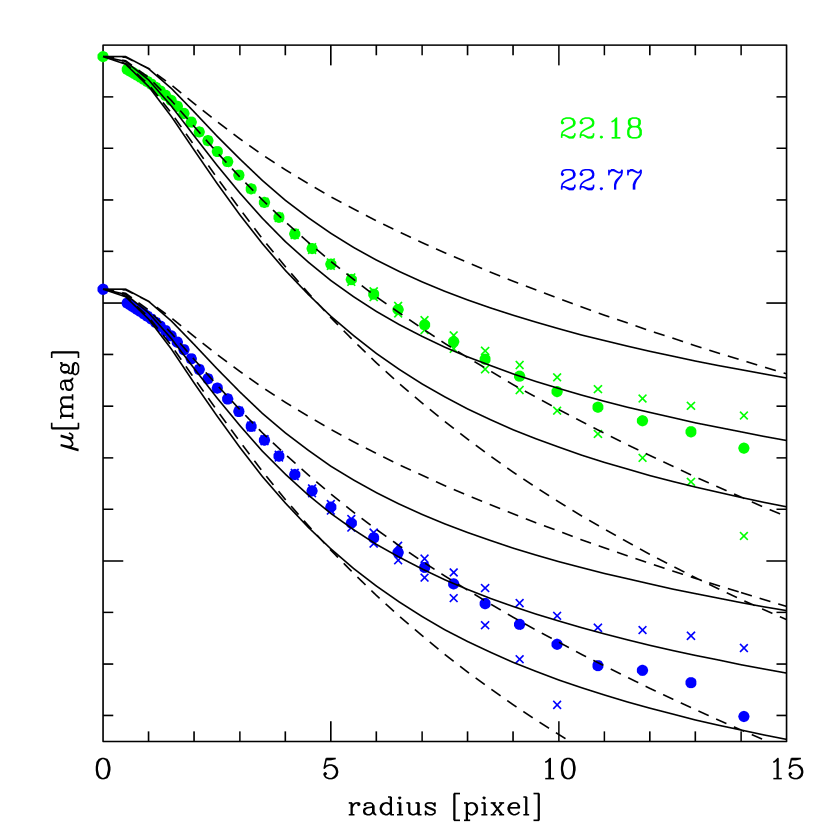
It is interesting to note that mag corresponds approximately to the total luminosity of M32, with M32’s high surface brightness bulge being about 1 mag fainter (Mateo Mateo98 (1998), Graham Graham02 (2002)). The bulge component of M32 has an effective radius of about 100 pc (Faber et al. Faber89 (1989), Graham Graham02 (2002)) which at the distance of Abell 1689 corresponds to about 0.064′′ effective diameter. This angular size is about half of the PSF FWHM. An M32 A1689 equivalent, like the very bright UCD candidates, might therefore be marginally resolved. Fig. 9 shows the six brightest UCD candidates ( mag) in the ACS image, with the same intensity cuts for each thumbnail. The two sources with 22.18 and 22.77 mag appear slightly more extended than the object with 22.38 mag. The SExtractor star classifier is 0.88 and 0.92 for the two more extended sources, and between 0.93 and 0.98 for the other four ones. The differences become more evident in Fig. 10. Here, the surface brightness profile of the three brightest and the faintest of the six objects is compared with the PSF profile of the ACS images. Evidently, the two sources with 22.18 and 22.77 mag have an extended envelope compared to the PSF profile. Comparing their brightness profile with convolved King-profiles shows that a core radius of about 0.225 pixel – i.e. a core diameter and FWHM of 0.45 pixel or 0.0225′′ – fits the observed profile best for both sources. This corresponds to a King-profile core radius of about 35 pc at the distance of Abell 1689, several times larger than found for the UCDs in Fornax (Drinkwater et al. Drinkw03 (2003)). The King-profile can per definitionem not be characterized by an effective radius, as its integrated intensity rises proportional to for large values of . Therefore, in addition to the convolved King-profiles, Fig. 10 shows three convolved Sersic profiles with Sersic parameter . The curve corresponding to pixel (0.1′′) fits best the observed surface brightness of the two bright UCD candidates, yielding 310 pc at the distance of Abell 1689. This finding supports the hypothesis that these objects are dwarf galaxies in the process of disruption and therefore still possess to some degree a stellar envelope. Their spectroscopic confirmation as cluster members would prove the stripping hypothesis. A possible explanation for the still ongoing stripping process might be that Abell 1689 consists of at least two sub-clusters separated in radial velocity (Teague et al.Teague90 (1990), Girardi et al.Girard97 (1997)). This indicates that a merger process may be going on, possibly feeding the center of the cluster with “fresh” dwarf galaxies to be stripped.
Note that both the size and luminosity of the two resolved UCD candidates are a factor 2-3 higher than those of M32’s bulge (Graham Graham02 (2002)). It is therefore also possible that the latter objects are the bulges of stripped spiral galaxies, which is the favoured origin for M32 by Graham’s Graham02 (2002) analysis of M32’s surface brightess profile. This would imply the existence of a high surface brightness bulge – fit well by a Sersic-profile with – and possibly an extended low surface brightness exponential disk. Given that the two UCD candidates are only marginally resolved, this is extremely difficult to check. From Fig. 10 it is clear that a single Sersic profile provides a good fit to the surface brightness profile of the two resolved UCDs. It is not necessary to include another component into the fit. Nevertheless, we cannot reject the possibility that the bright UCD candidates are bulges of stripped spirals, maybe with the outer exponential disk destroyed almost completely.
4.3 Stellar super-clusters?
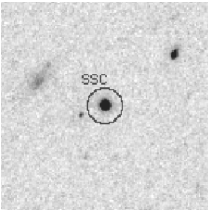
The subclustering of Abell 1689 in radial velocity as mentioned in the previous section also opens up the possibility for an additional source of bright stellar clusters, outlined by Fellhauer & Kroupa Fellha02 (2002). They show that in a merger process very luminous stellar “super-clusters” can be created, which after aging 10 Gyrs resemble the properties of UCDs in Fornax. One existing example is W3 (Maraston et al. Marast04 (2004)), an extremely bright young super-cluster in NGC 7252 of age about 300 Myr, which has 16 mag. In the case of Abell 1689, the very bright UCD candidates may be very young super-clusters. However, their color should be much bluer than found here for Abell 1689. The color range of for the UCD candidates with mag corresponds roughly to a restframe color of mag, see Fig. 1. Using Worthey Worthe94 (1994), the expected color for a stellar population of age 300 Myr is about 0.1 mag, depending on metallicity. Therefore, the very bright UCD candidates cannot be explained by the “super-cluster” scenario. There are, however, 3 more unresolved sources at bluer colors than our UCD selection window, see Fig. 1. They have () mag and mag, which is of the order of what would be expected for stellar super-clusters. However, for two of these three, the photometric redshift is 0.01, consistent with them being either foreground stars or intergalactic globular clusters. For the third object (the reddest one), the photometric redshift is 0.25 0.08, consistent with that of the cluster. See Fig. 9 for a thumbnail.
Hence, we might have found one analog to W3 in Abell 1689 at a bluer color than the UCD candidates. Spectroscopic measurements are necessary to prove this assumption.
4.4 Foreground stars?
Another possibility for the origin of the very bright UCD candidates is that some of them are foreground stars located in the Milky Way or its halo, especially the four ones which are definitively unresolved. The color range of the very bright UCD candidates of corresponds to K and M type subdwarfs (Gizis & Reid Gizis99 (1999)). The absolute brightness of these subdwarfs is about mag, corresponding to a distance of about 10 kpc if the very bright UCD candidates actually are subdwarfs. The very bright UCD candidates extend about 3 mag in luminosity, or a factor of about 4 in distance if interpreted as subdwarfs with identical absolute luminosity. This means they would occupy the distance range 5-20 kpc. The field of view of the ACS (3 3′) corresponds to about 9 9 pc at 10 kpc distance. This translates into a volume of about 106 pc3. The space density of halo stars at a distance of 10 kpc is about 10 (Kerber et al. Kerber01 (2001), Phleps et al. Phleps00 (2000)). This shows that some of the very bright UCD candidates could be halo subdwarfs.
However, note that the mean photometric redshift of the six very bright UCD candidates is 0.245 0.06, consistent with that of the cluster. These photometric redshifts, as all the ones quoted in this paper, were calculated using the Bayesian BPZ code by Benitez Benite00 (2000). This involves the assignment of redshift dependent prior probabilities to six different galaxy templates ranging from an elliptical to an irregular galaxy SED. It is clear that for the six brightest UCD candidates, a statistical approach like the Bayesian one might not be very reliable any more. Some of the template SEDs used in the BPZ algorithm – probably the late-type ones – may not match very well the expected SED of an UCD. Therefore, we calculate the photometric redshift of the six very bright UCD candidates in two additional ways, using the BPZ code by Benitez Benite00 (2000):
First, only with stellar templates of K and M type subdwarfs from Pickles Pickle98 (1998) without prior probabilities. This is done to see how many UCD candidates have colors consistent with foreground stars. Second, with the elliptical template from Benitez et al. Benite04 (2004), also without prior probabilities. UCDs are supposed to be early type stellar populations, and hence an elliptical galaxy template should be a good approximation of a real UCD spectrum. Note that up to now, no precise age/metallicity or line-index measurements of UCDs have been published.
The results of the calculations are
shown in Table 1, indicating the photometric redshifts,
their errors and the of the redshift determination. The results
can be summarized as follows:
The two slightly resolved candidates 1 and 3 are the only ones which are
inconsistent with stars at , and match the redshift =0.183 of
Abell 1689 from and .
Candidate 2 is more consistent with a star at
than with an early type stellar population in
Abell 1689.
Candidate 4 is
marginally inconsistent with Abell 1689 from ,
and more likely to be an early type stellar population at lower redshift, possibly an
intergalactic globular cluster. Comparing the values,
it is less likely to be a foreground star.
Candidate 5 is consistent with a star at , while both and attribute
it to Abell 1689’s redshift. is lower for the stellar template,
and hence this candidate has an ambiguous
redshift assignment with slight preference to a foreground star.
Candidate 6’s is very high, at the upper limit of what is
adopted in this paper as possible photometric redshift for Abell 1689
members. At the same time, it is consistent with a star at and an early type population at low redshift, with slightly
lower for the star possibility. It seems that candidate 6 is
therefore either a foreground star or intergalactic globular cluster.
Summarizing, UCD candidates 1 and 3 are the least probable foreground stars and most probable cluster members out of the six candidates, due to their resolved morphology and their photometric redshifts. For candidates 2, 4, 5 and 6, the photometric redshift information is more ambiguous and does not allow a clear assignment. Among them, candidate 6 is the least probable cluster member.
It is therefore concluded that there are up to 4 foregound stars among the 6 brightest UCD candidates, with the corresponding number of Abell 1689 members being between 5 and 2. Spectrosopic membership confirmation is needed for more specific statements.
4.5 Back- or foreground galaxies?
Another clear possibility for the identity of the brightest UCD candidates is that they are galaxies / globular clusters which are not members of Abell 1689. The FOV towards Abell 1689 in the investigated color range is dominated by cluster members, but as we consider only six objects, statistical fluctuations might cause a substantial fraction of these six objects to be in front or behind the cluster. With the photometric redshifts listed in table 1, it is clear that candidates 2, 4 and 6 have either or inconsistent with the redshift of Abell 1689. Among these, candidate 4 is most likely to be a foreground object, most possibly an intergalactic globular cluster. Candidate 2 could be a background galaxy, but note that its is less than 2 away from the redshift of Abell 1689. Candidate 6 has very low and very high at comparable . For this object, the question whether its colors are created by intrinsically red populations at low redshift or blue populations at higher redshift cannot be answered with certainty.
In conclusion, among the six very bright UCD candidates there are 3 probable or possible non-cluster and non-stellar objects: one probable foreground globular cluster, one possible background galaxy and one probable non-cluster member, which can be either fore- or background.
5 Summary and conclusions
In this paper, the distribution in color, magnitude and space of Ultra Compact Dwarf (UCD) galaxy candidates (Mieske et al. Mieske04 (2004), Drinkwater et al. Drinkw03 (2003)) in the central 92′′ (285 kpc) of Abell 1689 (z=0.183, mag) has been investigated. The UCD candidates were selected from deep ACS images in g,r,i,z, based on their magnitude ( or mag), size (unresolved) and color. The color windows were mag and mag, defined with the Bayesian photometric redshift code BPZ by Benitez Benite00 (2000). There are 160 UCD candidates in Abell 1689 with mag. Combining photometric redshifts and the radial density distribution of the UCD candidates shows that about 100 of the 160 UCD candidates are cluster members. In the investigation of their properties, the following results are obtained:
-
1.
The UCD candidates extend to mag, about 4 mag brighter than in the Fornax cluster. Their luminosity distribution for () mag is approximated well by the bright end of a Gaussian globular cluster luminosity function (GCLF) shifted to Abell 1689’s distance, implying a total number of about 3-10 GCs. For mag, the UCD candidates define an overpopulation with respect to the GCLF of about a factor of 4, as 20 objects are discovered when about 5 are predicted. This overpopulation is of the order of the number of UCDs expected from the threshing scenario (Bekki et al. Bekki03 (2003)) in Abell 1689.
-
2.
The UCD candidates follow a color-magnitude trend with a slope similar to that defined by the genuine dwarf galaxies in Abell 1689, but shifted somewhat redder. The shift between the two relations corresponds to a magnitude difference of 2-3 mag, about 1-2 mag less than what is expected for the difference between parent dwarf galaxy and stripped nucleus from the simulations of Bekki et al. Bekki03 (2003).
-
3.
The radial distribution of UCD candidates with mag is consistent with that of the GC system. For mag it is shallower and more consistent with that of the genuine dwarf galaxy population in Abell 1689.
-
4.
Two of the three brightest UCD candidates with mag are slightly resolved on the ACS images, with implied King-profile core radii of 35 pc and effective radii of about 300 pc at the distance of Abell 1689. These sizes and luminosities are about 2-3 times higher than the values found for M32’s bulge by Graham Graham02 (2002).
-
5.
Photometric redshifts obtained with late type stellar templates and an elliptical galaxy template support the assignment of the two resolved UCD candidates to Abell 1689 based on the original Bayesian photometric redshift calculation. However, they also allow for up to 4 foreground stars among the six brightest UCD candidates.
-
6.
There are three stellar super-cluster candidates (Fellhauer & Kroupa Fellha02 (2002)) with mag, substantially bluer than the UCD candidates.
All our findings are consistent with the threshing scenario (Bekki et al. Bekki03 (2003)) as a source of at least 10 UCDs for () mag. Ultra Compact Dwarf galaxies created by stripping “normal” dwarf or spiral galaxies appear to exist in Abell 1689. For , the globular cluster population of Abell 1689 clearly dominates over possible UCDs created by threshing. For the following reasons, it appears likely that in the case of Abell 1689 the threshing process has not yet finished: (1) the UCD candidates extend to about 4 mag brighter than in Fornax; (2) their colors are closer to those of genuine dEs than in Fornax; (3) two of the three brightest UCD candidates are resolved, implying sizes several times larger than for the UCDs in Fornax.
The next step is clear: spectroscopic confirmation of the cluster membership assignment obtained with photometric redshifts for the UCD candidates in this paper. For the very brightest UCD candidates with mag, this should be a feasible task with an 8m-class telescope. The spectroscopic confirmation would prove the existence of Ultra Compact Dwarf galaxies at almost 50 times the distance of the Fornax cluster, the location of the UCD’s orginal discovery. It would imply that the disruption of dwarf or spiral galaxies in the cluster tides may be a common process. Detailled numerical simulations in order to test the magnitude of this effect for fainter luminosities are needed. This would allow to check in how far the tidal disruption might be responsible for the “missing satellite” problem, i.e. the disagreement between predicted and observed frequency of dark matter halos.
References
- (1) Andersson, K. E., Madejski, G. M. 2004, ApJ, 607, 190
- (2) Balogh, M.L., Couch, W.J., Smail, I., Bower, R.G., Glazebrook K. 2002, MNRAS 335, 10
- (3) Bekki, K., Couch, W.J., Drinkwater, M.J., Shioya, Y. 2003, MNRAS, 344, 399
- (4) Benitez, N. 2000, ApJ, 536, 571
- (5) Benitez, N., Ford, H., Bouwens, R., et al. (ACS collaboration) 2004, ApJS, 150, 1
- (6) Bertin E., Arnouts S. 1996, A&AS 117, 393
- (7) Blakeslee, J. P. 1999, AJ, 118, 1506
- (8) Blakeslee, J. P., Meurer, G. R., Ford, H. C. et al. 2003, IAUJD, 6E, 34
- (9) Broadhurst, T., Benitez, N., Coe, D. et al. (ACS collaboration) 2004, submitted to ApJ
- (10) Coe et al. (ACS collaboration) 2004, in preparation
- (11) Dirsch, B., Richtler, T., Geisler, D. et al. 2003, AJ, 125, 1908
- (12) Drinkwater M.J., Jones J.B., Gregg M.D., Phillipps S. 2000, PASA 17, 227
- (13) Drinkwater, M.J., Gregg, M.D., Hilker, M. et al. 2003, Nature, 423, 519
- (14) Duc, P.-A., Poggianti, B. M., Fadda, D. et al. 2002, A&A, 382, 60
- (15) Faber, S.M., Wegner, G., Burstein, D. et al. 1989, ApJS, 69, 763
- (16) Fellhauer, M., Kroupa, P. 2002, MNRAS, 330, 642
- (17) Ferguson, H.C. 1989, Ap&SS 157, 227
- (18) Fukugita, M., Ichikawa, T., Gunn, J.E. et al. 1996, AJ, 111, 1748
- (19) Girardi, M., Fadda, D., Escalera, E., et al. 1997, ApJ, 490, 56
- (20) Gizis, J.E., Reid, I.N. 1999, AJ, 117, 508
- (21) Graham, A.W., 2002, ApJL, 568, 13
- (22) Hilker, M., Mieske, S., & Infante, L. 2003, A&AL, 397, L9
- (23) Infante, L., Mieske, S., Palma, O. et al. 2004, in preparation
- (24) Kerber, L.O., Javiel, S.C., Santiago, B.X. 2001, A&A, 365, 424
- (25) King, L.J., Clowe, D.I., Schneider, P. 2002, A&A, 383, 118
- (26) Klypin, A., Kravtsov, A. V., Valenzuela, O., Prada, F., 1999, ApJ, 522, 82
- (27) Kroupa, P. 1998, MNRAS, 300, 200
- (28) Kundu, A., & Whitmore, B. C. 2001, AJ, 121, 2950
- (29) Lotz J.M., Telford R., Ferguson H.C., et al. 2001, ApJ 552, 572
- (30) Maraston, C., Bastian, N., Saglia, R.P. et al. 2004, A&A, 416, 467
- (31) Mateo, M.L. 1998, ARA&A, 36, 435
- (32) Mieske, S., Hilker, M., Infante, L. 2002, A&A, 383, 832
- (33) Mieske, S., Hilker, M., Infante, L. 2004, A&A, 418, 445
- (34) Moore, B., Ghigna, S., Governato, F., et al. 1999, ApJ, 524L, 19
- (35) Phleps, S., Meisenheimer, K., Fuchs, B., Wolf, C. 2000, A&A, 356, 108
- (36) Pickles, A.J. 1998, PASP, 110, 863
- (37) Sirianni, M., Jee, M. et al., 2004, in preparation
- (38) Teague, P.F., Carter, D., & Gray, P. M. 1990, ApJS, 72, 715
- (39) Tyson, J.A., Fischer, P. 1995, ApJL, 446, 55
- (40) Worthey G. 1994, ApJS 95, 107
- (41) Xue, S., Wu, X. 2002, ApJ 576, 152
- (42) Young, A.J., Wilson, A.S. 2002, ApJ 579, 560
- (43) Zekser, K.C., Benitez, N., Blakeslee, J.P. et al. 2004, in preparation


| [mag] | () | () | () | |
|---|---|---|---|---|
| Cand1 | 22.18 | 0.091 0.073 (7.9) | 0.164 0.078 (3.9) | 0.160 0.076 (7.1) |
| Cand2 | 22.38 | 0.001 0.067 (2.6) | 0.188 0.079 (16.1) | 0.300 0.076 (18.9) |
| Cand3 | 22.77 | 0.102 0.029 (8.8) | 0.180 0.079 (5.0) | 0.180 0.078 (5.0) |
| Cand4 | 23.24 | 0.001 0.067 (47.2) | 0.001 0.067 (18.35) | 0.090 0.072 (12.8) |
| Cand5 | 23.80 | 0.001 0.069 (3.3) | 0.142 0.076 (13) | 0.250 0.085 (18) |
| Cand6 | 24.62 | 0.001 0.067 (24.7) | 0.001 0.067 (35) | 0.490 0.098 (36) |