Sub-arcsecond sub-mm continuum observations of Orion-KL
Abstract
We present the first m continuum image with sub-arcsecond resolution obtained with the Submillimeter Array. These data resolve the Orion-KL region into the hot core, the nearby radio source I, the sub-mm counterpart to the infrared source n (radio source L), and new sub-mm continuum sources. The radio to submillimeter emission from source I may be modeled as either the result of proton-electron free-free emission that is optically thick to GHz plus dust emission that accounts for the majority of the submillimeter flux, or H- free-free emission that gives rise to a power-law spectrum with power-law index of . The latter model would indicate similar physical conditions as found in the inner circumstellar environment of Mira variable stars. Future sub-arcsecond observations at shorter sub-mm wavelengths should easily discriminate between these two possibilities. The sub-mm continuum emission toward source n can be interpreted in the framework of emission from an accretion disk.
1 Introduction
In spite of being the nearest (450 pc) and most studied region of massive star formation, we do not understand Orion-KL adequately. The best known source in Orion-KL is the BN object, a heavily reddened B0 star that may be a run-away star from the Trapezium cluster (Plambeck et al., 1995; Tan, 2004). The region exhibits a complex cluster of infrared sources studied from near- to mid-infrared wavelengths (Dougados et al., 1993; Greenhill et al., 2004; Shuping et al., 2004). At least two outflows are driven from the region on scales AU, one high-velocity outflow in the south-east north-west direction observed in molecular lines and in the optical and near-infrared (e.g., Allen & Burton 1993; Wright et al. 1995; Chernin & Wright 1996; Schultz et al. 1999), and one lower velocity outflow in the north-east south-west direction best depicted in the thermal SiO and H2O maser emission as well as some H2 bow shocks (e.g., Genzel & Stutzki 1989; Blake et al. 1996; Chrysostomou et al. 1997; Stolovy et al. 1998). The driving source(s) of the outflows are uncertain: initial claims that it might be IRc2 are outdated now, and possible culprits are the radio sources I and/or the infrared source n, also known as radio source L (Menten & Reid, 1995).
Radio source I lies close to the center of a biconical outflow on the order of AU across, that is traced by SiO and H2O maser emission (Gezari, 1992; Menten & Reid, 1995; Greenhill et al., 2003) and has not been detected in the near- to mid-infrared (Greenhill et al., 2004). Its spectral energy distribution from 8 to 86 GHz can be explained by optically thick free-free emission. The turnover frequency has not been observed yet (Plambeck et al., 1995). However, the fact that SiO masers, typically associated with luminous (evolved) stars such as Mira variables, have been detected toward source I indicates that different physical processes might take place (e.g., Menten & Reid 1995). To get a better idea about the emission process and physical nature of source I, continuum observations at higher frequency are needed. So far this has been an ambitious task because the peak of the hot core is only east of source I and dominates the region unless observed with sub-arcsecond resolution (Plambeck et al., 1995).
2 Observations and data reduction
Orion-KL was observed with the Submillimeter Array (SMA111The Submillimeter Array is a joint project between the Smithsonian Astrophysical Observatory and the Academia Sinica Institute of Astronomy and Astrophysics, and is funded by the Smithsonian Institution and the Academia Sinica.) on February 2nd 2004 at 348 GHz (m) with 7 antennas in its so far most extended configuration with baselines between 15 and 205 m. The phase center was the nominal position of source I as given by Plambeck et al. (1995): R.A. [J2000] and Dec. [J2000] . For bandpass calibration we used the planets Jupiter and Mars. The flux scale was derived by observations of Callisto and is estimated to be accurate within 15%. Phase and amplitude calibration was done via frequent observations of the quasar 0420-014 about 17∘ from the phase center. The zenith opacity measured with the NRAO tipping radiometer located at the Caltech Submillimeter Observatory was excellent with . The receiver operates in a double-sideband mode with an IF band of 4-6 GHz. The correlator has a bandwidth of 2 GHz and the spectral resolution was 0.825 MHz corresponding to a velocity resolution of 0.7 km s-1. System temperatures were between 250 and 600 K. The rms in the final image is 35 mJy, mainly determined by the side-lobes of the strongest source, the hot core. The synthesized beam is . We calibrated the data within the IDL superset MIR developed for the Owens Valley Radio Observatory and adapted for the SMA, the imaging was performed in MIRIAD. For more details on the array and its capabilities see the accompanying paper by Ho et al. (2004).
On the shortest baselines, there is nearly no line-free part in the 2 GHz spectral window (see also Schilke et al. 1997), whereas on the longest baselines only the strongest lines remain. Taking spectra toward selected sources (I, n, hot core, SMA1), we find that only the outflow tracers – thermal SiO and SO2 – are strong toward the sources I and n. Emissions from other species are concentrated toward the hot core and SMA1 and are not observed toward the sources I and n (the line data will be published elsewhere). Therefore, to construct a pseudo-continuum from the spectral line data we excluded the strongest lines from the spectrum (e.g., SiO, SO2), and averaged the rest of the spectrum (about 1.65 GHz) into a continuum channel. We estimate that the derived sub-mm continuum fluxes of the sources I and n are accurate within the calibration uncertainty of 15%, whereas the other sources in the field are contaminated by line emission, and thus their measured fluxes are upper limits.
3 Results
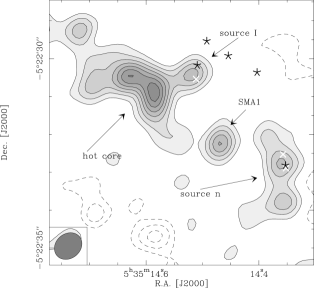
The integrated flux within the field mapped by the SMA is only a few Jy, whereas the flux measured with single-dish instruments is Jy (Schilke et al., 1997). Therefore, we filter out more than 90% of the flux of the region and just sample the most compact components within the massive star-forming cluster (Figure 1). Clearly, we distinguish source I from the hot core. The positional offset between the sub-mm peak and the radio position of source I from Menten & Reid (1995) is which is about our calibration uncertainty. Source I is the only source still detected on the longest baselines and thus must be extremely compact. Even the intrinsically strongest source, the hot core, vanishes at the largest baselines ( k). Furthermore, we detect a sub-mm counterpart to the infrared and radio source n, and another new source approximately between the sources I and n which we label SMA1 (the fluxes of all sources are given in Table 1). The image of SMA1 as well as source n is sensitive to the chosen uv-range. However, using all data of this observation with different weighting and data reduction schemes both features are consistently reproducible. Comparing our data with mm continuum images of the region (Plambeck et al., 1995; Blake et al., 1996), we do detect source n in the sub-mm band although it was not detected previously at mm wavelengths. The morphology of the hot core is similar in the previous mm observations and the new sub-mm continuum data. However, both mm datasets with lower spatial resolution only show a small elongation toward SMA1 whereas we resolve it as a separate emission peak at 865 m with sub-arcsecond resolution. It is possible that SMA1 is embedded within the larger scale hot core which is filtered out by the extended array configuration we use. Therefore, it is difficult to judge whether SMA1 is a separate source of maybe protostellar nature or whether it is just another peak of the hot core ridge.
4 Discussion
Source I: The brightness temperature of the continuum emission from source I at 43 GHz ranges from 1600 K at the emission peak to about 800 K near the south-east and north-west edges of the source (Menten et al. in prep.). This could either be optically thin emission from gas at K, where hydrogen is ionized (proton-electron free-free), or partially optically thick emission from gas at K, where atomic and molecular hydrogen is neutral and electrons come from the partial ionization of metals (H- and H free-free; these terms are used even though the interactions of the hydrogen and electrons do not involve bound states of negative ions). The latter case applies to the radio photospheres of Mira variables at roughly 2 stellar radii (Reid & Menten, 1997). Figure 2 shows the spectral energy distribution (SED) for source I from 8 to 348 GHz. Two interpretations of the data are possible.
Proton-electron free-free+dust emission: As we are dealing with a young massive star-forming region, one can fit the lower-frequency part of the spectrum with proton-electron free-free emission (from now on labeled as free-free emission), whereas in the sub-mm band protostellar dust emission starts to dominate the spectrum (e.g., Hunter et al. 2000). Figure 2 shows three different SEDs for the free-free emission with various density distributions that can fit the data from 8 to 86 GHz. The models with density gradients were done within the procedures outlined in Keto (2002, 2003). While the model with uniform density yields approximately constant flux at frequencies greater than 100 GHz, the free-free fluxes further increase in the sub-mm band for Hii regions with density gradients. The uniform density model allows us to calculate the ultra-violet photon flux from the optically thin emission and thus to estimate the luminosity of the source to L⊙ (see, e.g, Spitzer 1998). This is consistent with the dynamical mass estimate M⊙ (Greenhill et al., 2003), corresponding to L⊙. In addition, based on the SiO maser emission, Menten & Reid (1995) state that the source is likely to be rather luminous (probably L⊙). With the data so far, it is difficult to discriminate between the uniform density model and models with density gradients. However, there appears to be excess flux at 348 GHz that is likely due to optically thin dust emission. We can estimate the dust contribution by using the uniform density Hii region model for a lower limit of the free-free contribution mJy, which results in an upper limit for the dust contribution of mJy. Assuming a dust temperature of 100 K and a dust opacity index of 2 (a lower results in too much dust contribution at lower frequencies and degrades the fits), we estimate the resulting gas mass and gas column density from source I to and (for more details on the assumptions and range of errors see, e.g., Hildebrand 1983; Beuther et al. 2002.). This upper limit to the gas mass within the potential circumstellar disk is about an order of magnitude below the approximate dynamical mass of source I of the order 10 M⊙, (Greenhill et al., 2003). This is different from disk studies at the earliest evolutionary stages of massive star formation where estimated disk masses are of the same order as the masses of the evolving massive stars (e.g., IRAS 20216+4104, Zhang et al. 1998). From an evolutionary point of view, this implies that source I should be more evolved than IRAS 20126+4104. In spite of the low gas mass, we find high column densities corresponding to a visual extinction of the order 1000. The extinction toward source I is significantly higher than the toward the close by source IRc2 derived from the infrared data (Gezari, 1992). However, very high extinction is necessary to explain the the non-detection of source I in the near- and mid-infrared as well as the X-ray band (Dougados et al., 1993; Greenhill et al., 2004; Garmire et al., 2000). The column densities have to be at distances from the center between 25 AU (outside the SiO maser emission) and 320 AU (the spatial resolution of the observations).
H- and H free-free: One can also fit a power law to the SED with . This is similar to the spectral index observed toward Mira variable stars (Reid & Menten, 1997). Evidence that the radio continuum forms under Mira-like conditions in a region with a temperature K and a density of cm-3 comes from the detection of SiO masers from source I. The v=1 J=1-0 (43 GHz) SiO maser emission is from the first vibrationally excited state at K above the ground-state, and models of maser pumping require temperatures of roughly 1200 K and hydrogen densities of the order cm-3 for strong maser action (Elitzur, 1992). Since the continuum emission requires only K higher temperature and perhaps a factor of 10 higher density than the SiO masers, the near juxtaposition of these two emitting regions could be just as in Mira atmospheres. The path length needed to achieve H-/H free-free optical depth unity for material at a density of cm-3 and temperature K is AU. The observed spectral index at cm wavelengths is slightly under 2 for both Miras and source I, suggesting roughly similar variations of opacity with radius. This model has the benefit that the a single power-law can explain the observed spectral energy distribution between 8 and 350 GHz.
The disk observed toward source I extends roughly (25 AU) from the star (Greenhill et al., 2003). If we assume that there is strong opacity at infrared wavelengths (i.e., optically thick near the peak of a 1600 K blackbody) then the luminosity of the source will be given by . For a thin disk with a temperature of 800 K at the outer radius of 25 AU and an assumed typical temperature profile of between 4 and 25 AU from the center (e.g., Reid & Menten 1997), the luminosity is L⊙. This is consistent with source I being a luminous object (of the order L⊙, Menten & Reid 1995) but not exceeding the total luminosity of the KL region ( L⊙, Genzel & Stutzki 1989). The dynamical mass of source I is estimated to M⊙ (Greenhill et al., 2003), corresponding to L⊙. Thus a simple, consistent case can be made that the continuum emission from source I has H-/H free-free as the dominant source of opacity and that there is a transition between a disk photosphere and the SiO maser emission at a radius of AU.
Solving the problem: While observations at 230 GHz might already help in discriminating between both scenarios, the flux differences are more obvious at higher frequencies (Fig. 2). The free-free + dust emission models predict 690 GHz fluxes Jy, whereas the H-/H free-free model predicts fluxes on the order 1.2 Jy. SMA observations at 690 GHz should easily discriminate between both scenarios.
Source n: We detect a sub-mm counterpart to source n plus an adjacent sub-mm source about to the south. Morphologically, these two sub-mm sources resemble the bipolar radio structure observed by Menten & Reid (1995), but the radio structure is on smaller scales () within the sub-mm counterpart of source n. The southern sub-mm source and the northern elongation of the dust emission of source n follow approximately the direction of the H2O maser outflow and the bipolar radio source. It is tempting to associate these features as potentially caused by the outflow, but as we cannot set tighter constraints we refrain from this interpretation. Source n is detected at a 1 mJy level at 8 GHz and not detected down to a threshold of 2 mJy at 43 GHz (Menten & Reid, 1995). Assuming that the cm flux is due to free-free emission, its contribution at 348 GHz is negligable. Therefore, the observed sub-mm flux likely stems from optically thin dust emission. Employing the same assumptions as for source I, we again can calculate the gas mass and column density to and . There is still no general consensus as to which sources are the driving engines of the outflows observed in H2O emission, and both sources, I and n, are possible candidates. Recently, extended mid-infrared emission was observed toward source n perpendicular to the outflow axis (Greenhill et al., 2004; Shuping et al., 2004) which is interpreted as possibly due to an accretion disk. Furthermore, Luhman (2000) detected CO overtone emission toward source n and interpreted that also in the framework of an irradiated disk. In this scenario, the sub-mm continuum emission stems from this disk, and thus the derived gas mass of M⊙ could correspond to the mass of this potential accretion disk. The mid-infrared observations of source n indicate a non-edge-on orientation of the disk (Shuping et al., 2004; Greenhill et al., 2004). The new sub-mm continuum data, by themselves are consistent with a high column density through the disk are consistent with the inclination scenario.
The hot core and SMA1: The hot core splits up into at least three sources over a region of about 1000 AU. In comparison, Greenhill et al. (2004) report that the infrared source IRc2 also splits up into a similar amount of sources on small spatial scales indicating possible very high source densities. However, it is not settled yet whether the hot core and/or IRc2 are internally or externally heated. In the latter case, the hot core is just the remnant of the dense core from which the other sources have formed. The source SMA1 is associated with strong CH3CN emission (to be presented elsewhere) and has no cm or infrared counterpart. Assuming that this condensation is protostellar in nature it would be one of the youngest sources in the whole Orion-KL region. In addition, the location of SMA1 between source I and n is intriguing, and one has to take this source into account as a possible driving source of one or the other outflow in the KL region. However, as it is close to the hot core and shows similar emission line signatures, one can also associate it with the hot core and thus question whether the source is externally or internally heated. As the derived flux values of the hot core and SMA1 are line contaminated we refrain from a further interpretation of these parameters.
References
- Allen & Burton (1993) Allen, D. A. & Burton, M. G. 1993, Nature, 363, 54
- Beuther et al. (2002) Beuther, H., Schilke, P., Menten, K. M., et al. 2002, ApJ, 566, 945
- Blake et al. (1996) Blake, G. A., Mundy, L. G., Carlstrom, J. E., et al. 1996, ApJ, 472, L49+
- Chernin & Wright (1996) Chernin, L. M. & Wright, M. C. H. 1996, ApJ, 467, 676
- Chrysostomou et al. (1997) Chrysostomou, A., Burton, M. G., Axon, D. J., et al. 1997, MNRAS, 289, 605
- Dougados et al. (1993) Dougados, C., Lena, P., Ridgway, S. T., Christou, J. C., & Probst, R. G. 1993, ApJ, 406, 112
- Elitzur (1992) Elitzur, M. 1992, Astronomical masers (Astronomical masers Kluwer Academic Publishers (Astrophysics and Space Science Library. Vol. 170), 365 p.)
- Garmire et al. (2000) Garmire, G., Feigelson, E. D., Broos, P., et al. 2000, AJ, 120, 1426
- Genzel & Stutzki (1989) Genzel, R. & Stutzki, J. 1989, ARA&A, 27, 41
- Gezari (1992) Gezari, D. Y. 1992, ApJ, 396, L43
- Greenhill et al. (2003) Greenhill, L. J., Chandler, C. J., Reid, M. J., et al. 2003, in IAU Symposium
- Greenhill et al. (2004) Greenhill, L. J., Gezari, D. Y., Danchi, W. C., et al. 2004, ApJ, 605, L57
- Hildebrand (1983) Hildebrand, R. H. 1983, QJRAS, 24, 267
- Ho et al. (2004) Ho, P., Moran, J., & Kwok, Y. L. 2004, ApJ Letter submitted
- Hunter et al. (2000) Hunter, T. R., Churchwell, E., Watson, C., et al. 2000, AJ, 119, 2711
- Keto (2002) Keto, E. 2002, ApJ, 580, 980
- Keto (2003) —. 2003, ApJ, 599, 1196
- Luhman (2000) Luhman, K. L. 2000, ApJ, 544, 1044
- Menten & Reid (1995) Menten, K. M. & Reid, M. J. 1995, ApJ, 445, L157
- Plambeck et al. (1995) Plambeck, R. L., Wright, M. C. H., Mundy, L. G., & Looney, L. W. 1995, ApJ, 455, L189+
- Reid & Menten (1997) Reid, M. J. & Menten, K. M. 1997, ApJ, 476, 327
- Schilke et al. (1997) Schilke, P., Groesbeck, T. D., Blake, G. A., & Phillips, T. G. 1997, ApJS, 108, 301
- Schultz et al. (1999) Schultz, A. S. B., Colgan, S. W. J., Erickson, E. F., et al. 1999, ApJ, 511, 282
- Shuping et al. (2004) Shuping, R. Y., Morris, M., & Bally, J. 2004, AJ accepted
- Spitzer (1998) Spitzer, L. 1998, Physical Processes in the interstellar medium
- Stolovy et al. (1998) Stolovy, S. R., Burton, M. G., Erickson, E. F., et al. 1998, ApJ, 492, L151+
- Tan (2004) Tan, J. C. 2004, ApJ accepted
- Wright et al. (1995) Wright, M. C. H., Plambeck, R. L., Mundy, L. G., & Looney, L. W. 1995, ApJ, 455, L185+
- Zhang et al. (1998) Zhang, Q., Hunter, T. R., & Sridharan, T. K. 1998, ApJ, 505, L151
| Source | |||||
|---|---|---|---|---|---|
| mJy beam-1 | mJy | K | M⊙ | cm-2 | |
| Source I | 320 | 320a | 6.2 | 0.2 | 8.5 1024 |
| Source n | 300 | 360 | 7.0 | 0.27 | 5.7 1024 |
| SMA1b | 360 | 360a | 7.0 | – | – |
| Hot coreb | 540 | 1870 | 10.5 | – | – |