SIMULTANEOUS CONSTRAINTS ON THE SPECTRUM OF THE EXTRAGALACTIC BACKGROUND LIGHT AND THE INTRINSIC TeV SPECTRA OF Mrk 421, Mrk 501, and H1426+428
Abstract
Very high energy ( TeV) -rays from blazars are attenuated by photons from the extragalactic background light (EBL). Observations of blazars can therefore provide an ideal opportunity for determining the EBL intensity if their intrinsic spectrum is known. Conversely, knowledge of the EBL intensity can be used to determine the intrinsic blazar spectrum. Unfortunately, neither the EBL intensity nor the intrinsic blazar spectrum is known with high enough precision to accurately derive one quantity from the other. In this paper we use the most recent data on the EBL to construct twelve different realizations representing all possible permutations between EBL limits and the detections in the different wavelength regions. These realizations explore a significantly larger range of allowable EBL spectra than any previous studies. We show that these realizations can be used to explore the effects of the EBL on the inferred spectra of blazars. Concentrating on the two relatively nearby ( 0.03) blazars Mrk 421 and 501, we derive their intrinsic spectra and peak -ray energies for the different EBL realizations. Some EBL spectra give rise to “unphysical” intrinsic blazar spectra, characterized by an exponential rise at high TeV energies. We use the F-test to show that some of these exponential rises are statistically insignificant. Consequently, statements regarding the existence of a ”IR background-TeV -ray crisis” are unfounded on the basis of our present knowledge of the EBL. EBL spectra that do give rise to unphysical blazar spectra are regarded as invalid realizations of the EBL. Those that do not, define new constraints on the EBL spectrum, and are used to derive new limits on the intensity and the peak -ray energy of these two blazars. In particular, we derive an upper limit of 15 nW m-2 sr-1 on the 60 m EBL intensity, and find the peak energies of the two Mrk 421 and Mrk 501 sources to be very similar, between 0.5–1.2 TeV and 0.8–2.5 TeV, respectively. We also show that the intrinsic spectrum of Mrk 421 during a period of intense flaring activity has a peak energy that seems to shift to higher energies at higher flux states. Finally, we show that most EBL realizations show that the spectrum of the most distant blazar H1426+428 ( = 0.129) peaks between 1 and 5 TeV, with some suggesting peaks below 400 GeV and above 10 TeV. These results provide important constraints on the different particle acceleration mechanisms and the generation of the -ray emission. Finally we also show that uncertainties in the absolute calibration of the -ray energies with atmospheric Cherenkov telescopes have an important impact on the intrinsic blazar spectra. These systematic uncertainties will be improved with the next generations of telescopes which will also cover a wider range of -ray energies, providing further insights into the intrinsic spectrum of TeV blazars.
1 INTRODUCTION
Observations of blazars at TeV -ray energies provide a view of the high energy tail of blazar spectra, and are instrumental for probing non-thermal phenomena in jets of active galactic nuclei. These spectra provide important constraints on the particle acceleration mechanism that generates -ray photons in the jets of active galactic nuclei, the cooling processes by which particles dissipate their energy into electromagnetic radiation, and on the astrophysical conditions in the acceleration region. TeV observations therefore might offer a powerful way for discriminating between different -ray emission models, recently reviewed by Coppi (2003).
To the dismay of -ray astronomers, high energy -rays traveling cosmological distances are attenuated en route to Earth by interactions with photons from the extragalactic background light (EBL; Gould & Schréder 1967; Stecker, de Jager, & Salamon 1992). Consequently, particle acceleration mechanisms and -ray production models can only be tested after the observed blazar is corrected for this attenuation.
However, to the delight of infrared (IR) astronomers, the attenuation of TeV -rays can be used to constrain the intensity and spectrum of the EBL in the wavelength region where its direct measurement is most difficult. Defined here as the diffuse background light in the 0.1 to 1000 m wavelength regime, the EBL is the second most important radiative energy density in the universe after the cosmic microwave background. It is the repository of all radiative energy inputs in the universe since the epoch of decoupling (Partridge & Peebles 1967; Hauser & Dwek 2001). It therefore contains important information on the release of nuclear, gravitational, and possible exotic forms of energy throughout most of the history of the universe. Unfortunately, direct measurement of the EBL in the 5 to 60 m wavelength region is greatly hampered by foreground emission from interplanetary dust (Hauser et al. 1998; Kelsall et al. 1998). Consequently, TeV ray observations may be the only way to constrain or determine the EBL in this wavelength regime.
Early studies (e.g. Stecker, de Jager, & Salamon 1992; Dwek & Slavin 1994; Biller et al. 1995) assumed that the intrinsic spectrum of blazars is a power law in energy of the form , and searched for a “break” in the spectrum that could be attributed to attenuation by the EBL. In a more recent paper, Costamante, Aharonian, Horns, & Ghisellini (2004) used assumptions that reach beyond these early attempts relying on a ”break” in the spectrum: they require that the spectrum be ”smooth”, to derive limits on the EBL. Some of the earlier approaches have been largely discarded with the realization that blazar spectra are considerably more complex, characterized by an energy dependent spectral index and variable intensity (Samuelson et al. 1998; Aharonian et al. 1999, 2002a; Djannati-Ataï et al. 1999; Krennrich et al. 1999, 2001, 2002). Construction of the intrinsic blazar spectrum requires therefore a detailed knowledge of the -ray production mechanism. For example, Coppi & Aharonian (1999) suggested using contemporaneous X-ray/-ray variations in the blazar emission in conjuncture with a synchrotron self-Compton emission model to estimate the intrinsic TeV spectrum of the blazar from its X-ray spectrum. Differences between this intrinsic spectrum and the observed can then be used to estimate the amount of intergalactic absorption and the intensity of the EBL. However, there still is no consensus on the -ray emission model, which prompted an alternate approach of using either theoretical EBL models, or observed EBL limits and detections in order to place constraints on the intrinsic blazar spectra (Guy et al. 2000; Renault et al. 2001; Dwek & de Jager 2001; Primack, Somerville, Bullock, & Devriendt 2001; Kneiske, Mannheim, & Hartmann 2002; Kneiske, Bretz, Mannheim, & Hartmann 2004; and Wright 2004 ).
In this paper we use the most recent data on the EBL to construct twelve different realizations, representing all possible permutations between EBL limits and the detections in the different wavelength regions, to explore the effects of the EBL on the inferred spectra of blazars. We focus on the determination of the intrinsic energy spectra of the two most prominent and nearby TeV blazars, Mrk 421 and Mrk 501 which have been measured with good statistical precision at energies between 260 GeV and 20 TeV (Samuelson et al. 1998; Aharonian et al. 1999, 2002a; Krennrich et al. 1999, 2001, 2002; Djannati-Ataï et al. 1999). Some claimed EBL detections, notably the 60 m intensity derived by Finkbeiner, Davis, & Schlegel (2000), produce a pile-up of photons in the highest energy bins of the intrinsic blazar spectrum. This pile-up has led to claims of the existence of a “TeV–IR Background crisis” (Protheroe & Meyer 2000). However, the EBL spectrum required for calculating the -ray opacity towards these sources, consist largely of upper and lower limits and few 3 level detections in the 0.1 - 200 m wavelength region (Hauser & Dwek 2001). Uncertainties in the EBL spectrum propagate exponentially into the derived blazar spectrum, a fact that has been largely ignored by previous investigators (e.g. Konopelko et al. 2003). Consequently, any statements claiming the existence of a “TeV–IR Background crisis” are unfounded considering the uncertainties in the EBL intensity and the observed -ray fluxes in the highest energy bins.
In spite of the uncertainties in the detailed spectral behavior of the EBL, its general double–peak nature is well established. The peaks at 1 and 100 m, are associated with energy releases from stars and dust, respectively. The drop in the EBL spectrum between these two peaks (m) moderates the rise in the TeV opacity with ray energies, creating an opportunity for extracting the intrinsic 200 GeV to 10 TeV spectrum of these nearby blazars.
Using the observed detections and limits on the EBL we create a family of EBL spectra representing different realizations of the EBL, bounding extreme limits in the UV optical and IR-submillimeter wavelength regions. The EBL spectra used in our analysis cover a significantly wider range of intensities than the two ”extreme” spectra considered by de Jager, and Stecker (2002), Konopelko et al. (2003), and the range of EBL spectra recently derived by Kneiske et al. (2004). The family of EBL spectral templates are used to derive the -ray optical depth to the observed blazars, to construct the intrinsic spectra of Mrk 421, Mrk 501, and H1426+428, and to examine spectral trends in the intrinsic variability of Mrk 421. We show that several intrinsic spectra display ”unphysical” characteristics, manifested as an exponential rise with energy, that can be directly related to the spectrum of the EBL used for calculating the -ray attenuation. Aharonian, Timokhin, & Plyasheshnikov (2002b, ATP02) suggested that a pile-up of photons in the highest energy bins actually represents the intrinsic blazar spectrum, and presented a model in which the 10-20 TeV photons are produced by the comptonization of ambient optical photons by an ultrarelativistic jet. However, the exponential rises produced by some EBL realizations are unbounded, extending well beyond the highest energy bins in the blazar spectrum, and are therefore unlikely to be generated by the proposed ultrarelativistic jet-model.
The exponential rises in the blazar spectrum derived here result from correcting the observed -ray fluxes in the highest energy bins for EBL absorption. Uncertainties in the observations may affect the “reality” of some of these exponential rises. We therefore employ the statistical F-test to examine the significance of these rises. Blazar spectra that are confirmed to be unphysical are then used to set new limits on the EBL. We derive the peak energies in the well-behaved intrinsic blazar spectra, and discuss the relevance of these results for blazar unification models (Costamante et al. 2001).
Another source of uncertainty in the blazar spectrum is the absolute energy of the -ray photons. We therefore examine the effect of these uncertainties on the intrinsic blazar spectra and on the ability to constrain the EBL. Finally, we also examine whether the TeV optical depth towards Mrk 421 and 501, which are located at an almost identical redshift of 0.03, may differ due to statistical fluctuations in the number of sources along their line of sight.
The paper is organized as follows: In §2 we present the observed ray spectrum of Mrk 421, Mrk 501, and H1426+428 and the spectral variability of Mrk 421. The current status of the detection and limits of the EBL are described in §3, where we also present the different spectral realizations of the EBL. In §4 we derive the -ray opacity for all the EBL realizations. The attenuation corrected spectra of Mrk 421 and Mrk 501 are presented in §5, and EBL realizations leading to unphysical intrinsic spectra are identified. The constraints on the EBL derived from analysis of the intrinsic blazar spectrum are discussed in §6. Blazar spectra corrected for absorption by the viable EBL realizations are presented in §7. A brief summary of the paper is presented in §8.
2 GAMMA-RAY DATA OF MRK 421, MRK 501 AND H1426+428
The -ray data used for this study were obtained by two experimental groups, the VERITAS collaboration using a single 10 m diameter imaging atmospheric Cerenkov telescope at the Whipple observatory (Finley et al. 2001) in southern Arizona and the HEGRA collaboration using an array of smaller size imaging atmospheric Cerenkov telescopes (Daum et al. 1997) on La Palma, Canary Islands. The atmospheric Cerenkov technique is prone to uncertainties in the absolute energy scale of the -ray photons resulting from systematic uncertainties in modeling the Earth’s atmosphere, and uncertainties in the temporal variations of its transparency. These uncertainties limit the accuracy of the absolute energy calibration of the TeV -rays to 15%, and can have an important effect on the correction applied to the observed blazar spectrum due to absorption by the EBL. A consistency check of the magnitude of major systematic uncertainties of different atmospheric Cerenkov experiments is given by measurements of the Crab Nebula, the standard candle of -ray astronomy. The energy spectra of the Crab Nebula measured by the Whipple telescope and the HEGRA detector are in agreement within systematic errors (for further details see also Aharonian et al. 2000; Hillas et al. 1998).
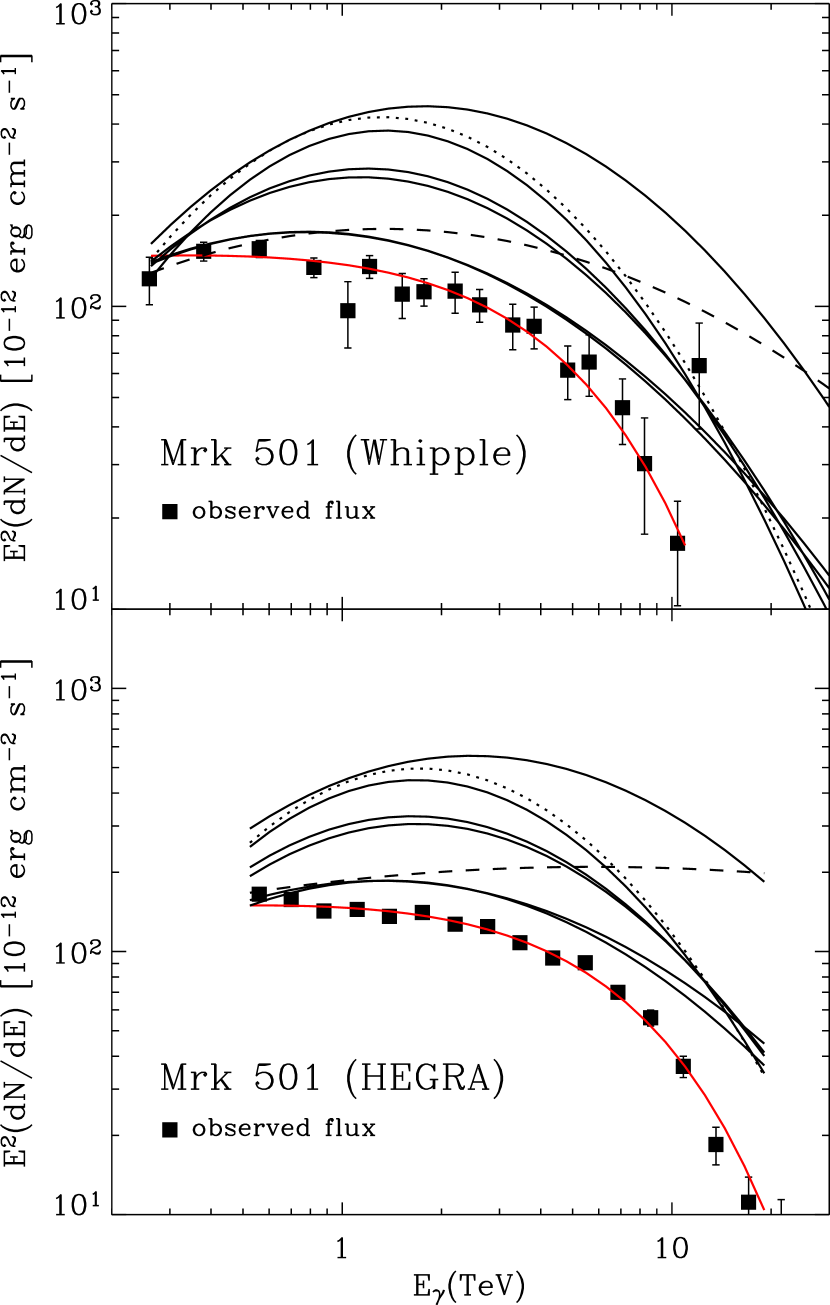
This study is primarily concerned with the two most prominent blazars in TeV gamma-ray astronomy, Mrk 421 and Mrk 501. Both received a lot of attention because of their episodes of strong flaring activity. Furthermore, at redshifts of 0.031 and 0.034, respectively, they are approximately at the same distance from the observer, suggesting that absorption by the EBL should affect them similarly. Mrk 501 was discovered as a -ray blazar at TeV energies (Quinn et al. 1996) and to a great surprise underwent a strong and long-lasting flaring state during the first half of 1997 (Catanese et al. 1997; Aharonian et al. 1997; Djannati-Ataï et al. 1999; Protheroe et al. 1998). The good statistics of these data led to the discovery of a first spectral feature in a TeV blazar, the detection of a cutoff manifested as a strong deviation of d/d from an extrapolated power law, at approximately 4 TeV (Samuelson et al. 1998). Detailed spectral measurements by other groups independently confirmed this cutoff feature (Aharonian et al. 1997, 1999; Djannati-Ataï et al. 1999). The combined Whipple and HEGRA data cover an energy range between 260 GeV and 20 TeV, making the energy spectrum of Mrk 501 an interesting constraint to the EBL density.
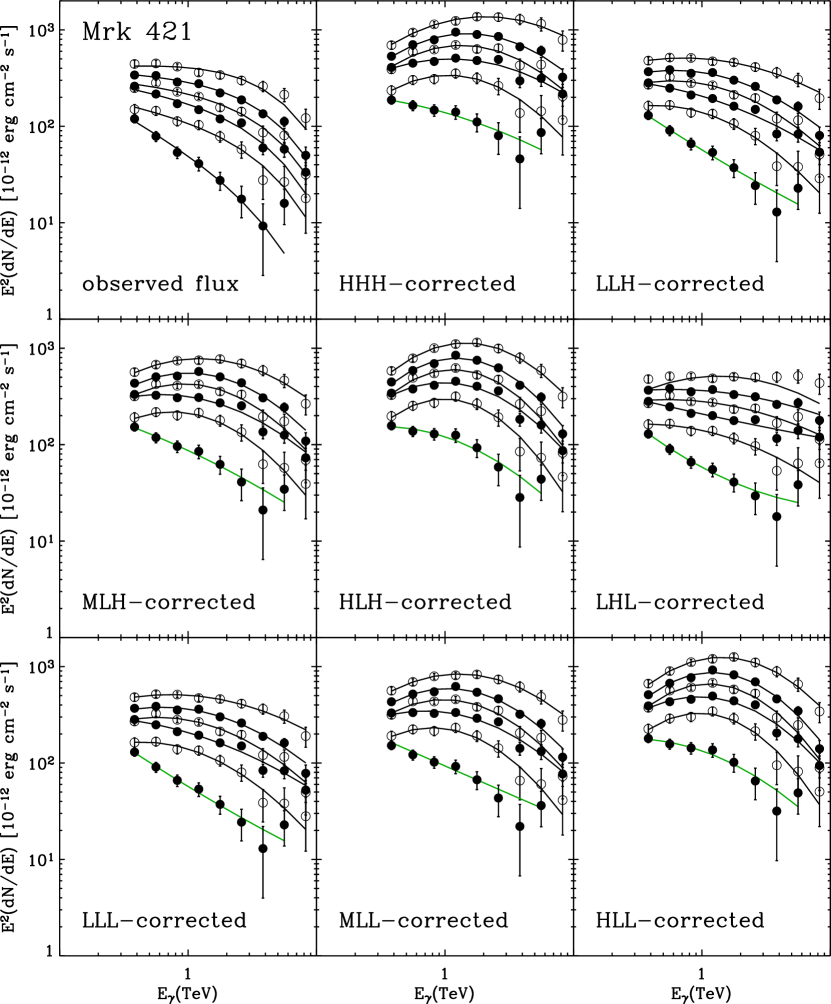
The second blazar that we discuss in detail in this paper is Mrk 421, which was established as a TeV source by Punch et al. (1992). Although strong and short flares were observed in 1995 and in 1996 (Gaidos et al. 1996), those data were not sufficient to unravel spectral features beyond a power law index (Zweerink et al. 1997; Krennrich et al. 1999). This changed when an active episode of long-lasting strong flares occurred for Mrk 421 in 2000/2001, providing the best statistics ever recorded for a -ray blazar and also showing a cutoff at approximately 4 TeV (Krennrich et al. 2001; Aharonian et al. 2002a). The flaring data from the observing season of 2000/2001 have also been used to study the flux spectral index as a function of the flux level. The data have been binned according to flux levels resulting into 6 data sets at different flux levels (Krennrich et al. 2002). These data have unraveled for the first time significant spectral variability at TeV energies.
The spectral data of Mrk 421 and Mrk 501 from the two experiments are complementary. The Whipple 10 m telescope data start at 260 GeV extending out to 17 TeV for Mrk 421 and out to 12.1 TeV for Mrk 501, whereas the HEGRA observations start at 560 GeV and extend to 17 TeV for Mrk 421 and to 21 TeV for Mrk 501. Due of the wealth of statistics, the uncertainties in the data are dominated by systematic uncertainties in the absolute calibration of the Whipple and HEGRA instruments. Consequently, we refrain from combining the data and analyze them separately.
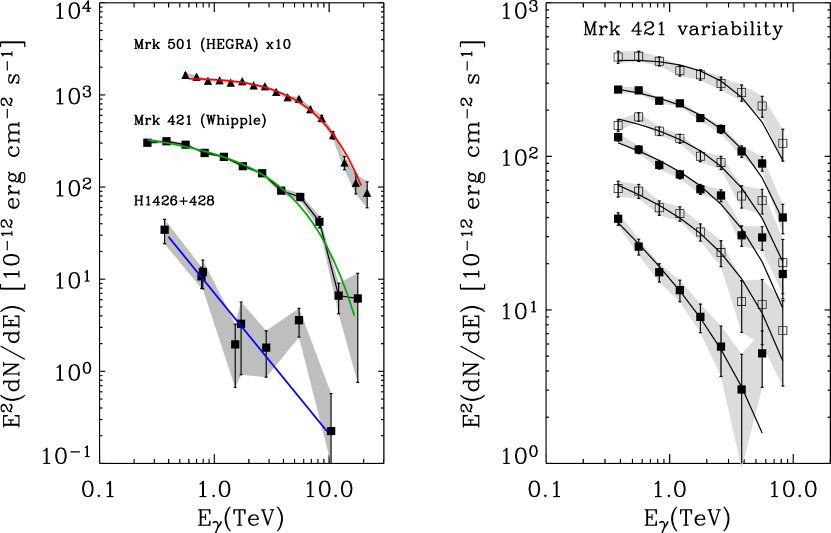
Finally, we present spectral data from a first more distant (=0.129) TeV blazar, H1426+428, which was discovered as a TeV source by Horan et al. (2000, 2001a, 2001b, 2002) and confirmed by Aharonian et al. (2002a) and Djannati-Ataï et al. (2002). We use the spectral data from the HEGRA collaboration (Aharonian et al. 2002a) and the Whipple collaboration (Petry et al. 2002). Because of the limited statistics of the spectra from both groups (5.8 and 5.5 sigma detections) we combine the spectra (as was presented in Petry et al. 2002). This is possible since the statistical errors dominate over the systematic uncertainties for this data set. Figure 1 summarizes the observed spectra of the three blazars, and presents the observed spectral variability of Mrk 421.
3 REALIZATIONS OF THE EXTRAGALACTIC
BACKGROUND LIGHT
3.1 Observational Limits and Detections of the EBL
The EBL is viewed through strong sources of foreground emission consisting of reflected sunlight and thermal emission from zodiacal dust particles, resolved and diffuse Galactic starlight, diffuse emission from interstellar dust, and emission from resolved Galactic H II regions and nearby galaxies (LMC, SMC). The relative contribution of these different foreground emission components varies significantly over the 0.1 to 1000 m wavelength range of the EBL.
Removal of the zodiacal dust emission from the observed sky maps posed the greatest challenge for the detection of the EBL in the 1 to 1000 m wavelength region. Thermal emission from the zodiacal cloud dominates the foreground in the 5–100 m wavelength region with an intensity of nW m-2 sr-1 between 15 and 30 m in the direction of the Lockman Hole. This intensity is about a factor of larger than the average EBL intensity expected from nucleosynthesis arguments, illustrating the difficulty of separating this component from the EBL. The subtraction of the zodiacal dust emission was described in detail by Kelsall et al. (1998). The procedure modeled the variation in the sky intensity caused by the Earth’s motion through the IPD cloud and the DIRBE scanning pattern. Any zodiacal dust model is therefore insensitive to any isotropic emission component of the cloud. The uncertainties in the intensity of this component were determined from the variance in its value, obtained by modeling the primary dust cloud with different geometrical configurations which produced about equally good fits to the observed variations in the sky brightness. The Kelsall et al. (1998) zodiacal light model (KZL model hereafter) succeeded in subtracting 98% of the thermal emission from the zodi cloud. The residual 5 to 100 m emission exhibited a strong peak at 15–30 m. It had large systematic uncertainties and was far from isotropic, preventing its identification as a component of the EBL.
Arguing that the 15 to 30 m residual must be mostly of solar system origin (otherwise the observed TeV blazars would not be detectable), Gorjian et al. (2000) used a zodiacal dust model similar to the KZL model, but imposed a “very strong no-zodi principle” (Wright 2001), requiring that the 25 m residual after the removal of the zodiacal emission be zero at high Galactic latitudes. We will hereafter refer to this zodiacal light model as the GWZ model. The resulting contribution of the GWZ model to the foreground emission is therefore larger than that of the KZL model, resulting in lower values for the EBL intensity in the 1.25 to 5 m wavelength region.
Galactic starlight is an important contributor to the foreground emission at near infrared wavelengths ( 1–5 m), and the removal of this component from the DIRBE skymaps was discussed in detail by Arendt et al. (1998). The systematic uncertainties in the 1 – 5 m residuals were dominated by uncertainties in the model used to subtract the emission from unresolved stars. Since then significant efforts have been undertaken to improve the removal of the Galactic stellar emission component, resulting in the detection of the EBL at 1.25, 2.2, and 3.5 m (Dwek & Arendt 1998, Wright & Reese 2000, Wright 2001, Cambrésy et al. 2001, Arendt & Dwek 2003). Larger values for the EBL at these wavelengths were obtained by Cambrésy et al. (2001) and Matsumoto et al. (2000), who used the KZL–model to subtract the zodiacal foreground. Use of the GWZ–model, which is characterized by a larger contribution of the zodiacal dust cloud to the foreground emission, will give rise to a lower EBL intensity. The dependence of the near–IR EBL intensity on the model used for the subtraction of the zodiacal emission is discussed by Arendt & Dwek (2003) and illustrated in Figure 6 of their paper. All COBE/DIRBE derived EBL intensities at between 1 and 2 m are significantly higher than those derived by Madau & Pozzetti (2000) from galaxy number counts. This should not be too surprising, since the integrated light from galaxies provides only a strict lower limit on the EBL intensity, even when the integrated light from the resolved galaxies seems to have converged. Bernstein, Freedman, & Madore (2002) pointed out that a significant fraction of the flux from resolved galaxies can remain undetected, since the overlapping wings of these galaxies can form a truly diffuse background which will be missed in standard galaxy aperture photometry.
At mid–IR wavelengths the EBL has a lower limit at 15 m, derived from galaxy number counts obtained with the Infrared Space Observatory (ISO) satellite (Elbaz et al. 2002; Metcalfe et al. 2003). The integrated flux from 24 m sources detected in deep surveys with the Spitzer satellite gives a lower limit of 1.90.6 nW m-2 on the EBL intensity, which extrapolated to fainter flux densities provides an estimated EBL intensity of 2.7 nW m-2 sr-1 at that wavelength (Papovich et al. 2004). An upper limit of about 5 nW m-2 sr-1 was derived by Stanev & Franceschini (1998), Renault et al. (2001), and Dwek & de Jager (2001) from TeV -ray considerations. At far–infrared wavelengths, the EBL has been detected at 200 to 1000 m by Puget et al. (1996), Fixsen et al. (1998), at 140 and 240 m by Hauser et al. (1998), and at 100 m by Lagache et al. (2000). Hauser et al. (1998) reported the 140 m EBL intensity derived using the DIRBE photometric calibration. A somewhat lower value (but consistent with the DIRBE calibration) is derived if the FIRAS photometric scale is used in the calibration (Hauser et al. 1998, Hauser & Dwek 2001).
At UV wavelengths Gardner et al. (2000) presented the integrated light obtained from deep galaxy counts using the Space Telescope Imaging Spectrograph (STIS) combined with counts obtained with the FOCA balloon-borne telescope (Milliard et al. 1992). Bernstein, Freedman, & Madore (2002) reported the detection of the EBL at 0.3, 0.55, and 0.8 m, at levels that are higher than the results of Madau & Pozzetti (2000), results that were disputed by Matilla (2003). Current limits and detections of the EBL are presented in Table 1, and depicted in Figure 2.
3.2 Template EBL Spectrum
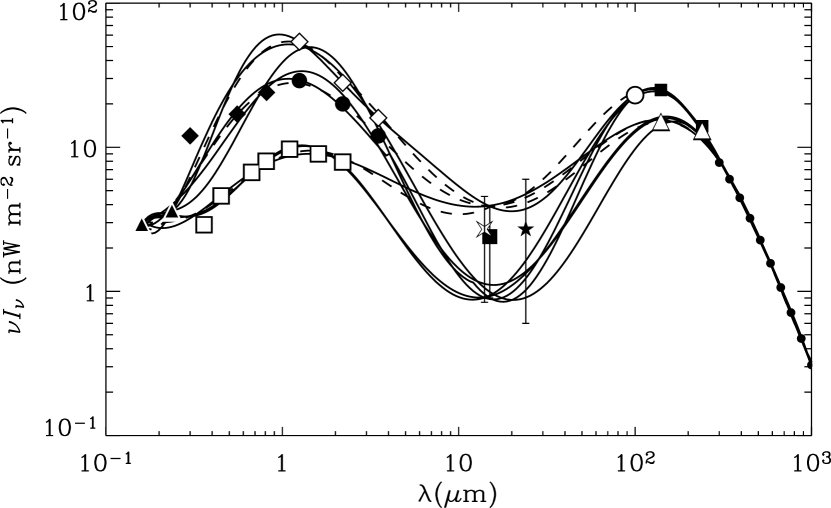
Given the general double–peak nature of the EBL and the uncertainties in its spectral intensity we created a family of EBL spectra spanning extreme possible combinations of relative peak values. Altogether we constructed twelve template spectra, representing different realizations of the EBL, by fitting polynomials to all possible combinations of the following spectral components:
-
1.
Three stellar components consisting of: (1) high–UV: defined by the 0.1595 and 0.2365 m data from Gardner et al. (2000), and the Cambrésy et al. (2001) determinations that used the KZL zodi-light model; (2) mid–UV: defined by the 0.1595 and 0.2365 m data from Gardner et al. (2000), and the Wright (2001) EBL intensity derived by using the GWZ zodi-light model; and (3) low–UV: defined by the 0.1595 and 0.2365 m data from Gardner et al. (2000), and the number counts of Madau & Pozzetti (2000). The three realizations of the stellar components are driven by the near–IR and the 0.1595 and 0.2365 m constraints, and are compatible with the claimed detections by Bernstein et al. (2002), considering the uncertainties in their values.
-
2.
Two mid–IR components, which were defined by the uncertainties in the 15 m lower limit determined by Elbaz et al. (2002) from ISO observations. The high mid–IR EBL is represented by the nominal 15 m intensity , and the low mid–IR EBL is represented by the nominal 15 m intensity .
-
3.
Two far–IR components, defined by the 2 different calibration of the DIRBE 100 and 240 m data points. The DIRBE calibration gives rise to higher values of the EBL compared to the FIRAS calibration (see Table 1). Above 240 m all components were fitted to the FIRAS determination of Fixsen et al. (1998).
Finally, we also constructed an ”average” EBL spectrum, defined by a polynomial fit through the nominal 15 m lower limit, and the average UV and far–IR limits. It is approximate in nature, and only used for illustrative purposes.
For sake of brevity the twelve different EBL realizations will be referred to as XYZ, with X=L, M, or H representing the intensity (low, medium or high) of the stellar component of the EBL, Y=L or H, representing the low or high intensity of the 15 m EBL flux, and Z=L or H, representing the low or high intensity of the EBL flux at far–IR wavelengths. So an EBL realization designated as MHL represents an EBL derived by a polynomial fit through the mid–UV, the high mid–IR, and the low far–IR spectral intensities of the EBL.
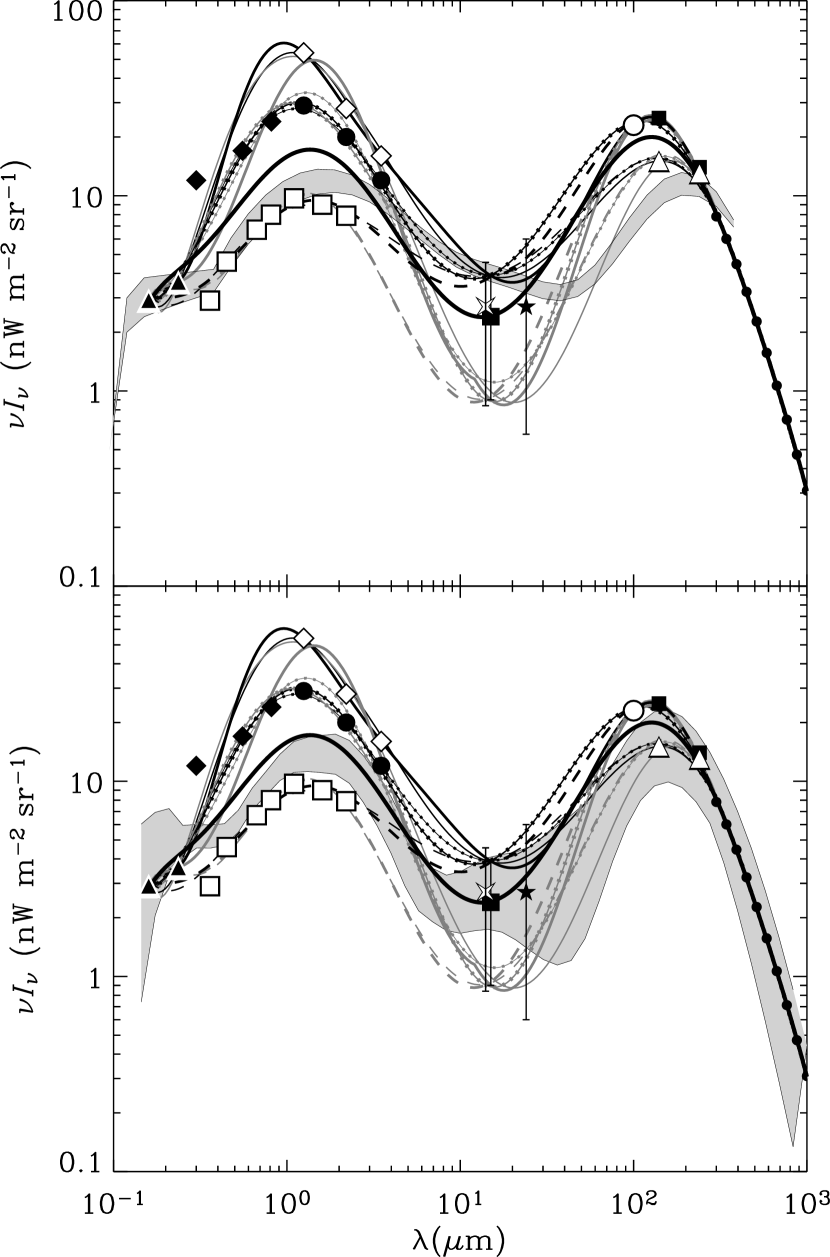
Figure 2 shows the different realizations of the EBL, and the observational data points used in their derivation. The three components are represented in the figure by solid lines (high-UV), lines with connected dots (mid-UV), and dashed lines (low-UV). Lines going through the high mid-IR are black, whereas those going through the low mid-IR point are grey. All lines going through the high far–IR data are thick compared to the ones going through the low far–IR data points. Also shown in the figure is a nominal ”average” EBL spectrum which is represented by a heavy dark line going through the 15 m lower limit. For sake of comparison we also show the range of EBL intensities sampled by the two EBL spectra chosen by de Jager & Stecker (2002) and Konopelko et al. (2003) to represent the EBL limits (shaded area in top figure). The mid– and far–IR intensities of these spectra were derived from simple backward evolution models using highly idealized galaxy spectra (Malkan & Stecker 2001). At UV and optical wavelengths, de Jager & Stecker (2002) augmented these spectra with the integrated galactic light derived by Madau & Pozetti (2000). As is evident from the figure, these two spectra sample a very small range of viable EBL spectra. The bottom panel compares our different EBL realizations with the range of EBL spectra derived by Kneiske et al. (2004) for various cosmic star formation histories. Their models do not reproduce the high EBL intensities at UV to mid-IR wavelengths, a common problem in all EBL models. The data points depicted in the figure are listed in Table 1, and the coefficients of the polynomial approximations are given in Table 2.
4 THE RAY OPACITY OF THE LOCAL UNIVERSE
The cross section for the interaction of a -ray photon of energy emitted from a source at redshift with a background photon of energy is given by (e.g. Jauch & Rohrlich 1955)
| (1) | |||||
where cm2 is the Thompson cross section, the threshold energy of the interaction, and , where is the angle between the incident photons. The - cross section for the interaction with an isotropic distribution of background photons has a peak value of 1.70 cm2 for = 0.70, which corresponds to energies for which the product 1 MeV2, or (TeV), where is the wavelength of the background photon.
The optical depth traversed by a photon observed at energy that was emitted by a source at redshift is given by:
| (2) |
where d is the comoving number density of EBL photons with energies between and d at redshift , , , and where dd, is given by (e.g. Peacock 1999):
| (3) | |||||
where and are, respectively, the matter and radiation energy density normalized to the critical density, is the dimensionless cosmological constant ( = 1 in a flat universe), is the Hubble radius, is the speed of light, and is the Hubble constant, taken here to be 70 km s-1 Mpc-1. The comoving number density of EBL photons of energy at redshift is given by:
where , , and is the specific comoving luminosity density at frequency and redshift .
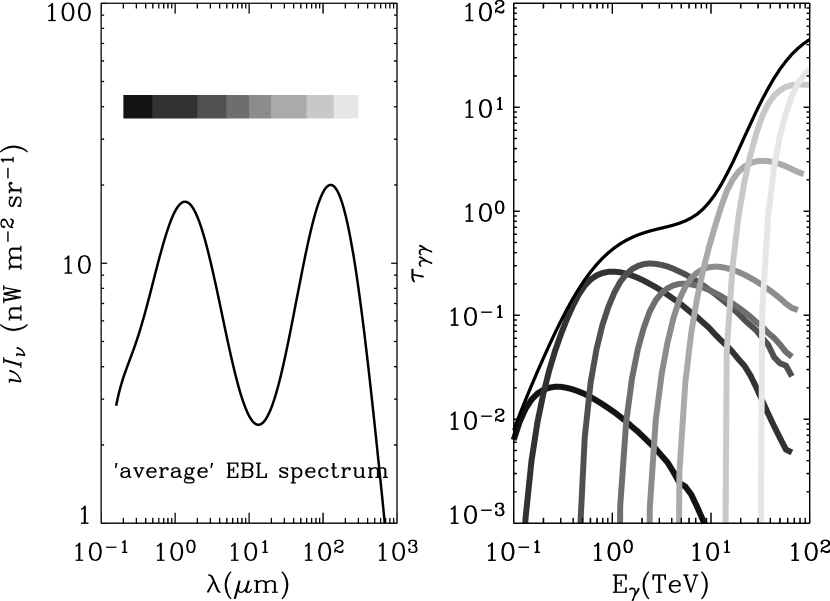
Figure 3 (right panel) depicts the TeV opacity of a source located at redshift = 0.030 to background photons with an EBL spectrum given by the average spectrum depicted in the left panel of the figure (see also Figure 2). The shaded curves in the figure represent the contribution of the different wavelength regions (depicted in the shaded bar diagram in the left panel) to the total opacity. The figure illustrates the relation between the rate of increase in the TeV opacity with -ray energy, and the spectral behavior of the EBL. Particularly noticable is the decrease in the rise of the opacity between 1 and 5 TeV, resulting from the dip in the EBL intensity between the stellar and dust emission peaks.
As an aside, we note that in calculating the -ray opacity we discovered a numerical error of about 40% in the polynomial approximations presented by de Jager & Stecker (2002) which apparently was caused by the coarse grid used in the integration of over angles (de Jager, private communication).
5 NEW GAMMA-RAY DERIVED LIMITS ON THE
EXTRAGALACTIC BACKGROUND LIGHT
INTENSITY
The spectral energy distribution of blazars consists of two spectral components: (1) a low-energy X-ray component, extending up to energies of about 100 keV which is attributed to synchrotron radiation from energetic electrons, and (2) a high-energy -ray component with energies extending to the TeV range, which is usually attributed to inverse Compton (IC) scattering of the synchrotron emission by energetic electrons (Maraschi, Ghisellini & Celotti 1992; Marscher & Travis 1996). Competing models exist for the nature of the particles producing the -ray emission. Leptonic models assume that energetic electrons are the primary particles producing the -rays by IC scattering off the synchrotron emission or other ambient soft photons. Hadronic models assume that the -ray emission is produced by proton-induced synchrotron cascades or by decays of secondary particles such as neutral pions and neutrons (Mannheim & Biermann 1992; Mannheim 1993, 1998) or, alternatively, by synchrotron radiating protons (Mücke & Protheroe 2001; Aharonian 2000).
All the above models predict a decline in the blazar luminosity at the highest -ray energies. Specifically, none of these models predict an exponential rise of luminosity with energy. An exception is the model of Aharonian, Timokhin, & Plyasheshnikov (2002b) which was constructed to explain a possible pile-up in the highest energy bins of the intrinsic blazar spectrum. In their model the intrinsic blazar spectrum rises sharply between 10 and 20 TeV and has an abrupt cutoff at 20 TeV. Coppi (2003) emphasizes that such an upturn in luminosity at TeV energies is not impossible but unlikely, since it would require extremely energetic particles in the jet. Furthermore, the exponential rises produced by some EBL realizations are unbounded and therefore unlikely to be generated by the jet model. Since most blazar models are moderately successful in explaining the gross features of the low and high energy emission peaks in the blazar spectra over a wide range of energies, we consider any exponential rise in a blazar spectrum at TeV energies as “unphysical”.
The intrinsic photon spectrum, (d/d)i, of a blazar located at redshift is given by:
| (5) |
where (d/d)obs, the observed spectrum, can be fit with a function consisting of a power law with an exponential cutoff of the form:
| (6) |
Using the spectral templates representing the various realizations of the EBL described in §3, we calculated the - opacity towards Mrk 421 and 501, and derived their intrinsic -ray spectra. The intrinsic blazar spectrum can be fit by either a parabolic function, , or a parabolic function with an exponential rise, , of the form:
| (7) | |||||
| (8) |
The function is a generalization of , designed to explore intrinsic spectra that show an “unphysical” behavior, characterized by a sudden exponential rise in the function (d/d)i after an initial monotonic decline or flat behavior with energy.
We examined the statistical significance of an exponential rise in the intrinsic blazar spectrum by using the F–test to calculate the probability that the reduction in the of the fit due to the inclusion of the additional parameter exceeds the value which can be attributed to random fluctuations in the data. If the reduction in the is sufficiently large then the exponential rise is statistically significant, the intrinsic spectrum is considered unphysical, and the EBL spectrum causing this behavior is excluded as a viable realization of the EBL.
Let be the ratio , where and are the reduced for and degrees of freedom, respectively. The value of measures the fractional improvement in , and its statistics follow that of the distribution with , and . Each value has therefore an integral probability distribution , which measures the probability that the improvement in the fit was not a random event. Table 3 list the resulting probabilities for the F-test on . A -value of 95% or larger is commonly regarded as significant. Consequently, EBL realizations giving rise to intrinsic spectra for which the exponential rise is significant, are ruled out as viable spectral representations of the EBL, and are labeled ”0” in the table. Acceptable EBLs are designated with a “1”. The table shows that Mrk 501 provided more stringent constraints on EBL scenarios. This is not surprising considering the fact that the -ray observations of this blazar extend to higher energies and have smaller error bars, compared to the observations of Mrk 421.
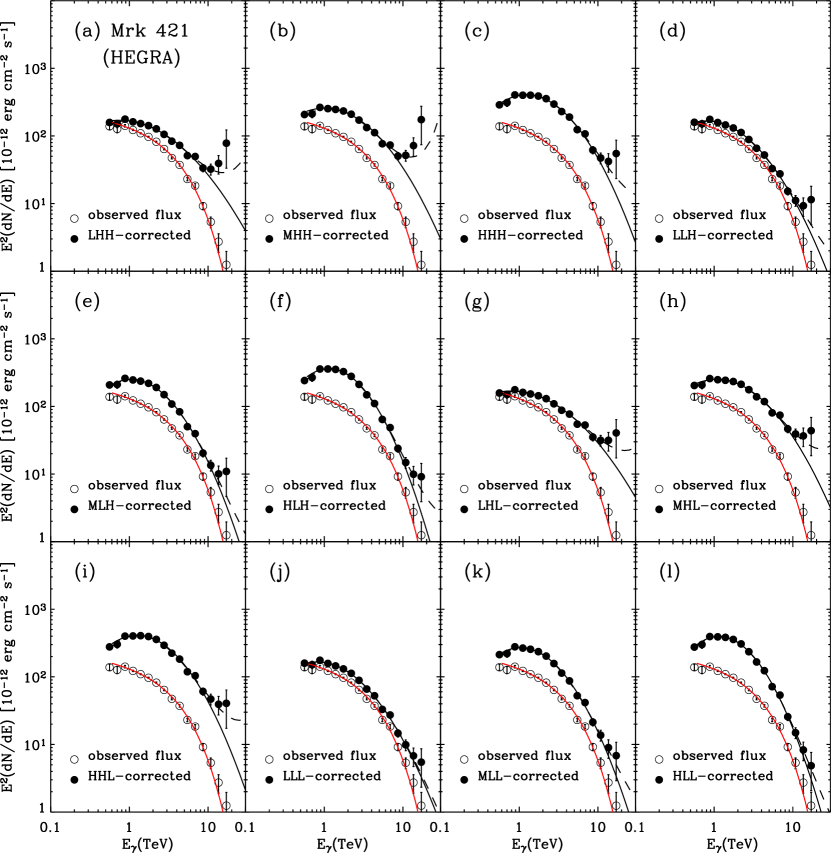
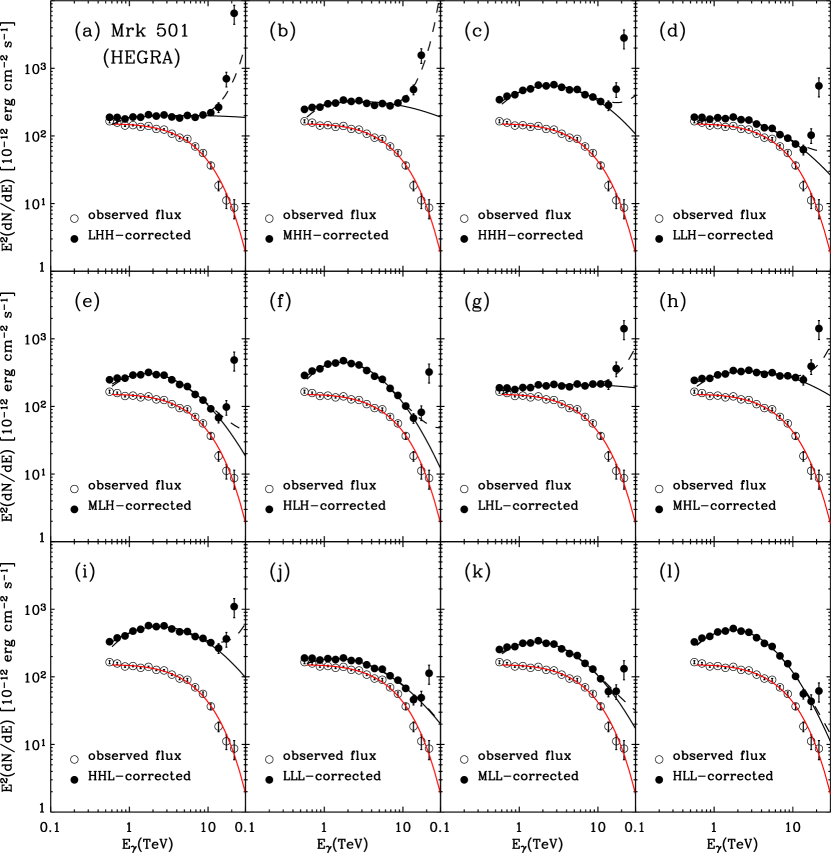
Figures 4 and 5 depict the intrinsic spectra of Mrk 421 and 501, respectively, for all EBL realizations. The figures clearly show the ”unphysical” behavior of the blazar spectra for the LHH, MHH, MHL, and HHL realizations of the EBL. For both sources the intrinsic spectra for these realizations initially decrease with energy, then suddenly increase for at least two data points at energies above 10 TeV. The rise can be directly attributed to the EBL intensity in the wavelength regime contributing to the -ray opacity. All, except two, of the EBL realization with a high mid-IR intensity give rise to unphysical blazar spectra, and are therefore ruled out by the -ray observation. Of the two viable EBL realizations with high mid-IR intensity, LHL has a low UV and low far–IR intensity, and HHH has high UV and high far–IR intensities. So the common characteristic of these two spectra is that they do not connect between opposite extremes in the UV and far–IR intensities of the EBL, that is, high UV to low far–IR and vice versa.
Using only visual inspection of the intrinsic blazar spectra (e.g. Figure 5) , one would be tempted to regard additional realizations such as HHH, LLH, MLH, and LHL unphysical, since they also give rise to an increasing -ray spectrum. However, the rises occur only at the last datum point, and are statistically insignificant. This fact is confirmed by the results of the statistical F-test that show that the confidence level of these rising spectra is not high enough to ascertain their reality. These examples illustrate the importance of conducting rigorous statistical tests over casual visual inspections, for determining the reliability of features in the derived intrinsic spectrum of blazars.
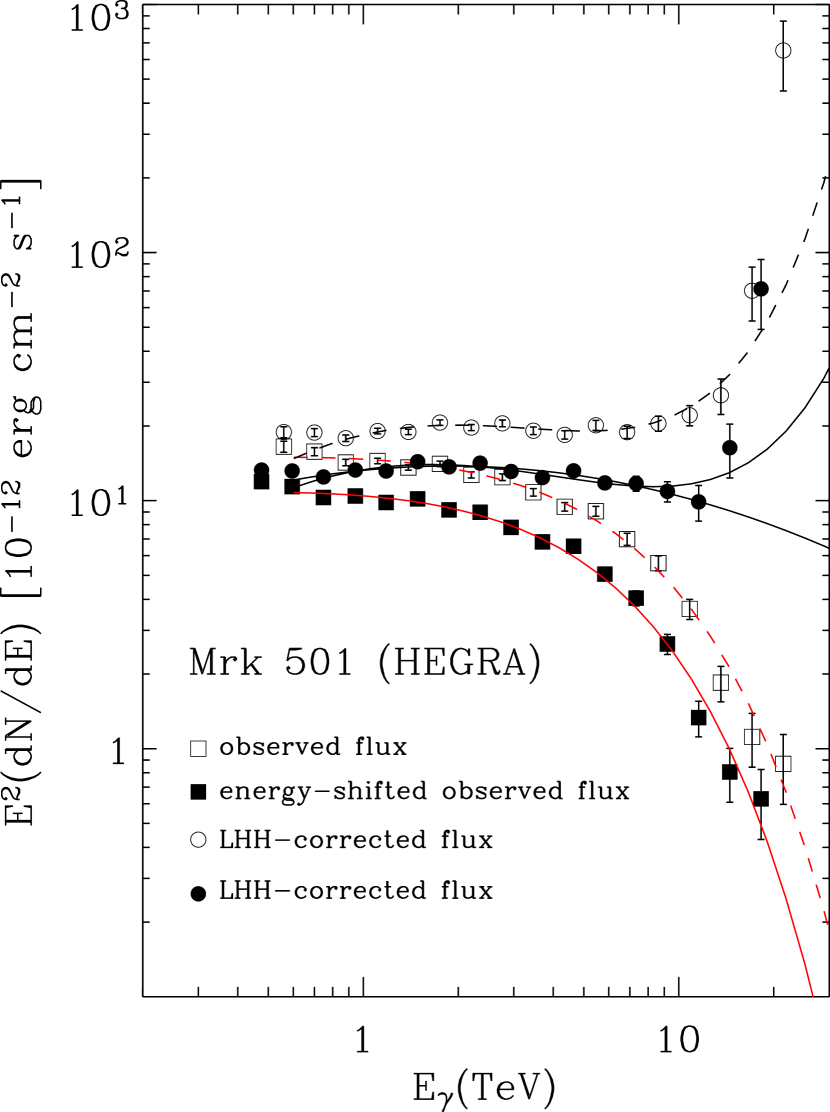
In addition to the systematic uncertainties of the individual spectral data points we also considered the possibility that the reported gamma-ray energies are higher than their actual values, within the claimed experimental uncertainties. Use of the published higher energy values would result in an overestimate of the gamma-ray opacity and could cause an artificial rise in the absorption corrected spectra. We have adopted the conservative assumption that the reported energy spectra of Mrk 501 and Mrk 421 are shifted up in energy by 15%. We therefore recreated the observed HEGRA spectra for these sources by adopting an energy grid that is 0.85 times the reported one, and derived our constraints for the EBL for these spectra using the previously described F-test. The results show that three previously rejected EBL realizations: LHH, MHL, and HHL are now viable, and only the MHH one can be firmly rejected.
Figure 6 depicts the effect of the energy shift on the intrinsic spectrum of Mrk 501. The open squares represent the nominal blazar spectrum, and the solid ones represent the blazar spectrum when the photon energies are shifted down by 15%. The heavy dashed and solid lines represent functional fits (a power-law with an exponential cutoff, eq. 6) through the data. The intrinsic spectra for both cases are calculated using the LHH realization of the EBL and are, depicted by open and solid circles for the nominal and energy-shifted blazar spectrum, respectively. The dashed line is a functional fit through the intrinsic spectra of the blazar using its nominal observed spectrum (see also Fig. 5a). As mentioned before, the exponential rise is statistically significant, and the LHH realization of the EBL was rejected. The two solid lines represent parabolic and exponentially rising fits to the intrinsic blazar spectrum, derived from its energy shifted spectrum. The figure visually shows that the exponentially rising function does not provide a statistically better fit to the intrinsic blazar spectrum than the parabolic one. Hence, the LHH realization of the EBL cannot be rejected in this case. These results clearly demonstrate that the absolute calibration of atmospheric Cherenkov telescopes directly impacts the ability to constrain the EBL with -ray astronomy. It is therefore important that systematic uncertainties be improved in the next generation of telescopes.
Figure 7 depicts the eight viable EBL spectra (HHH, LLH, MLH, HLH, LHL, LLL, MLL, and HLL) that give rise to physically “well behaved” intrinsic -ray spectra. In addition we show as dashed lines, the three EBL realizations (LHH, MHL, and HHL) that are viable when the observed -ray energies are shifted down by 15%. Figure 8 shows the optical depths derived for these EBL realizations. All optical depths are characterized by a flattening in the 1 to 10 TeV optical depth caused by the dip in the EBL at mid–IR wavelengths. This is in contrast to the model of Konopelko et al. (2003) which shows a monotonic increase of -ray opacity with energy for their adopted EBL spectra. The shaded area in the figure depicts the optical depth bounded by the two EBL models adopted in their analysis, and depicted in Figure 2 (upper panel) of this paper. The heavy shaded area represents the range of opacities corresponding to the EBL spectra of Kneiske et al. (2004) shown in Figure 2 (lower panel).
From Figure 8 we see that all EBL realizations imply substantial absorption at energies above 400 GeV for blazars with a redshift of more than except for the LLL case (lowest curve in the figure) for which the spectral shape is only marginally modified by the attenuation. The energy dependence of the opacity is crucial in determining the shape of the intrinsic blazar spectrum and the position of its energy peak. This is especially important for modeling the spectral variability of Mrk 421, for which observations suggest that its peak energy is shifting to higher TeV energies with increasing flaring intensity, and for determining the intrinsic spectrum of H1426+428, which is located at =0.129.
6 IMPLICATIONS FOR THE EXTRAGALACTIC
BACKGROUND LIGHT INTENSITY
6.1 New Limits on the EBL Spectrum
Using minimal assumptions on the behavior of the intrinsic blazar spectrum we derived new limits on the spectrum of the EBL. Figure 7 shows the eight template spectra that did not give rise to an “unphysical” behavior in the blazar spectrum. Table 4 summarizes key characteristics of the eight viable EBL realizations: the total EBL intensity over the 0.1 to 103 m wavelength range, and the intensities attributed to starlight (0.1-5 m) and reradiated thermal emission from dust (5-10m). The last column gives the fractional contribution of the dust emission to the total EBL intensity.
Finkbeiner, Davis, & Schlegel (2000) detected an isotropic emission component at 60 and 100 m after the subtraction of the expected zodiacal and Galactic emission components from the COBE/DIRBE maps. The intensity of the residual emission was found to be 28.17 and 24.68 nW m-2 sr-1 at these respective wavelengths. Our analysis puts a strong upper limit of 15 nW m-2 sr-1 on the EBL intensity at 60 m, otherwise the EBL will give rise to an unphysical blazar spectrum. This upper limit is still within the 2 uncertainty of their nominally stated detection. However, any isotropic components above this upper limit must be of local origin.
The maximum EBL intensity corresponds to the HHH realization is 140 nW m-2 sr-1, and the minimum EBL intensity, corresponding to LLL, is 48 nW m-2 sr-1. The HLL realization gives a fractional dust contribution to of only 23%, significantly less than the fractional contribution of dust to the local luminosity density, which is about 30% (Soifer & Neugebauer 1991, Dwek et al. 1998). The fractional contribution of the dust emission to the EBL intensity should be larger than its contribution to the local luminosity density, since in the past galaxies emitted a larger fraction of their total luminosity at infrared wavelengths, as suggested from the evolution in the number counts of ultra-luminous IR galaxies with redshift (e.g. Chary & Elbaz 2001). So the HLL realization of the EBL may be rejected on spectral grounds. All other seven EBL realizations give values larger than 0.34, which is marginally larger than the local value.
6.2 Local Fluctuations in the Number Density of Background Photons
The two blazars Mrk 421 and 501 have almost identical redshifts ( = 0.031 and 0.034, respectively), but they may have different opacities if local fluctuations in the number of infrared galaxies are important. The optical depth to -ray photons going through an individual disk galaxy with a mid-IR luminosity , mid-IR photon number density , and disk radius is approximately given by:
where is the - cross section in units of 10-25 cm2, is the mid-IR luminosity of the galaxy in units of 1010 L⊙, is a typical galactic radius (in kpc) containing most of the IR emission from the galaxy, and is the energy of a mid-IR photon with a wavelength of 10 m. Equation (9) shows that for an appropriate combination of and , individual galaxies can be optically thick to TeV -rays. For example, the optical depth will be unity for galaxies with a mid-IR luminosity of 1012 L⊙ and a disk radius of 4 kpc. So a single galaxy along the line of sight to a blazar can have a significant affect on its observed spectrum. However, the probability of encountering such galaxy along the line of sight to either Mrk 421 or Mrk 501 is very small. The local IR luminosity density is about L⊙ Mpc-3 (Dwek et al. 1998). Assuming that all this energy is emitted at mid-IR wavelengths gives an upper limit of Mpc-3 on the number density of these TeV-thick galaxies. The probability for intersecting such galaxies is given by , where 130 Mpc is the distance to = 0.03. The resulting probability for encountering a galaxy opaque to TeV -rays is about 2. It is therefore statistically very unlikely that random fluctuations in the number of galaxies along the line of sight to these two TeV blazars will cause any significant differences in their TeV opacity.
7 THE ABSORPTION–CORRECTED BLAZAR SPECTRA
7.1 The Intrinsic Average Spectrum of Mrk 421 and Mrk 501
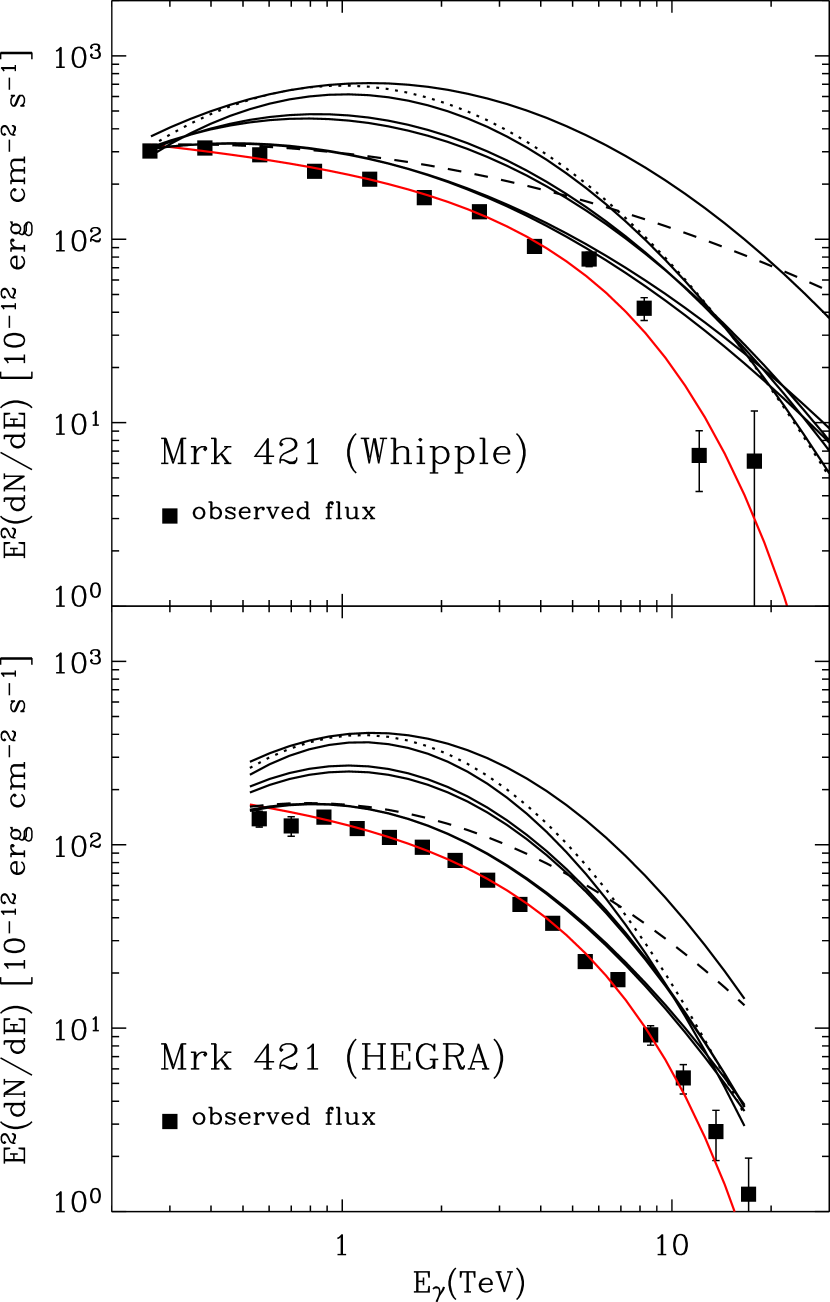
Figure 9 shows the absorption–corrected spectra of Mrk 421 applied to the Whipple and HEGRA -ray data using the eight viable EBL realizations depicted in Figure 7. The dotted and dashed lines represent the intrinsic blazar spectra derived by using, respectively, the HLL and LHL realization of the EBL. The former was rejected on the basis of spectral considerations: the fraction of the total EBL intensity radiated by dust was too small and inconsistent with the fact that the infrared luminosity density increases with redshift. The latter, as can be seen in Figure 5g, gives rise to an unphysical blazar spectrum, although this unphysical behavior was found to be statistically insignificant.
We note, that all absorption–corrected Mrk 421 spectra exhibit a curved shape. Assuming that there is no additional attenuation by radiation fields in the proximity of the blazar jet, these represent the range of possible intrinsic spectra, from which we can derive their peak luminosity, which provides important constraints for models for the origin of the -ray emission. The figures show that the luminosity peak of Mrk 421 occurs within the energy range between 0.5 TeV and 1 TeV.
Mrk 501 is approximately at the same redshift as Mrk 421, hence EBL absorption should affect its spectrum similarly, allowing a direct comparison of the intrinsic spectra of these two blazars. Figure 10 shows absorption–corrected spectra of Mrk 501 for acceptable EBL realizations. The dotted and dashed line represent the intrinsic spectra for the same EBL realizations as in Figure 9. The unphysical nature of the LHL-corrected intrinsic spectrum is clearly shown for the Mrk 501 HEGRA data: the intrinsic spectrum is essentially flat with energy. The results from HEGRA and Whipple data show that the intrinsic averaged energy spectrum of Mrk 501 during its flaring activity in 1997 peaked at energies between 0.8 and 2.5 TeV.
A more rigorous determination of the peak energy and its uncertainty can be made from the parabolic fit to the spectra of these two blazars (equation 7). Since the uncertainties in the derived peak energies are dominated by the wide range of EBL realizations, and no truly contemporaneous X-ray data are available for the complete data set, this simple function is sufficiently accurate to get an estimate of the peak energy of the blazar. The use of more elaborate fitting functions based on detailed blazar models may be justified once data obtained with the next generation of atmospheric Cerenkov telescopes covering a wider range of -ray energies and contemporaneous X-ray observations will become available.
The peak energies, , for Mrk 421 and 501 are presented in Table 5. For Mrk 421 both, the HEGRA and the Whipple data sets independently show that the intrinsic time-averaged spectrum of Mrk 421 during the 2000/2001 season peaked at an energy between 0.5 and 1.2 TeV. For Mrk 501, the HEGRA data give a consistently higher peak energy than the Whipple data, ranging from 0.7 to 1.8 TeV for the Whipple, and from 1.1 to 2.5 TeV for the HEGRA data. Furthermore, the table shows that peak energies of Mrk 501 are systematically higher by about 30 to 60% compared to that of Mrk 421 regardless of the EBL realization used to derive their intrinsic spectra. This point is also illustrated in Figure 11 which depicts the Mrk 501 versus the Mrk 421 peak energies for all acceptable EBL realizations. Table 6 shows the peak energy in the intrinsic spectrum of Mrk 501 obtained by correcting the energy-shifted spectrum for absorption by the different EBL realizations. Comparison to the peak energies in Table 5, shows that the general trend is to shift the peak energies to lower values. Uncertainties in the determination of the absolute photon energy therefore affects the intrinsic spectrum and the determination of peak energies.
The small difference of 60% in the peak energies of these two blazars while they were in a high flaring state is quite surprising considering the fact that their historical synchrotron spectra in X-rays have peaked at largely different energies: at 100 keV for Mrk 501 (Pian et al. 1998; Catanese et al. 1997), and at 0.5–8 keV for Mrk 421 (Brinkmann et al. 2000; Krawzcynski et al. 2001; Tanihata et al. 2004). The measurements of the synchrotron peak energy of Mrk 501 were carried out during the same months as the -ray data used in this paper were recorded (see also Catanese et al. 1997; Samuelson et al. 1998). However, the published peak synchrotron energy of Mrk 421 was not measured contemporaneously with the -ray data. Spectral measurements at X-ray energies of Mrk 421 during its 2000/2001 flare do exist, but have not yet been made publicly available. Preliminary results from this flaring state suggest that the location of the spectral peak is consistent with those determined in previous years (Krawzcynski private communication), suggesting that the synchrotron peaks of the two blazars during their high flaring state are indeed largely different.
7.2 The Intrinsic Spectral Variability of Mrk 421
The measurement of spectral variability of Mrk 421 (Krennrich et al. 2002) allows further studies of its time-averaged spectra over a range of flux levels between 1 and 10 Crab. The observed spectra of Mrk 421 show an increased flattening of the spectra with increasing excitation level, suggesting a systematic shift of the peak energy to higher energies as a function of excitation level. To determine the peak energy of their intrinsic spectrum we corrected the observed spectra for the different epochs for absorption by all the eight viable EBL realizations derived in §5.
Figure 12 (top left panel) shows the average energy spectra of Mrk 421 of various flaring states with the data binned by flux level based on measurements with the Whipple observatory 10 m -ray telescope. The remaining panels show the absorption–corrected flare spectra using the acceptable EBL realizations. It can be clearly seen that the EBL corrected spectra imply higher peak energies for the high emission states than the un-corrected data. In fact the peak energy for the highest flux level ranges from 730 GeV (LLL) to approximately 2 TeV (HHL).
Figure 13 depicts the evolution of the peak energy with flaring state. All energies are normalized to the peak energy of the lowest state, except for the LHL case for which the peak energies in the first and third flaring state could not be determined. The figure shows that for all EBL realizations the peak energy shifts towards higher energies with increasing flaring state. Table 7 lists the peak energies for the different flaring states and EBL realizations. The intrinsic spectrum of Mrk 421 in the lowest flaring state has a peak energy that falls significantly below the energy range covered by the data and therefore cannot be accurately determined, as evident by the large error bars. However, in spite of the uncertainty in the peak energy, the figure does show that for several EBL realizations, the drop in the peak energy of this flaring state is significant. Also noticeable in the figure is the relative flattening in the value of the peak energy between the second and fourth flaring state. A similar behavior has been observed for Mrk 421 at X-ray energies (George et al. 1988; Fossati et al. 2000; Brinkmann et al. 2000) showing low and soft X-ray states and hard and bright high emission states.
7.3 The Intrinsic Spectrum of H1426+428
A search for other extreme TeV blazars similar to Mrk 501 with synchrotron peak energies in the hard X-ray band was carried out by Costamante et al. (2001) using the BeppoSAX satellite. They identified the BL Lac object H1426+428 as a strong hard X-ray source. Spectral measurements of H1426+428 in February 1999 using the LECS, MECS and PDS instruments on BeppoSAX revealed a peak energy above 100 keV, similar to Mrk 501 during a long lasting outburst in 1997 (Catanese et al. 1997; Pian et al. 1998). This was followed by the first weak detection of a -ray signal above 300 GeV by Horan et al. (2000, 2002). Consequently, H1426+428 has become an interesting comparison object to the TeV blazars Mrk 421 and Mrk 501. The third extreme blazar with a high synchrotron peak energy (Giommi, Padovani, & Perlman 2000) and shown to emit TeV -ray radiation (Catanese et al. 1998) is 1ES2344+514, but a spectral analysis in -rays is not available yet.
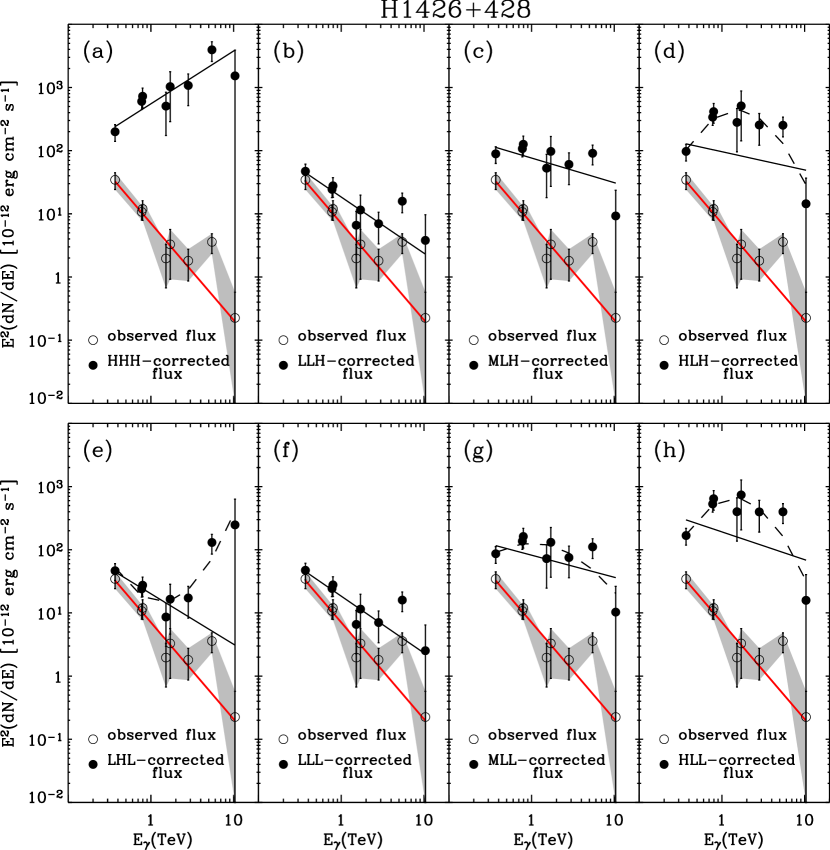
H1426+428 has a redshift of z=0.129, therefore its -ray spectrum above 400 GeV is more strongly attenuated by the EBL than in the case of Mrk 421 and Mrk 501. Our results show that for various EBL realizations, the Mrk 421 and Mrk 501 spectra above 400 GeV are already substantially attenuated (see Fig. 8). A source four times more distant should be heavily absorbed above 400 GeV. As a consequence, a direct comparison of the intrinsic spectrum of H1426+428 with Mrk 421 and Mrk 501 is more complicated since it depends on the evolution of the EBL in the =0–0.13 redshift interval.
Having limited the number of EBL realizations using the Mrk 421 and Mrk 501 data, we applied the remaining viable EBL realizations to H1426+428 using the spectral data from Petry et al. (2002) and Aharonian et al. (2003). In our calculations we assumed that the EBL is constant in the 0 to 0.13 redshift interval, so that the -ray opacities given in Figure 8 were simply rescaled to the distance of H1426+428. The absorption-corrected spectra are shown in Figure 14, and the curves in the plots represent analytical approximations to the observed and intrinsic source spectra. Observed as well as intrinsic spectra were fitted by a power law (eq. 6 with ), and are shown as solid lines. However, intrinsic spectra corrected for the HLH, LHL, MLL, and HLL realizations of the EBL were better fitted by a parabolic function (eq. 7), and are depicted by a dashed line in the figure. The figure shows that there is a large spread in peak energies for the different EBL realizations. The LLL and LLH realizations yield peak energies below 400 GeV, the MLL, HLL, MLH and HLH cases provide peak energies of 1-5 TeV whereas the HHH realization suggests a luminosity peak above 10 TeV.
This range of possible peak energies is significantly different than the one derived for the -ray spectrum of H1426+428 in previous studies. For example, Aharonian et al. (2003) use various theoretical models for the EBL as well as an extreme phenomenological spectrum to derive an either flat [in (d/d)] or a strongly rising intrinsic energy spectrum of H1426+428. Using the Primack et al. (2001) EBL models and an EBL spectrum designed to match the UV-optical upper limits Costamante et al. (2003) derive an intrinsic spectrum that peaks at energies above 8-10 TeV. Our work, using the most current observational limits and detections of the EBL, suggests alternative possibilities including a strongly rising, an extremely flat, or a parabolic-shaped intrinsic energy spectrum in the 1-5 TeV regime. Six out of the eight EBL realizations give rise to a soft intrinsic spectrum or a luminosity peak around 1-5 TeV. Only the extreme HHH and LHL cases suggests a luminosity peak above 10 TeV.
In fact, three of the EBL scenarios (HLH, MLL, and HLL) yield an intrinsic energy spectrum for H1426+428 that exhibits a peak energy of 1-5 TeV similar to the intrinsic -ray spectra of Mrk 421 and Mrk 501. This concurs well with the fact that Mrk 501 also has a synchrotron peak energy similar to H1426+428.
Only the HHH and LHL realizations lead to a strongly rising intrinsic spectrum with energy. These same realizations also yielded an unphysical rise in the intrinsic spectrum of Mrk 501 (see Fig. 5), but these rises were not considered to be statistically significant by the F-test. Consequently, the question as to whether or not the TeV -ray spectrum of H1426+428 exhibits a dramatic rise with peak energies above 10 TeV remains unsolved. A rising spectrum with a peak energy above 10 TeV cannot be excluded, but is certainly not favored over the six other EBL realizations leading to peak energies in the few TeV regime or below.
It is clear from the range of absorption-corrected spectra of H1426+428, that more detailed spectral measurements in the -ray regime would be necessary to resolve the peak energy of H1426+428 and further narrow the viable range of EBL realizations. The large systematic error in the absorption-corrected spectrum results from the fact that H1426+428 is heavily absorbed above 400 GeV and uncertainties in the EBL realizations enter exponentially in the derivation of its absorption-corrected spectrum. The uncertainty in the EBL spectrum is the dominant factor in reconstructing the peak energy of the H1426+428 intrinsic spectrum. This is clearly different from the case of Mrk 421 and Mrk 501 for which we were still able to provide an estimate of the intrinsic peak energies, despite the large uncertainties in the EBL. Blazars like H1426+428 with redshifts of 0.1 will be extremely useful for constraining the EBL once measurements by GLAST, HESS, MAGIC and VERITAS will be available with sensitivity starting in the sub-100 GeV regime, where the transition from unabsorbed to the absorbed part of the -ray spectrum is expected to occur. In this region it should again be possible to limit the EBL cases by testing for unphysical rises in the -ray spectrum.
8 DISCUSSION AND SUMMARY
In this paper we presented the observed TeV -ray fluxes from the three blazars Mrk 421, Mrk 501, and H1426+428, and the evolving spectrum of Mrk 421 during a period of intense variability. The observed blazar fluxes are presented in Figure 1. The intrinsic spectrum from these sources is attenuated on route to earth by low energy UV to submillimeter wavelength photons that constitute the extragalactic background light (EBL). The main objective of this paper was to explore the range of possible intrinsic source spectra of these nearest blazars, and derive new limits on the spectrum of the EBL, using the most recent constraints on the EBL spectrum, and minimal assumptions regarding what constitutes an unphysical behavior in the blazar spectrum.
Using observed limits and detection of the EBL we constructed a family of twelve realizations of the EBL spectrum, and derived the intrinsic spectra of the three blazars. The different spectral templates of the EBL are presented in Figure 2. The intrinsic spectra of Mrk 421 and 501 derived for all the EBL realizations are depicted in Figures 4 and 5, respectively. Some EBL realizations led to an unphysical behavior in the intrinsic blazar spectrum, characterized by an exponential rise after a decline or flat behavior with energy. In §5 we apply the F-test to examine the statistical significance of the exponential rise in an intrinsic blazar spectrum. Table 3 summarizes the results of the F-test, flagging out EBL realizations that are considered unphysical.
Discarding EBL realizations that lead to unphysical -ray spectra, leaves eight viable EBL spectra, shown in Figure 7. Most EBL spectra with high mid–IR intensity led to unphysical blazar spectra. Table 4 summarizes some characteristics of these EBL realizations. The range of EBL intensities is between 50 and 140 nW m-2 sr-1. The fractional contribution of dust emission to the total EBL intensity ranges from 0.23 to 0.66. The contribution of the dust emission to the total luminosity density in the local universe is about 0.30. Since in the past galaxies reradiated a larger fraction of their stellar energy output at infrared wavelengths, the spectrum leading to a fractional dust contribution of 0.23 to the total EBL intensity can be ruled out as a viable realization of the EBL.
Figure 8 depicts the -ray opacity of the universe to = 0.03 for = 70 km s-1 Mpc-1. The opacity exhibits a flattening at energies between 1 and 10 TeV, resulting from the dip in the EBL intensity at mid–IR wavelengths. The -ray opacities we derive show markedly different behavior with energy compared to the opacities derived by Konopelko et al. (2003), which are monotonically increasing with energy, reflecting the EBL spectra used in their calculations.
Figures 9 and 10 depict the intrinsic spectra of Mrk 421 and 501 for each of the eight remaining EBL realizations. Whereas the observed spectra exhibited a monotonic decrease with ray energy, all absorption corrected spectra exhibit a parabolic behavior with energy. This allowed us to identify a peak energy, , in the spectra of these blazars. For all EBL realizations we found that the peak energy of Mrk 421 was between 0.5 and 1.2 TeV, whereas that of Mrk 501 was between 0.8 and 2.5 TeV, depending on the EBL realization. The value of of Mrk 501 was consistently higher than that of Mrk 421 (Figure 11), but differed by less than 60%. X–ray observations of these blazars showed that their synchrotron peaks are vastly different, typically 0.4 to 8 keV for Mrk 421, and well above 100 keV for Mrk 501. In light of their vastly different peak energies in the synchrotron region of their spectrum, the overall similarity in the value of their peak energies in the Inverse Compton (TeV) region is extremely interesting.
The observed spectrum of Mrk 421 during a period of intense spectral variability is monotonically decreasing with energy at all periods. The absorption corrected spectrum shows a dramatically different behavior, characterized by the appearance of a peak in the spectrum that monotonically shifts to higher energies as the spectrum evolves to higher flux states (Figure 12). The data suggests a shift in peak energy between the low and high flaring state, regardless of the EBL spectrum used to correct for the -ray attenuation. Figure 13 depict the evolution of with flux level for representative EBL realizations.
The blazar H1426+428 is the farthest of the blazars detected so far, and its intrinsic spectrum is therefore most attenuated. The combined effects of the strong absorption and the uncertainties in its observed spectrum yield an absorption-corrected spectrum with a wider range of spectral shape than those suggested in previous investigations. Three of the eight EBL realizations give rise to an absorption-corrected spectrum that are very similar to the two other blazars, and are characterized by the appearance of a peak in the 1 to 5 TeV energy region (Figure 14). However, two EBL realizations imply a luminosity peak below 400 GeV, and two cases suggests a peak energy above 10 TeV. More precise knowledge of the spectrum of this blazar, especially extending the observations into the 100 GeV energy regime will provide important constraints on the evolution of the EBL with redshift.
We also considered the uncertainties in the absolute calibration of the energy of TeV -rays with atmospheric Cherenkov telescopes, and found that they have an important impact on the ability to constrain the EBL by the blazar spectrum. The importance of this effect is illustrated in Figure 6, and described in §5. Therefore, it will be extremely important for the next generation of telescopes to improve these systematic uncertainties.
The next generation imaging telescopes HESS (Hofmann et al. 2003) MAGIC (Lorenz et al. 2003) and VERITAS (Weekes et al.2002) will cover the sub-100 GeV to 10’s TeV energy regime, covering the transition region between unabsorbed to the strongly absorbed region of the spectrum. At energies below 200 GeV EBL absorption is essentially negligible for a redshift of z=0.03, enabling direct measurements of the intrinsic spectra of Mrk 421 and Mrk 501 at these energies. In addition for the strongest blazars GLAST will help to bridge the 100 GeV regime with measurements at GeV energies providing an important extension into region where EBL absorption is negligible. These measurements will provide additional constraints on EBL scenarios, since these spectra will have to fit smoothly with the higher energy intrinsic spectra of these sources that will be heavily affected by absorption.
Acknowledgement: We thank Tanja Kneiske for communicating EBL models in digital form, and Martin Schroeder for checking the polynomial coefficients in Table 2. WE also thank the referee, Felix Aharonian, for his useful comments and for pointing out an error in equation (9) in the original version of the manuscript. ED acknowledges NASA’s Long Term Space Astrophysics (LTSA-2003) Program for support of this work. FK acknowledges support by the US Department of Energy.
References
- (1) Aharonian, F.A. et al. 1997, A&A, 327, L5
- (2) Aharonian, F.A. et al. 1999, A&A, 349, 11
- (3) Aharonian, F.A. 2000, New Astron., 5, 377
- (4) Aharonian, F.A. et al. 2000, ApJ, 539, 317
- (5) Aharonian, F.A. et al. 2002a, A&A, 384, L23
- (6) Aharonian, F.A, Timokhin, A. N., & Plyasheshnikov, AS. V. 2002b, A&A, 384, 834
- (7) Aharonian, F.A. et al. 2003, A&A, 403, 523
- (8) Arendt, R. G., Odegard, N., Weiland, J. L., Sodroski, T. J. et al. 1998, ApJ, 508, 74
- (9) Arendt, R. G., & Dwek, E. 2003, ApJ, 585, 305
- (10) Bernstein, R. A., Freedman, W. L., & Madore, B. F. 2002, ApJ, 571, 56
- (11) Biller, S. D., Akerlof, C. W., Buckley, J., Cawley, M. F., Chantell, M., et al. 1995, ApJ, 445, 227
- (12) Brinkmann W. et al. 2000, astro-ph0011193
- (13) Cambrésy, L., Reach, W. T., Beichman, C. A., & Jarrett, T. H. 2001, ApJ, 555, 563
- (14) Catanese, M. et al. 1997, ApJ, 487, L143
- (15) Catanese, M. et al. 1998, ApJ, 501, 616
- (16) Coppi, P. & Aharonian, F.A. 1999, ApJ, 521, L33
- (17) Coppi, P. 2003, Proc. of ”The Universe Viewed in Gamma Rays”, University of Tokyo Symp., eds. R. Enomoto, M. Mori, S. Ynagita (Universal Academy Press, Inc.: Tokyo), p. 77
- (18) Costamante, L. et al. 2001, A&A, 371, 512
- (19) Costamante, L., Aharonian, F., Ghisellini, G., & Horns, D. 2003, New Astron. Rev. 47, 677 (astroph/0301211)
- (20) Costamante, L., Aharonian, F., Horns, D., & Ghisellini, G., 2004, New Astron. Rev. 48, 469 (astroph/0308025)
- (21) Cambrésy, L. et al. 2001, ApJ, 555, 563
- (22) Chary, R., & Elbaz, D. 2001, ApJ, 556, 562
- (23) Daum, A. et al. 1997, Astropart. Phys., 8, 1
- (24) de Jager, O. C., & Stecker, F. W. 2002, ApJ, 566, 738
- (25) Djannati-Ataï, A., et al. 1999, A&A, 350, 17
- (26) Djannati-Ataï, A., Khelifi, B., Vorobiov, S. et al. 2002, A&A, 391, L25
- (27) Dwek, E., & Slavin, J. 1994, ApJ, 436, 696
- (28) Dwek, E., & Arendt, R. G. 1998, ApJ, 508, L9
- (29) Dwek, E., Arendt, R. G., Hauser, M. G., Fixsen, D., Kelsall, T., et al. 1998, ApJ, 508, 106
- (30) Dwek, E., & de Jager, O. C. 2001, in ”The Extragalactic Infrared Background and its Cosmological Implications”, IAU Symp. 204, eds. M. Harwit & M. G. Hauser (San Francisco: ASP), p. 389
- (31) Elbaz, D., Cezarsky, C. J., Chanial. P., Aussel, H., Franceschini, A., Fadda, D., & Chary, R. R. 2002, A&A, 384, 848
- (32) Finkbeiner, D. P., Davis, M., & Schlegel, D. J. 2000, ApJ, 544, 81
- (33) Finley, J.P. et al. 2001, Proceedings of the 27th International Cosmic Ray Conference, ed. M. Simon, E. Lorenz, & M. Pohl, (Hamburg, Germany: IUPAP), 2605
- (34) Fixsen, D. J., Dwek, E., Mather, J. C., Bennett, C. L., & Shafer, R. A. 1998, ApJ, 508, 123
- (35) Fossati, G., et. al. 2000, ApJ, 541, 166
- (36) Gaidos, J.A. et al. 1996, Nature, 383, 319
- (37) Gardner, J. P., Brown, T. M., & Ferguson, H. C. 2000, ApJ, 542, L79
- (38) George, I. M., Warwick, R. S., & Bromage, G. E., 1988, MNRAS, 232, 793
- (39) Giommi, P., Padovani, P., Perlman, E 2000, MNRAS, 317, 743
- (40) Gorjian, V., & Wright, E. L., & Chary, R. R. 2000, ApJ, 536, 550
- (41) Gould, R. J., & Schréder, G. 1967, Phys. Rev., 155, 1408
- (42) Guy, J., Renault, C., Aharonian, F. A., Rivoal, M., & Tavernert, J-P. 2000, A&A 359, 419
- (43) Hauser, M.G. et al. 1998, ApJ, 508, 25
- (44) Hauser, M.G. & Dwek, E. 2001, ARA&A, 39, 249
- (45) Hillas, A. M., et al. 1998, ApJ, 503, 744
- (46) Hofmann, W., et al., 2003, Proc. of ”The Universe Viewed in Gamma Rays”, University of Tokyo Symposium, eds. R. Enomoto, M. Mori, S. Yanagita (Universal Academy Press, Inc.: Tokyo), p. 357
- (47) Horan, D., et al. 2000, Head meeting, No. 23, 05.03 (Ho00)
- (48) Horan, D., et al. 2001a, AIP Conf. Proc. 578, Gamma Ray Astrophysics 2001, ed. S. Ritz, N. Gehrels & C.R. Shrader, (Baltimore, Maryland: AIP), 324
- (49) Horan, D., et al. 2001b, Proceedings of the 27th International Cosmic Ray Conference, ed. M. Simon, E. Lorenz, & M. Pohl, (Hamburg, Germany: IUPAP), 7, 2622
- (50) Horan, D., et al. 2002, ApJ, 571, 753
- (51) Jauch, J. M., & Rohrlich, F. 1955, ”The Theory of Photons and Electrons”, (Cambridge, MA: Addison-Wesley)
- (52) Kelsall, T., Weiland, J., L., Franz, B. A., Reach, W. T. et al. 1998, ApJ, 508, 44
- (53) Kneiske, Mannheim, K., & Hartmann, D. H. 2002, A&A, 386, 1
- (54) Kneiske, T. M., Bretz, T., Mannheim, K., & Hartmann, D. H. 2004, A&A, 413, 807
- (55) Konopelko, A. et al. 2003, ApJ, 597, 851
- (56) Krawzcynski, H., et al. 2001, ApJ, 559, 187
- (57) Krennrich, F. et al., 1999, ApJ, 511, 149
- (58) Krennrich, F. et al., 2001, ApJ, 560, L45
- (59) Krennrich, F. et al., 2002, ApJ, 575, L9
- (60) Lagache, G., Haffner, L. M., Reynolds, R. J., & Tufte, S. L. 2000, A&A, 354, 247
- (61) Lorenz, E., et al. 2003, Proc. of ”The Universe Viewed in Gamma Rays”, University of Tokyo Symposium, eds. R. Enomoto, M. Mori, S. Yanagita (Kashiwa, Japan), p. 351
- (62) Madau, P., & Pozzetti, L. 2000, MNRAS, 312, L9
- (63) Malkan, M. A., & Stecker, F. W. 2001, ApJ, 555, 641
- (64) Mannheim, K., & Biermann, P.L. 1992, A&A, 253, L21
- (65) Mannheim, K. 1993, A&A, 269, 67
- (66) Mannheim, K. 1998, Science, 279, 684
- (67) Mattila, K. 2003, ApJ, 591, 119
- (68) Matsumoto, T. et al. 2000, in ISO Surveys of the Dusty Universe eds., Lemke, Stickel & Wilke (Pringer: Berlin), p96
- (69) Maraschi, L., Ghisellini, G., & Celotti, A. 1992, ApJ, 397, L5
- (70) Marscher, A.P., & Travis, J.P. 1996, A&AS, 120, 537
- (71) Metcalfe, L., Kneib, J.-P, McBreen, B., Altieri, B., Biviano, A. et al. 2003, A&A, 407, 791
- (72) Milliard, B., Donas, J., Laget, M., Armand, C., & Vuillemin, A. 1992, A&A, 257, 24
- (73) Mücke, A. & Protheroe, R.J. 2001, Astropart. Phys., 15, 121
- (74) Papovich, C., Dole, H., Egami, E., LeFloc’h, E., Pérez-González, P. G. et al. 2004, ApJS, 154, 70
- (75) Partridge, R.B. & Peebles, P.J.E., 1967, ApJ, 148, 377
- (76) Peacock, J. A. 1999, Cosmological Physics (Cambridge: Cambridge University Press)
- (77) Petry, D. et al. 2002, ApJ, 580, 104
- (78) Pian, E. et al. 1998, ApJ, 492, L17
- (79) Primack, J.R., Somerville, R. S., Bullock, J. S., Devriendt, J. E. G. 2001, AIP Conf. Proc. 558, eds. F. Aharonian & H. Völk (New York: AIP Press), p. 463
- (80) Protheroe, R.J., Bhat, C.L., Fleury, P., Lorenz, E., Teshima, M., & Weekes, T.C. 1998, Proc. 25th Int. Cosmic-Ray Conf. (Durban), 8, 317
- (81) Protheroe, R.J. & Meyer. H. 2000, Phys. Lett., B493, 1-6
- (82) Puget et al., J.L. 1996, A&A, 308, L5
- (83) Punch, M., et al. 1992, Nature, 358, 477
- (84) Quinn, J., et al. 1996, ApJ, 456, L83
- (85) Renault, C., Barrau, A., Lagache, G., & Puget J-L., 2001, A&A, 371, 771
- (86) Samuelson, F.W. et al. 1998, ApJ, 501, L17
- (87) Soifer, B. T., & Neugebauer, G. 1991, AJ, 101, 354
- (88) Stanev, T., & Franceschini, A. 1998, ApJ, 494, L159
- (89) Stecker, F.W., de Jager, O.C., & Salamon, M.H. 1992, ApJ, 390, L49
- (90) Tanihata, C. et al. 2004, ApJ, 601, 759
- (91) Vassiliev, V. V. 2000, Astropart. Phys. 12, 217
- (92) Weekes, T. C., et al. 2002, Astropart. Phys., 17, 221
- (93) Wright, E. L., & Reese, E. D. 2000, ApJ, 545, 43
- (94) Wright, E. L. 2001, ApJ, 553, 538
- (95) Wright, E. L. 2004, New Astr. Rev., 48, 465
- (96) Zweerink, J. et al. 1997, ApJ, 490, L170
- (97)
- (98)
- (99)
| Wavelength | (nW m-2 sr-1) | Reference |
|---|---|---|
| 0.1595 | Gardner et al. (2000) | |
| Gardner et al. (2000) | ||
| 0.2365 | Gardner et al. (2000) | |
| 0.3 | 127 | Bernstein et al. (2000) |
| 0.36 | Madau & Pozzetti (2000) | |
| 0.45 | Madau & Pozzetti (2000) | |
| 0.555 | 177 | Bernstein et al. (2002) |
| 0.67 | Madau & Pozzetti (2000) | |
| 0.81 | Madau & Pozzetti (2000) | |
| 0.814 | 177 | Bernstein et al. (200*) |
| 1.1 | Madau & Pozzetti (2000) | |
| 1.25 | 2916b | Wright (2001) |
| 5417c | Cambrésy et al. (2001) | |
| 1.6 | Madau & Pozzetti (2000) | |
| 2.2 | Madau & Pozzetti (2000) | |
| 206b | Wright (2001) | |
| 287c | Cambrésy et al. (2001 | |
| 3.5 | 123b | Wright & Reese (2000) |
| 164c | Dwek & Arendt (1998) | |
| 15 | 2.40.5 | Elbaz et al. (2002) |
| 2.70.62 | Metcalfe et al. (2003) | |
| 24 | Papovich et al. (2004) | |
| 100 | 236 | Lagache et al. (2000) |
| 140 | 257d | Hauser et al. (1998) |
| 156e | Hauser et al. (1998) | |
| 240 | 143d | Hauser et al. (1998) |
| 132e | Hauser et al. (1998) | |
| 240 - 1000 | Fixsen et al. (1998) |
| Templateb | polynomial coefficients: | m)-range |
|---|---|---|
| LHH | {0.954270, 0.209657, -2.03417, 2.72242, 3.48905, -9.74560, | |
| 3.14729, 6.70213, -7.21663, 3.01716, -0.593362, 0.0455855 } | ||
| {0.936188, 0.501445, -1.43078, -0.921636, 1.81965, 0.194080, | ||
| -0.841639, 0.313789, -0.0354290} | ||
| 15 100 | ||
| MHH | {1.46525, 0.366351, -2.56385, -0.0579773, 2.17911, -0.533745, | all |
| -0.466031, 0.226609, -0.0276028} | ||
| HHH | {1.78163, -0.152917, -4.14983, 4.92401, 3.60609, -11.2143, | all |
| 4.74911, 5.42408, -6.51327, 2.78469, -0.552349, 0.0426156 } | ||
| LLH | {0.969853, 0.603730, -2.11970, -2.20808, 2.97575, 1.07215, | all |
| -1.92944, 0.670891, -0.0742040} | ||
| MLH | {1.47235, 0.175293, -2.55029, 0.545660, 1.67612, -0.954748, 0.139905} | 4 |
| {1.37639, 0.122876, -0.136912, -0.650521, -5.81963, 5.43507, | ||
| 3.92208, -6.80703, 3.32087, -0.711689, 0.0578321} | ||
| HLH | {1.58842, 1.31577, -3.67467, -3.24647, 5.03638, 1.01891, | 12 |
| -3.03305, 1.34105, -0.235389, 0.0143138 } | ||
| {1.89452, -1.81311, 0.965311, 5.89934, -15.5846, 5.20984 | ||
| 13.0127, -14.4141, 6.18153, -1.23942, 0.0966528} | ||
| LHL | {0.925695, 0.381153, -1.25192, -0.160524, 1.11769 -0.429982, | all |
| 0.00277214, 0.0114175 } | ||
| MHL | {1.43906, 0.257308, -2.22901, 0.432537, 1.41286, -0.787225, 0.113213 } | all |
| HHL | {1.73013, 0.226485, -3.33062, 1.07604, 2.24510, -1.71409, | 2.2 |
| 0.425683, -0.0355017} | ||
| {1.60828, 0.462253, -2.66388, 0.294411, 1.77810, -0.938433, 0.132448} | ||
| LLL | {0.980669, 0.585033, -2.41182, -1.90431, 4.02921, -0.175735, | all |
| -2.44258, 1.93244, -0.740240, 0.148669, -0.0123448} | ||
| MLL | {1.49096, 0.667023, -2.85743, -1.44668, 2.75698, 0.393004, | all |
| -1.22980, 0.431022, -0.0463593} | ||
| HLL | {1.71098, 0.180354, -2.61936, 0.928249, -0.298039, -0.637540, | all |
| 2.12254 -1.56680 0.450176 -0.0457011} | ||
| average | {1.20000, 0.533686, -1.81116, -1.28135, 1.94804, 0.655142, | all |
| -1.19371, 0.405981, -0.0437552} |
where ranges from 0.1 to 10m, unless otherwise noted, and is the degree of the polynomial.
| EBL | Mrk 421 (HEGRA) | Mrk 501 (HEGRA) | |||||
|---|---|---|---|---|---|---|---|
| Template | EBL | ||||||
| LHH | 1.877 | 1.366 | 0.88 | 3.18 | 1.84 | 0.97 | 0b |
| MHH | 2.794 | 1.528 | 0.97 | 5.377 | 1.889 | 0.99 | 0 |
| HHH | 1.425 | 1.249 | 0.68 | 2.136 | 1.755 | 0.79 | 1 |
| LLH | 1.249 | 1.244 | 0.14 | 1.847 | 1.797 | 0.35 | 1 |
| MLH | 1.333 | 1.339 | 0.0 | 1.895 | 1.819 | 0.43 | 1 |
| HLH | 1.616 | 1.096 | 0.91 | 2.240 | 1.726 | 0.85 | 1 |
| LHL | 1.455 | 1.216 | 0.75 | 1.912 | 1.404 | 0.88 | 1 |
| MHL | 1.616 | 1.236 | 0.84 | 2.194 | 1.389 | 0.95 | 0b |
| HHL | 1.760 | 1.196 | 0.91 | 2.34 | 1.34 | 0.97 | 0b |
| LLL | 1.036 | 1.111 | 0.0 | 1.326 | 1.446 | 0.0 | 1 |
| MLL | 1.226 | 1.106 | 0.62 | 1.450 | 1.418 | 0.32 | 1 |
| HLL | 1.118 | 1.101 | 0.27 | 1.301 | 1.383 | 0.0 | 1c |
| EBL | / | |||
|---|---|---|---|---|
| realization | (0.1 – 10m) | (0.1 – 5 m) | (5 – 10m) | |
| HHH | 139.8 | 91.5 | 48.2 | 0.35 |
| LLH | 58.9 | 20.0 | 38.9 | 0.66 |
| MLH | 93.6 | 54.0 | 39.6 | 0.42 |
| HLH | 108.5 | 70.1 | 38.4 | 0.35 |
| LHL | 58.4 | 21.1 | 37.3 | 0.64 |
| LLL | 48.1 | 20.1 | 28.0 | 0.58 |
| MLL | 84.5 | 56.0 | 28.5 | 0.34 |
| HLL | 112.8 | 87.3 | 25.5 | 0.23 |
| EBL | Mrk 421 | Mrk 501 | |||||
|---|---|---|---|---|---|---|---|
| Mrk 501 | |||||||
| template | Whipple | HEGRA | Whipple | HEGRA | |||
| HHH | |||||||
| LLH | |||||||
| MLH | |||||||
| HLH | |||||||
| LHL | 33187 | 790107 | 1030 249 | ||||
| LLL | |||||||
| MLL | |||||||
| HLL | |||||||
| EBL Template | Mrk 421 | Mrk 501 | ||
|---|---|---|---|---|
| LHH | 697 81 | 1615 340 | ||
| HHH | 113070 | 2109 103 | ||
| LLH | 729 65 | 105598 | ||
| MLH | 96060 | 1431 74 | ||
| HLH | 108152 | 155960 | ||
| LHL | 71285 | 1969360 | ||
| MHL | 98177 | 2131152 | ||
| HHL | 115668 | 208296 | ||
| LLL | 73663 | 108888 | ||
| MLL | 96959 | 144870 | ||
| HLL | 107555 | 154457 |
| EBL | Flaring | State | ||||
|---|---|---|---|---|---|---|
| Realization | 1 | 2 | 3 | 4 | 5 | 6 |
| HHH | 85318 | 1055303 | 1105205 | 1340197 | 1490131 | 2078290 |
| LLH | 3190 | 448245 | 139123 | 581165 | 613111 | 725258 |
| MLH | 488 | 744250 | 608148 | 925159 | 995104 | 1230213 |
| HLH | 332312 | 986238 | 978133 | 1158145 | 123192 | 1457173 |
| LHL | 362321 | 539263 | 583208 | 13451952 | ||
| LLL | 175 172 | 446 244 | 143 123 | 582 164 | 615 110 | 730 254 |
| MLL | 47 197 | 806 248 | 706 145 | 982 156 | 1054 101 | 1288 203 |
| HLL | 284 320 | 960 237 | 942 133 | 1133 145 | 1205 92 | 1430 174 |