Distribution of mass in galaxy cluster CL0024 and the particle mass of dark matter.
Abstract
We study in details the distribution of mass in galaxy cluster CL0024+1654 inferred using the method of strong gravitational lensing by Tyson et al. (1998). We show that a linear correlation exists between total, visible and dark matter distributions on log-log scale with consistent coefficients. The shape and parameters of log-log-linear correlation are not affected significantly whether one uses projected or volume mass densities but is consistent with visible/dark ratio. We also show and analyze in depth so called alignment properties of the above-mentioned profiles. We show that log-log-linear correlation and alignments can all be understood in terms of thermodynamic/hydrodynamic equilibrium with gravitational potential growing almost linearly in the region of interest. We then analyze the hypothesis of thermal equilibrium on the base of the existing data about CL0024 cluster. If the presence of log-log-linear correlation and alignments were interpreted thermodynamically, this would indicate the mass of the dark matter particle 2-5 times smaller than that of atomic hydrogen, thus giving range for the mass of dark matter particle between 200MeV and 1000MeV.
I Introduction
In the past decade the field of astronomy and astrophysics has experienced a period of rapid development thanks to the operation of Hubble Space Telescope and a wide spread of new faster computers. This development brought a series of brilliant insights in the puzzles of the structure and history of the universe. At this time the growing number of precision measurements of galactic rotation curves and observations of gravitational lensing in galaxies and galaxy clusters combined with extensive computer simulations shed new light on the problem of hidden, or dark, matter in the universe and its role in the universe evolution. Still, little is known about the microscopic properties and composition of the dark matter. Many possibilities have been put forward by various extensions of the Standard Model but yet existence of any of such particles is to be confirmed experimentally.
Recently it had been pointed out that the distribution of dark and visible matter in spiral galaxies with various luminosities and galaxy clusters exhibit strikingly similar correlations with almost identical parameters [1]. Specifically, it was found that in all of these systems the mass densities of visible and dark matter are linearly correlated on log-log scale. The proportionality coefficient in this correlation appears to be universal and equal to . This conclusion had been drawn from the analysis of dark and visible matter distribution in the galaxy cluster CL0024 [2] and synthetic mass model for spiral galaxy rotation curves of Persic and Salucci [3].
In this paper we are going to further sharpen our focus on the properties of the mass distribution in galaxy cluster CL0024. We will investigate in details presence and properties of log-log-linear correlations, alignment properties and their thermodynamic significance and interpretation.
We begin in the next section (Section II) with discussion of the properties of the projected mass density profiles derived by Tyson et al. in 1998 and focus on the log-log-linear correlation between them. We then continue with analysis of the volume density profiles inferred from via inverse Abel transformation and show that the log-log-linear correlation is present also between the volume density profiles. We comment on the significance of these correlations and their thermodynamic interpretation. Finally, we review the alignment properties of the mass profiles in the galaxy cluster CL0024, mentioned earlier in the literature, and show that they imply exponential behavior for the radial mass density in the region of interest. In Section III we present analysis of the thermal state of the matter in the galaxy cluster based on the strong gravitational lensing study carried out by Tyson et al. Summary and conclusions follow in Section IV.
II Mass distribution in the galaxy cluster CL0024
That the mass distribution in galaxies or galaxy clusters can be measured using gravitational lensing had been pointed out long time ago [4]. Gravitational lensing is one of the consequences of Einstein’s theory of gravity (General Relativity) in which the light from a distant object is bent by a heavy galaxy or galaxy cluster to produce ”fake” images of the original object. The amount of this distortion is very tiny and for an observable effect to be seen the objects’ alignment should be quite perfect. Still, with billions of galaxies in the sky, a number of gravitational lenses had been discovered in recent years providing excellent tests of the Theory of General Relativity. One of the most famous examples of gravitational lensing is the object known as Einstein’s cross (or Q2237+030), in which the light from a distant quasar is disrupted by a low-redshift galaxy to produce four images in the form of a cross surrounding the galaxy’s nucleus.
Galaxy clusters are one of the most interesting objects for gravitational lensing studies because of their unsurpassed mass and large extent. In fact, precision measurement of gravitational lensing in a galaxy cluster is capable to produce a detailed map of gravitating mass distribution inside the cluster and thus provide valuable information about its structure. In the last decade many clusters exhibiting gravitational lensing have been found and their ”gravitating” mass distributions have been analyzed [2, 5, 6, 7, 8, 9]. It was generally shown that a large portion of mass in galaxy clusters is not associated with the luminous galaxies and form a smooth extended distribution. However, practically never such mass maps, obtained from lensing, have been compared with the distribution of the visible matter inside the corresponding clusters. The study of strong gravitational lensing in galaxy cluster CL0024 by Tyson et al. in 1998 [2] is distinguished in that the detailed maps both for total and visible mass in the cluster were constructed and presented.
The galaxy cluster CL0024+1654 is a remarkable instance of strong gravitational lensing in which multiple images of a background galaxy with distinctive spectrum are formed. In 1998, an analysis of Hubble telescope images of this cluster was carried out by Tyson et al. and the mass profile of the cluster was obtained from strong gravitational lensing. Tyson et al. found that the vast majority of the mass in CL0024 is not associated with the galaxies and forms a smooth elliptical distribution, slightly shallower than isothermal sphere, with a soft core of , where is the normalized Hubble constant. No evidence of in-falling massive clumps had been found for the dark component. The projected dark matter density profile was fit well by a power-law model
| (1) |
where , , and . The primary conclusion was that the cusped mass profile for the dark component, suggested by many-body simulations within the Cold Dark Matter model [10], was inconsistent with the observed results. Along with the total mass distribution Tyson et al. also presented the radial distribution of the visible matter density and of the visible light density.
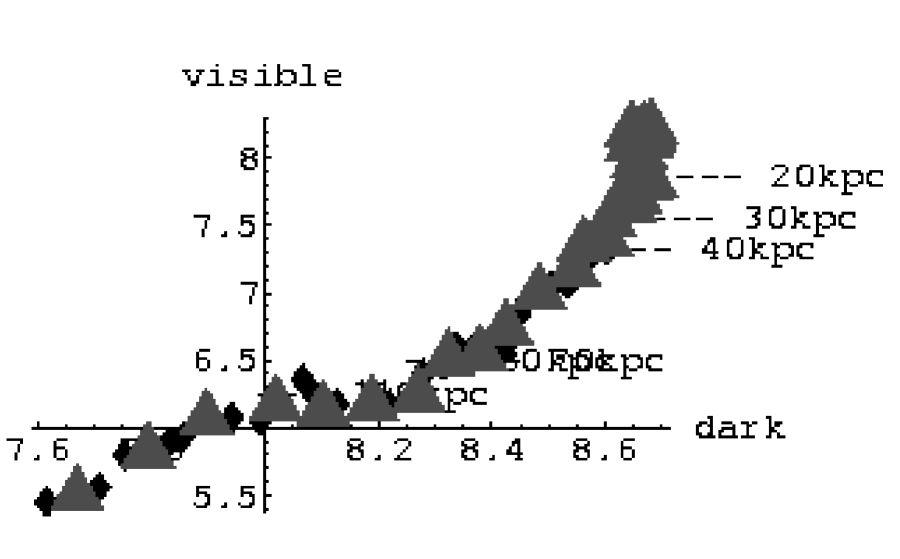
It was recently noticed that the mass profiles obtained in Ref.[2] possess interesting correlation properties [1]. Specifically, if the mass profile of the dark matter and that of the visible matter are plotted one vs. the other on log-log scale, the linear correlation between the two becomes apparent which implies
| (2) |
Remarkably, such behavior of mass profiles should be expected on thermodynamical grounds. For example, for isothermal distribution of self-gravitating gas it is known that the mass profiles satisfy
| (3) |
where is the molar mass for the corresponding component and is the gravitational potential at position [11]. Then, independent from the details of the gas radial distribution, . With somewhat more intricate calculation, the same conclusion can be drawn for a self-gravitating gas just in hydrodynamic and not in full thermal equilibrium. Consider a multi-component gas cloud in hydrodynamic equilibrium, then for the density of each component we can write
| (4) |
where is the partial pressure for component . After a simple manipulation we obtain
| (5) |
and
| (6) |
This tells us that in case the components have temperatures which are locally similar or equal. Thus, the above mentioned log-log-linear correlations may contain important information about the microscopic properties of the dark matter. In this paper we would like to investigate in more details the properties of the mass profiles in the galaxy cluster CL0024. Since in cosmology huge distances and small heat transfer rates seem to interfere with the processes of thermal equilibration, thus reducing the likelihood of thermal equilibrium, such study would be most certainly beneficial.
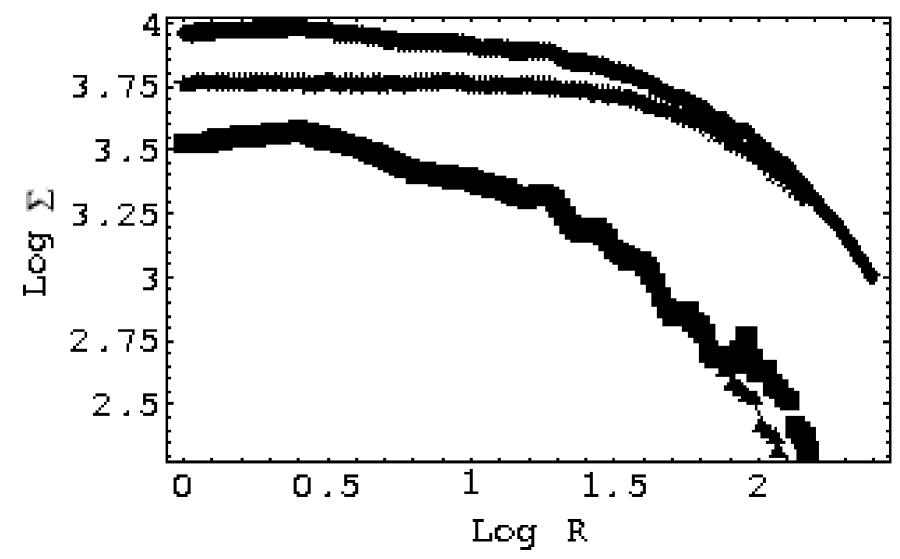
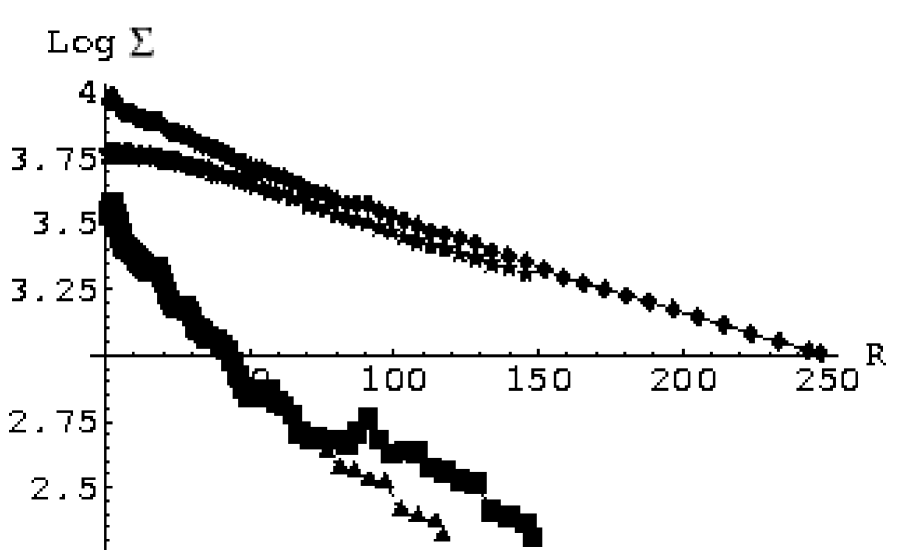
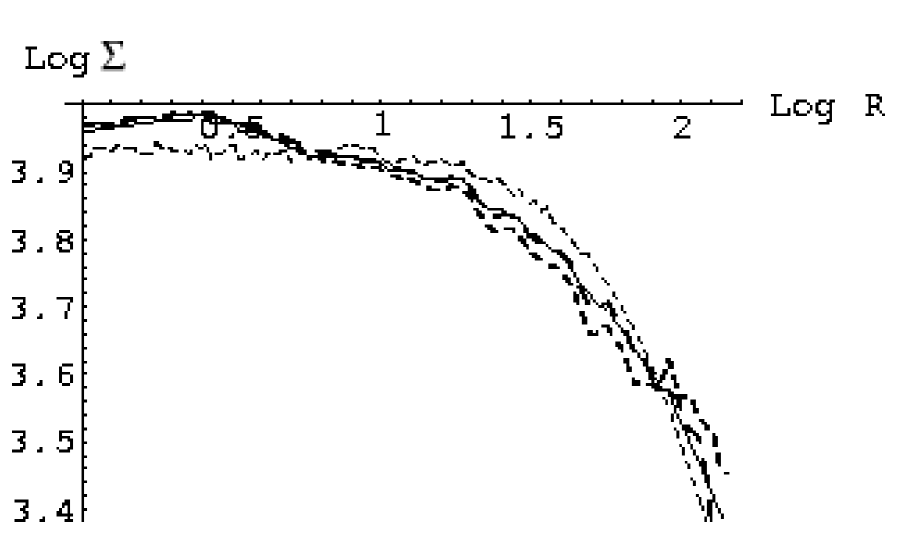
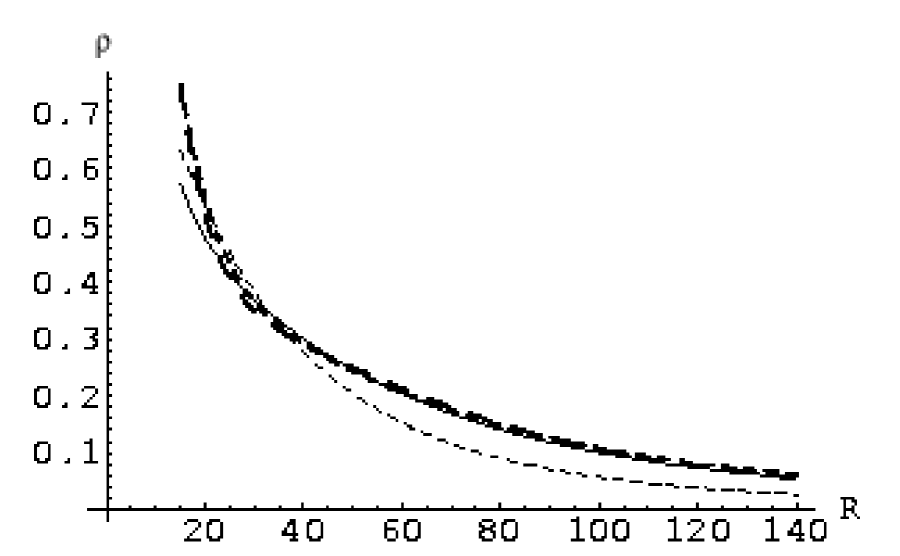
In Ref.[2] the projected radial density profiles for the total mass and the visible matter were originally presented on log-log scale and mass profile for the dark matter could be straightforwardly deduced from these. The total mass and the dark matter form smooth density distribution monotonously decreasing with distance. Similar behavior is observed for the visible matter except for a flat segment at distance of about [see Fig.(1)]. As can be seen from Fig.(1), at this distance is approximately constant for about while all the other profiles continue to fall. While we do not know the origin of such peculiar anomaly, we note that outside of this flat region the mass profile for visible matter has essentially the same behavior. In fact, if we cut out this flat segment and shift the tail of the visible matter distribution to make a continuous curve, we would observe that the obtained profile is almost a perfect straight line on scale [data shown with triangles in Fig.(1)]. Upon inspection, one notices that, actually, on scale all profiles fall linearly with the distance, which implies behavior .
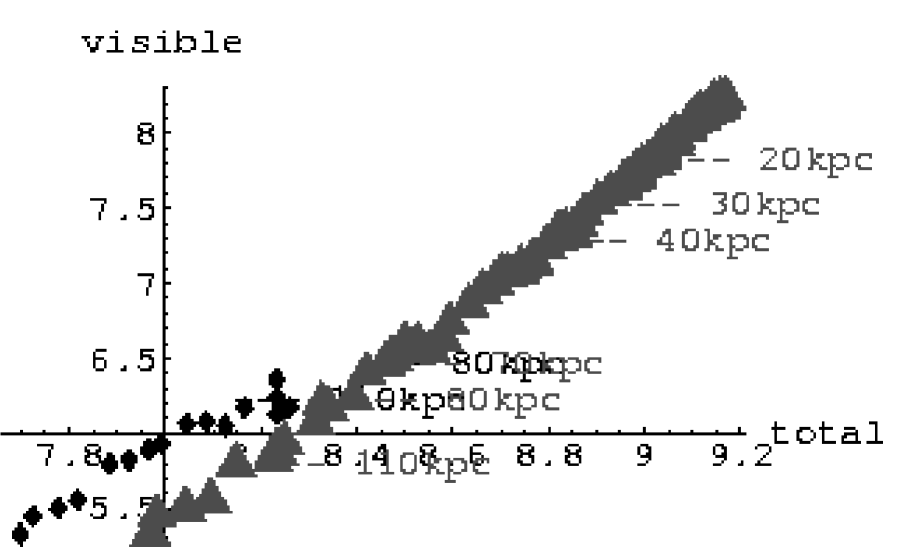
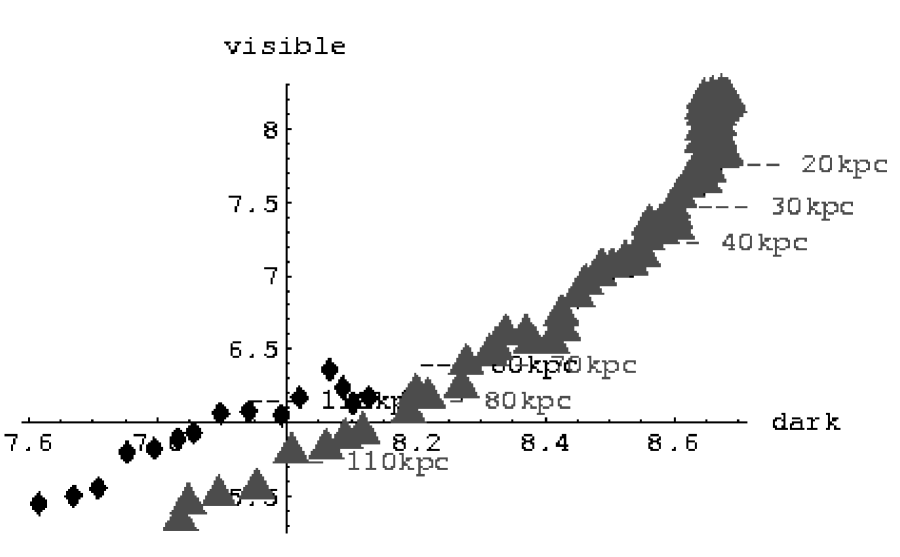
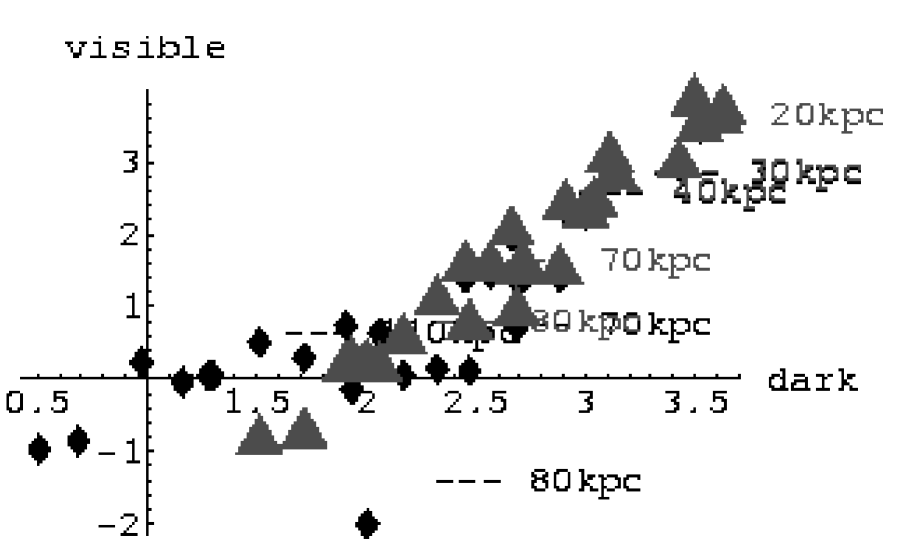
As was already mentioned, it can be noticed that mass distributions of dark and visible matter in CL0024 exhibit linear correlation on log-log scale. Similar property can be observed also for other pairs of mass profiles. For example, if log of the total mass is plotted vs. log of the dark mass, the linear correlation becomes very prominent. The same is true for the total and the visible matter mass densities. In this latter case the anomalous flat segment becomes more prominent; however, if the visible matter mass profile is corrected for this region, the points on log-log scale form almost a perfect line [data shown with triangles in the diagram in Fig.(2)]. The relations between different mass profiles can be further analyzed by looking at different segments of the diagrams in Fig.(2) and Fig.(3). We found that the correlation coefficients tend to decrease somewhat if one moves away from the center of the cluster. We obtained following correlation coefficients, where the error estimate is related to their variation with distance: , , , and
| (7) |
We also note that all three coefficients are consistent with each other and imply the concentration by mass of the dark matter about 80%. For example, from thermodynamic interpretation of we would expect and this is indeed the case. Furthermore, we can write for the total mass density
| (8) |
where is density of dark (visible) matter and is the molar mass of dark (visible) matter. Then, for variation we obtain
| (9) |
where
| (10) |
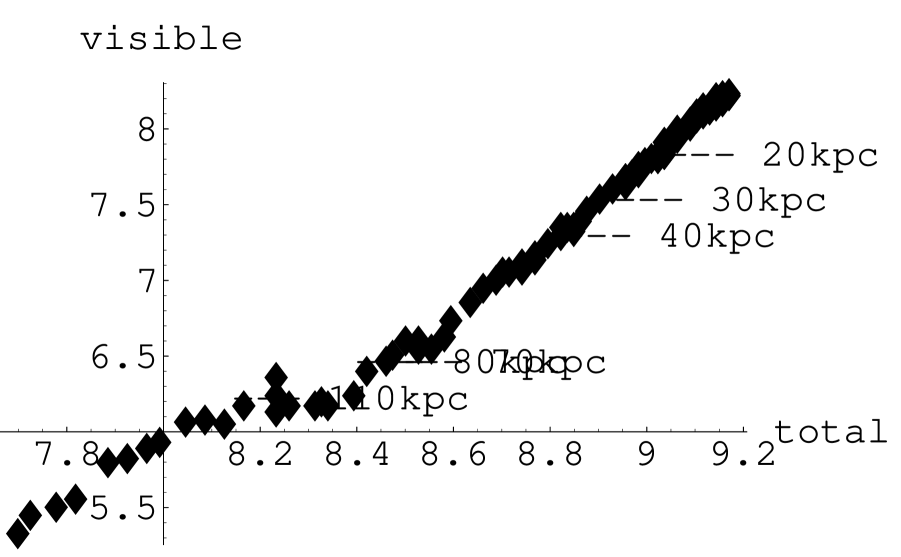
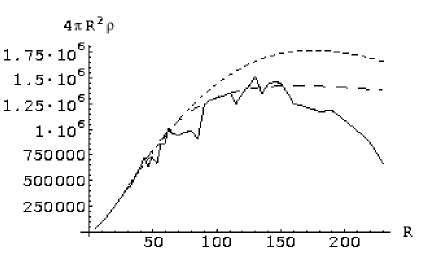
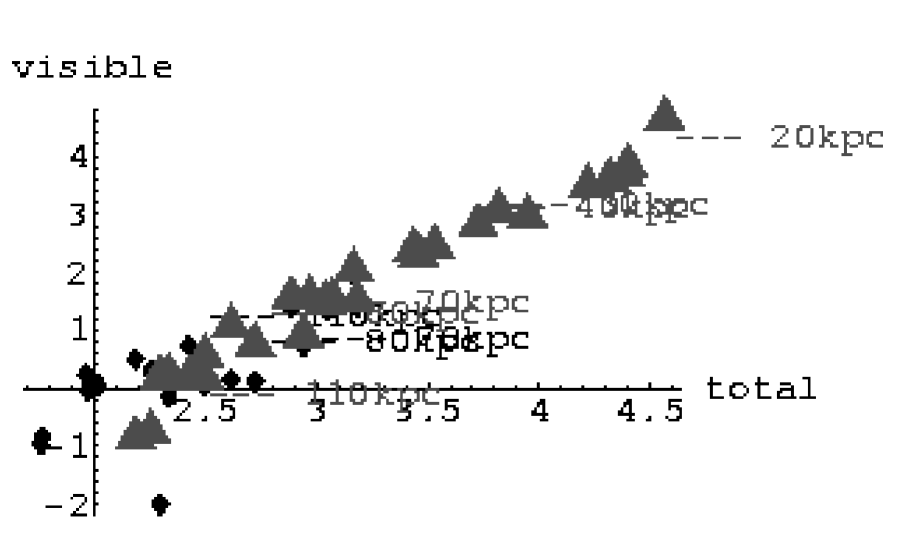
is effective total molar mass. By dividing Eq.(10) with or and taking into account that, for example, , one can immediately verify that all of the above-mentioned coefficients satisfy Eq.(10) with the dark matter concentration by mass , consistent with direct observation from the data by Tyson et al. [see Fig.(4)]


The existence of log-log-linear correlation in CL0024 becomes even more striking once one realizes that similar relation exists in spiral galaxies. In spiral galaxies the presence of dark matter reveals itself through the anomalous behavior of the Rotation Curves (RC) which for large distances do not fall as , according to the Kepler’s law, but remain roughly flat. Such behavior had been analyzed in the literature and fit by synthetic model of Persic and Salucci [3] in which a number of RC where categorized by galaxy luminosity and reproduced with superior accuracy with a simple analytic model (Universal RC) . In this model the distribution of visible matter in the galaxy is described by exponential thin disk with surface density
| (11) |
which is known to fit well the surface brightness of galaxy disks, and dark matter is represented with a spherical flat-core distribution. We noticed that the URC for all luminosities can also be successfully described by a spherical dark hallo with density
| (12) |
in which case and are linearly related with . Surprisingly, the coefficient of such relation varies very insignificantly with galaxy luminosity and corresponds to . This is consistent with obtained from the analysis of log-log-linear correlation between the mass profiles in the galaxy cluster CL0024. Considering that such log-log-linear correlation is, in fact, expected from thermo- or hydrodynamic equilibrium, the above observation is most indicative of the presence of a sort of equilibrium between the dark and the visible component in spiral galaxies and galaxy clusters.
Let us now concentrate on the volume densities of visible and dark matter in CL0024. Note that the log-log-linear correlation observed above was obtained for the projected mass densities , which are the quantities actually measured in the gravitational lensing. At the same time , appearing in Eq.(3), is the volume mass density related to via relation
| (13) |
The projected mass density in general does not uniquely specify the volume density. Only with additional constraints, e.g. the spherical symmetry, Eq.(13) can be inverted; in spherically symmetric case this procedure is known as inverse Abel transformation [12]. As is shown elsewhere, if mass distribution decreases fast enough, the projected mass density can be approximately represented as
| (14) |
where is a slow varying () effective depth and is the density maximum along the line of integration in Eq.(14) [13]. The correlation between then implies
| (15) |
and, if varies quicker than , we get linear correspondence
| (16) |
Since we have observed before that the mass profiles in the galaxy cluster CL0024 decrease exponentially with distance, we do expect that linear correlation will be present between ’s as well. We can estimate the error introduced in our treatment because of the use of projected mass density in place of the volume density by inverting directly the experimental profiles .
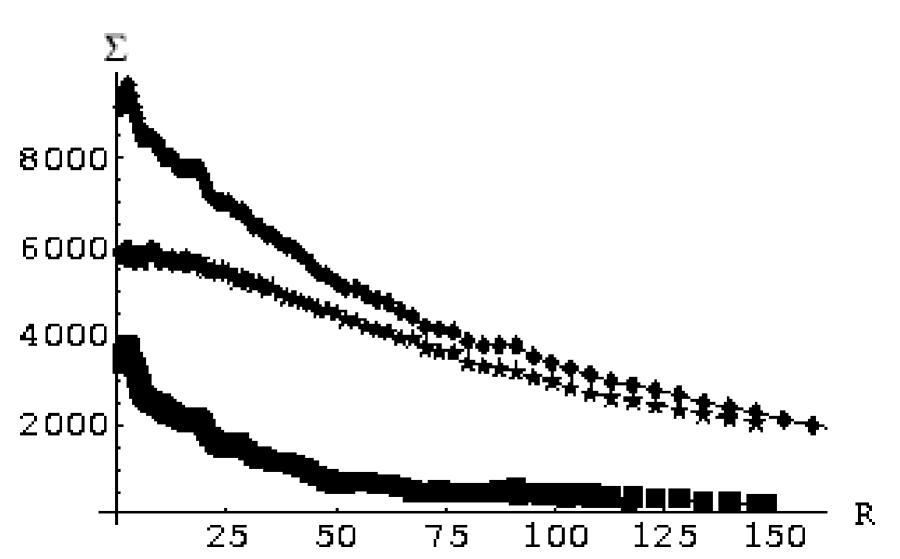
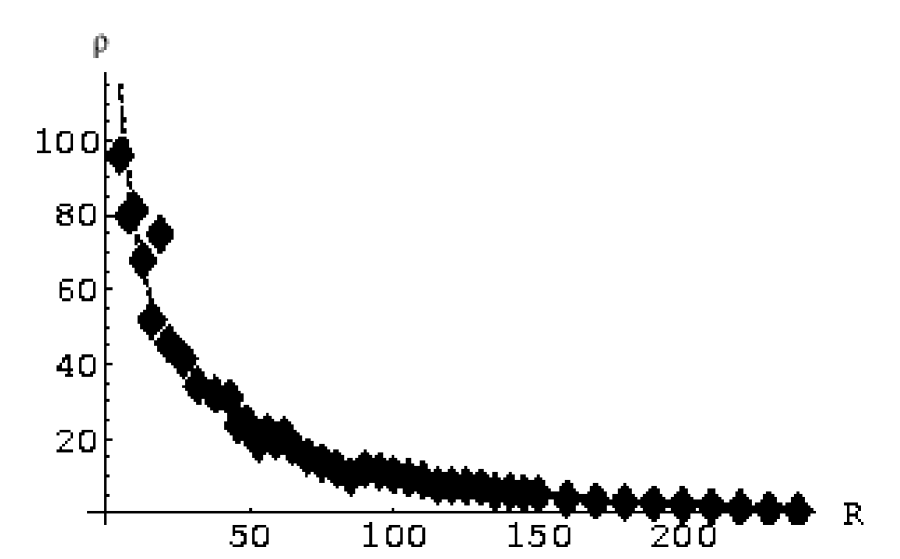
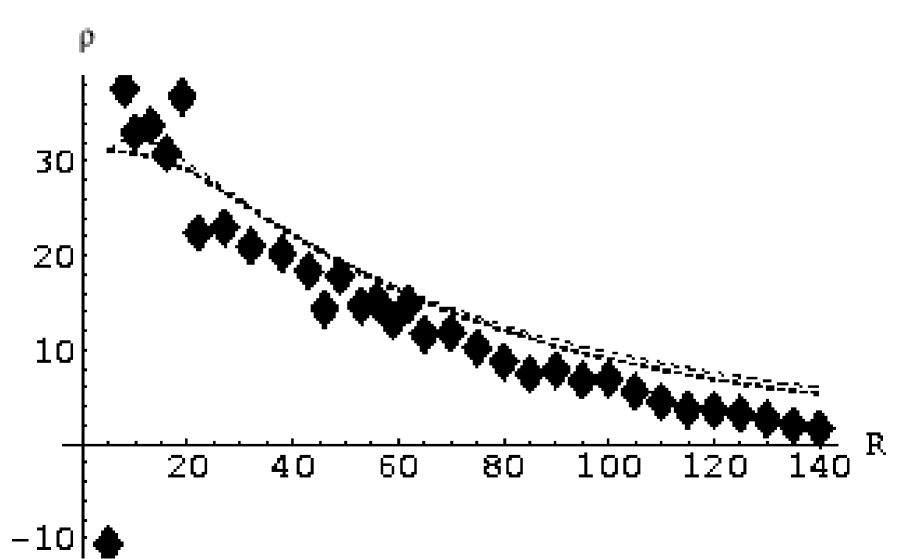
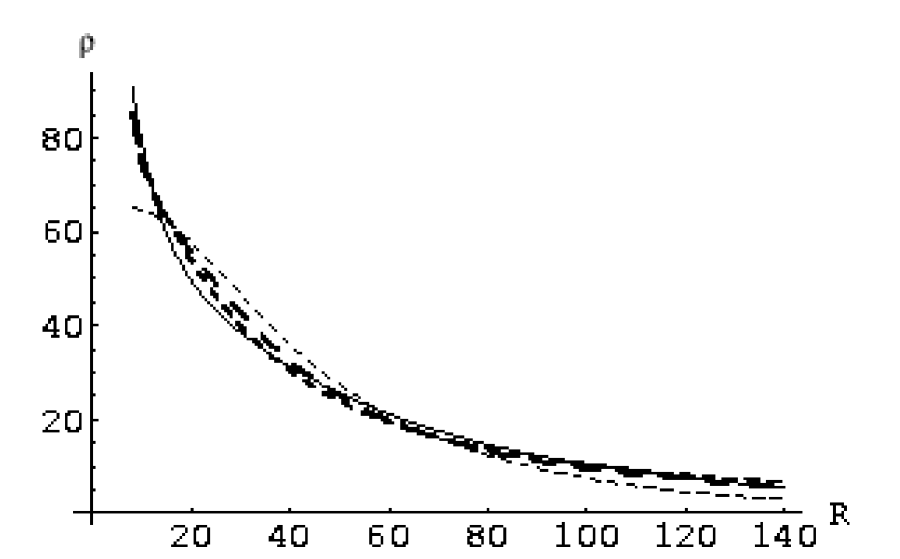
Unfortunately, the inverse Abel transformation requires knowledge of for arbitrary large while experimentally we only know a limited segment for visible and dark components and for total mass profile. Certain strategy must be used to extrapolate the experimental profiles to . In this study we adopt three main strategies: cutting the integration in the inverse Abel transformation to , thus taking ; fitting profiles with a sum of exponentials or fitting profiles with a sum of power-law functions . As should be expected, in every approach obtained radial profiles are similar for small; however, at larger distances a significant model-dependence becomes increasingly apparent. In fact, obtained mass profiles are only model-independent for the central region of the galaxy cluster out to about [see Fig.(5)]. At the same time the central part of these profiles is most sensitive to the noise in , so that we inevitably obtain large errors and noise in practically for all values of [see Fig.(6)].
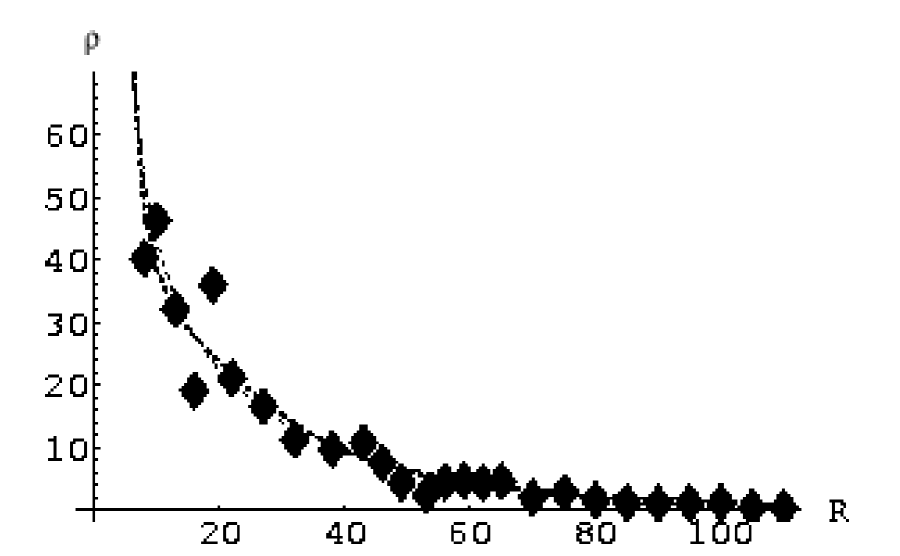
While data-points after inverse Abel transformation are more noisy, the linear correlation still can be seen on the log-log scale between any two mass profiles [see Fig.(7)]. The parameters of this correlation are somewhat dependent on the way the original -distributions were extrapolated, but such variation is well within acceptable bounds. Taking into account this variation, for the parameters of log-log-linear correlation between volume density profiles we obtain ; and . As we can see, the correlation coefficients are close and generally somewhat less from those derived from the projected mass densities; the average error introduced using the projected mass density in place of volume mass density is of the order of 30%.
To understand the origin and magnitude of this error, let’s consider effective depth defined by . Then
| (17) |
and if falls off rapidly with , one expects that will vary relatively slowly with distance and thus the linear correlation between would imply a linear correlation between . Nonetheless, variation of would affect the estimate for and introduce an error of the order of . For example, for the profile of dark matter in the region of interest and . As is expected, the bias introduced by this in our estimate of is of the order of .
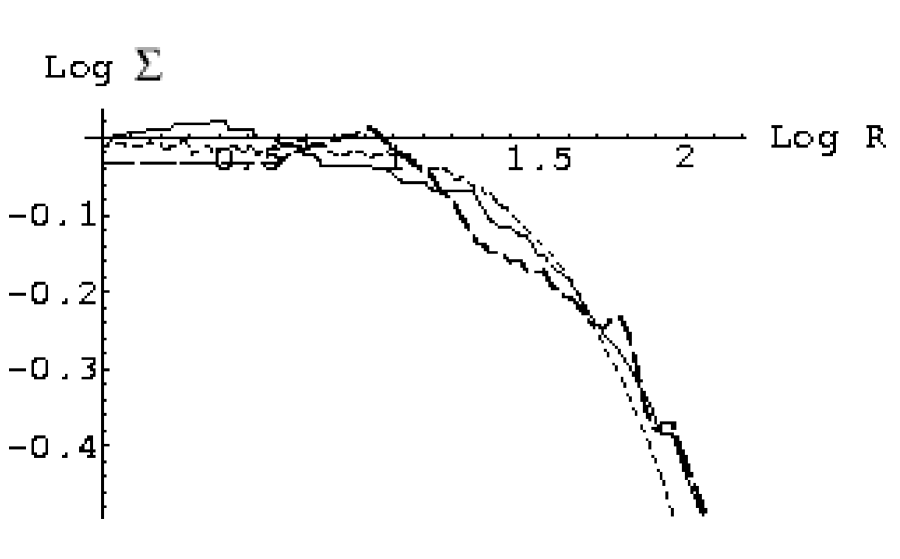
Let us now turn our attention to the alignment properties of the mass profiles in CL0024. In Ref.[1] it was noticed that all mass profiles can be aligned very well by either log-scaling [] or distance-scaling [, as can be seen from Fig.(8). For the parameters of such alignment we find that the dark matter profile can be aligned with the total mass profile by rescaling with , the mass profile for visible matter can be aligned with that for total mass with and the visible mass density profile can be aligned with that for dark matter with . These values are similar to those obtained from log-log-linear correlation. In fact, it becomes obvious that log-scaling alignment is directly related to the existence of log-log-linear correlation and vice-versa.
Similarly, all profiles can be aligned by distance-rescaling . We found that the best fit parameters are for visible-to-dark alignment, for visible-to-total alignment and for dark-to-total alignment. The implication of these alignment properties is less obvious; however, it can be shown that together with log-scaling they imply
| (18) |
From the parameters and listed above we find . This conclusion is consistent with our earlier observation that the projected mass density in galaxy cluster CL0024 fall exponentially with distance;
| (19) |
If this result to be interpreted thermodynamically, , that would imply that the gravitational potential is rising in the region of interest almost linearly. Let us note that the same alignment properties are observed for the volume mass densities as well. All three volume density profiles can be aligned very well with the above-mentioned scaling transformations [see Fig.(9)]. The parameters of these alignments are , , and , and , similar to those obtained from .
III Mass profiles and the thermal state of matter
As was mentioned above, the log-log-linear correlation between mass profiles of the galaxy cluster CL0024 is a very remarkable property, especially given that a similar observation holds for a variety of spiral galaxies and that such correlation is actually expected in case of thermodynamic or hydrodynamic equilibrium. The most tempting interpretation of such correlation is through the thermo- (hydro-) dynamic equilibrium, in which case the should be related to the ratio of the molar masses for visible and dark matter [1]. This assertion, however, is difficult to understand theoretically from what is known or assumed today about the properties of the dark matter [13]. While there exist no direct data indicative of the thermal state of the dark matter, the commonly accepted notion is that the dark matter is extremely weakly interacting and, thus, may well be thermally isolated from the visible matter. Here we would like to see if one can obtain any information about the thermal state of the matter in galaxy cluster CL0024 from the actual mass profiles provided by Tyson et al..
According to Eq.(3) and Eq.(4), the temperature of matter may be estimated from using
| (20) |
or from solving the differential Eq.(5) with respect to with known. In the latter approach one needs to overcome the difficulty that the result of integration in Eq.(5) depends on unknown integration constant, for example . This problem may be partially avoided by integrating Eq.(5) from large distance toward smaller to reduce dependence on the unknown boundary condition or by using close to that obtained from Eq.(20). In either case it can be observed that in the region of interest the dependence on boundary condition is weak.


If the above idea is applied to the galaxy cluster CL0024 with the assumption , as above, the temperature extracted in this way indicates that the dark matter has smooth temperature profile cooling outward, while the visible matter is mostly isothermal with temperature somewhat decreasing in the center of the galaxy cluster. The estimate for the temperature of the visible matter and its decrease toward the center of the cluster is consistent with our understanding of X-ray clusters and the effects of radiative cooling in their centers [14]. Results obtained in this way, however, are only qualitatively reliable.
Since , in the case when the temperature profile is almost isothermal even small correction may be significant. Generally, we expect the ”effective” depth to increase the temperature of the distribution in the center of the cluster relative to the temperature associated with . Obviously, that may have a dramatic effect on our results making, for example, the temperature profile for the dark matter isothermal or breaking isothermality of the visible matter.
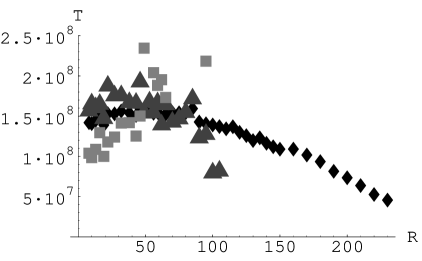
Thus, we do need to consider the above approach applied directly to the volume density profiles . As we have noticed before, the data points after this transformation are significantly more noisy. This problem is even more serious here than in the case of log-log-linear correlations since the resultant -profile is particularly sensitive to the noise in . In fact, the volume density profile obtained with is so noisy that hardly any conclusion can be obtained from it at all. As can be seen in Fig. (11), the only conclusion we can draw is that the temperature of the visible matter is definitely decreasing toward the center of the cluster and that the ”effective” temperature obtained from the total distribution is decreasing in the outer regions of the galaxy cluster.
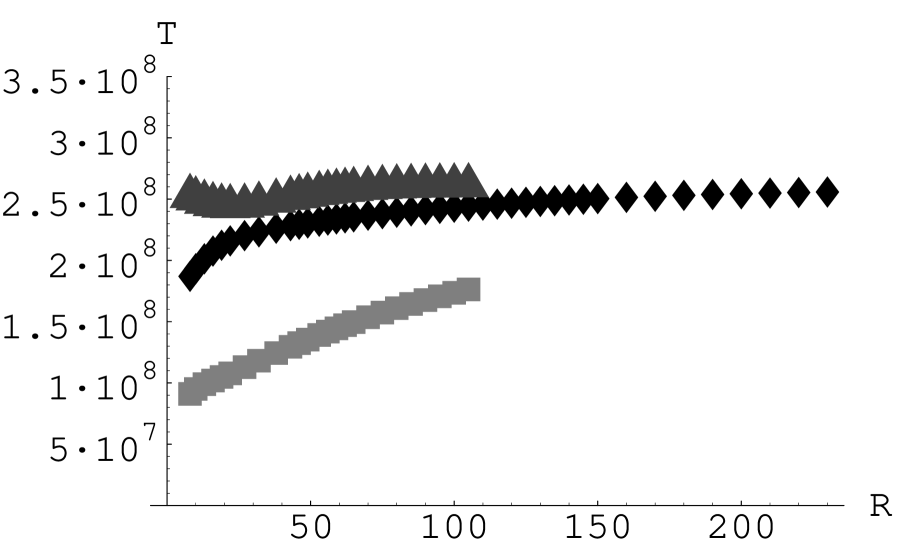
Better results can be obtained when the mass profiles are smoothened and extrapolated with a linear combination of exponential or power-law functions. For both fits we obtain a similar result that the visible matter is cooling significantly in the center of the cluster, consistent with the strong radiative cooling in X-ray clusters mentioned above. At the same time for the dark matter we obtain the distribution close to ”isothermal” which typically cools very slightly in the center. It becomes obvious, therefore, that the local thermal equilibrium between dark and visible matter is significantly broken, at least, in the center of the galaxy cluster. Unfortunately, while these qualitative conclusions are similar for both exponential and power-law extrapolations, the quantitative details differ dramatically between the two, especially for the outer regions of the cluster. The integration of Eq.(5) using exponential extrapolation produces temperature distributions for the dark and the visible components with almost constant ratio . This ratio gets larger toward the center of the galaxy cluster as the visible matter cools rapidly and the dark matter fails to follow the suit. The result of analysis for this case, thus, supports the hypothesis of overall thermal equilibrium. It implies that, although the ratios for visible and dark matter vary with distance, the ratio remains constant for a wide range of values of . The thermal equilibrium is only broken in the central part of the cluster where the rapid radiative cooling of the visible component is essential.
However, the conclusion obtained using the power-law extrapolation is exactly the opposite. In this approach we do find that at large distances the ratios for the visible and the dark matter is practically the same with . This would be consistent with our understanding of the cluster formation. According to our current understanding, the primary heat source in galaxy clusters is gravitational heating. Then, as originally cold gas collapses thereby forming galaxy cluster, the gas molecules acquire kinetic energy , where is the change in gravitational potential during the collapse. Later this kinetic energy is transfered to thermal energy of the matter inside the cluster, so that and thus is the same for all kinds of the particles in the gas cloud. We expect therefore the mass distributions for different components to be similar and , consistent with the result obtained with power-law extrapolation. is not equal to 1 only in the center of the cluster where the visible distribution cools rapidly while the dark matter distribution remains almost isothermal. The temperature of the visible matter in both approaches comes out .


We must conclude, therefore, that the data on the distribution of mass in CL0024 are not sufficient neither to support nor to reject the hypothesis of thermal equilibrium. Only general conclusion can be drawn from this analysis. In particular, the temperature extracted from the mass profile of the visible matter is of the order of and is consistent with X-ray data on galaxy clusters. The temperature of the visible component drops significantly in the center of the cluster and also falls slowly at large distances. The dark matter distribution appears to be close to isothermal with indications of slight cooling in the center. We believe that such behavior may be indicative of nonvanishing thermal connection between the dark and the visible components in the cluster. Still, the data are too uncertain to make this assertion any more definite.
The assumption of the local thermal equilibrium is most certainly violated, at least in the central region, where the effect of radiative cooling of the visible component is the strongest. In the other parts of the galaxy cluster, however, we can neither confirm nor reject the hypothesis of thermal equilibrium as conclusion depends strongly on the way to interpolate the available data to large values of .
IV Conclusion
In this work we extend the analysis of the visible matter, dark matter and total projected mass profiles derived for the galaxy cluster CL0024 from strong gravitational lensing by Tyson et al.. We observe that the linear correlation exists between each pair of mass profiles on log-log scale. This linear correlation is preserved whether one uses the projected mass profiles [] or the volume density profiles []. The difference between the coefficients of log-log-linear correlations obtained for and is small and is of the order of 30%. We obtained following values for the parameters of log-log-linear correlation between dark and visible mass distribution profiles
| (21) |
The correlation coefficients for other pairs of mass profiles were also listed in this paper. We also analyzed in details the alignment properties of the mass profiles in the galaxy cluster. We found that the log-scaling and the distance-scaling, mentioned earlier in the literature, imply (and are consistent with) exponential behavior of the mass profiles in the region of interest
| (22) |
These properties of the mass profiles are striking, especially since similar correlations are observed in the spiral galaxies with . Given huge differences between the systems where such correlations are observed, it appears that this cannot have an accidental character but is related to actual properties of dark and visible matter. Interestingly, such behavior of the mass profiles in self-gravitating system is expected in the case of thermo- or hydrodynamic equilibrium. Whenever the thermal states of the components in such system are similar, one expects
| (23) |
It is therefore tempting to interpret the observed correlations as a sign of equilibrium between the dark and the visible components in the galaxy cluster in which case the ratio corresponds to the molar mass ratio of visible and dark matter
| (24) |
This suggests the mass of the dark matter particle between . To our knowledge, there are no candidates within this mass range in the current extensions of Standard Model. Massive neutrinos and axions have experimental mass limits MeV for the heaviest -neutrino [15] which is well below our range. The most favorable candidates for non-baryonic dark matter, such as Weakly Interacting Massive Particle (WIMP) with the mass anywhere between 10GeV and 1TeV and the SUSY lightest particle, e.g. neutralino, with the mass above 30GeV [16], are far above the range obtained in our study. In fact, the closeness of to QCD-energy scale may indicate that dark matter is ultimately related to QCD phenomena, such as quark and gluon condensations. Whether this is true and what kind of connection may exist between the dark matter and QCD is an interesting topic for further discussion.
The concept of thermo- (hydro-) dynamic equilibrium between dark and visible matter encounters significant theoretical difficulties in trying to understand the possible source of equilibrium between, supposedly, extremely weakly interacting dark and visible components. For that reason we further analyzed what kind of information about the thermal properties of the matter in the galaxy cluster CL0024 can be extracted from available measurement. In our analysis we found that for visible matter the average temperature is of the order of , consistent with what we know about the temperature of the intergalactic gas in X-ray clusters. We also found that the temperature of the visible matter drops significantly in the center of the cluster, also consistent with what we know about radiative cooling in X-ray clusters. For the dark matter we obtained almost isothermal temperature profile with signs of slight cooling in the center of the cluster. We believe that such behavior may indicate existence of thermal connection between dark and visible matter. At the same time we found that the available data are insufficient to either confirm or reject hypothesis of thermal equilibrium as the conclusion depends strongly on the way the data are smoothened and extrapolated at large distances. While in the central part of the cluster the equilibrium is most certainly broken by rapid radiative cooling of the visible component, in the other parts of the galaxy cluster one can find signs consistent either with full thermal equilibrium or full thermal isolation between the dark and the visible components - depending on the way the projected mass density profiles are extrapolated.
We must conclude therefore that no reliable quantitative conclusion about the thermal state of matter in the galaxy cluster CL0024 can be reached on the basis of known mass density profiles.
The observed similarities in the relative behavior of dark and visible matter in spiral galaxies and galaxy cluster CL0024 are very puzzling and deserve further investigations. While the precision of individual mass distribution measurements in galaxy clusters may be insufficient to obtain certain conclusions about the origin of such behavior, the synthetic analysis of few such studies may be helpful. One needs to see if the log-log-linear correlation can be found in other galaxy clusters and if its coefficients have similar values to those we have observed here.
REFERENCES
- [1] Y. Mishchenko and C.-R. Ji, Phys. Rev. D 68, 063503 (2003); astro-ph/0301503.
- [2] J.A. Tyson et al., astro-ph/9801193.
- [3] M.Persic, P.Salucci, F.Stel:MNRAS, 281, 27 (1996).
- [4] N. Straumann, astro-ph/0108255.
- [5] X-P. Wu, T. Chiueh, L-Z. Fang and Y-J. Xue, asto-ph/9808179.
- [6] J-P. Kneib, astro-ph/0009385.
- [7] H. M. AbdelSalam, P.Saha, astro-ph/9806244.
- [8] J.Bezecourt & all, astro-ph/0001513.
- [9] M. White, L. Hernquist, V. Springel, astro-ph/0107023.
- [10] J.Navaro, C.Frenk, S.White; ApJ, 462, 563 (1996).
- [11] G.N.Hatsopoulos, J.H.Kennan, Principles of general thermodynamics, Wiley, pp.513-515, 1965.
- [12] J. Binney and S. Tremaine Galactic Dynamics. Princeton, NJ: Princeton University Press, p. 651, 1987
- [13] Y. Mishchenko and C.-R. Ji, in preparation.
- [14] C. Sarazin X-ray emission from clusters of galaxies. Cambridge: Cambridge University Press, p. 252, 1988.
- [15] W.Hu, D.Eisenstein, M.Tegmark, Phys. Rev. Lett. 80, 5255-5258 (1998); astro-ph/9712057.
- [16] S.Khalil, C.Munoz, Contemp. Phys. 43, 51-62 (2002); astro-ph/0110122.