Galaxy Size Evolution at High Redshift and Surface Brightness Selection Effects: Constraints from the Hubble Ultra Deep Field1
Abstract
We use the exceptional depth of the Ultra Deep Field (UDF) and UDF-Parallel ACS fields to study the sizes of high redshift () galaxies and address long-standing questions about possible biases in the cosmic star formation rate due to surface brightness dimming. Contrasting , , and -dropout samples culled from the deeper data with those obtained from the shallower GOODS fields, we demonstrate that the shallower data are essentially complete at bright magnitudes to and that the principal effect of depth is to add objects at the magnitude limit. This indicates that high redshift galaxies are compact in size () and that large (, kpc) low surface brightness galaxies are rare. A simple comparison of the half-light radii of the HDF-N + HDF-S -dropouts with , , and -dropouts from the UDF shows that the sizes follow a scaling towards high redshift. A more rigorous measurement compares different scalings of our -dropout sample with the mean profiles for a set of intermediate magnitude () -dropouts from the UDF. The best-fit is found with a size scaling (for fixed luminosity). This result is then verified by repeating this experiment with different size measures, low redshift samples, and magnitude ranges. Very similar scalings are found for all comparisons. A robust measurement of size evolution is thereby demonstrated for galaxies from to using data from the UDF.
1 Introduction
Cosmic surface brightness dimming, with its scaling, poses a significant challenge to the study of high redshift galaxies (e.g., the bias proposed by Lanzetta et al. 2002). Offsetting this is the expectation that galaxies would be denser and therefore higher surface brightness at high redshift (Mo, Mao, & White 1998). Only recently has it become possible to explore these issues observationally (Bouwens, Broadhurst, & Illingworth 2003; Ferguson et al. 2004). A study of objects from the Great Observatories Origins Deep Survey (GOODS) showed a clear decrease in size (increase in surface brightness) from to and beyond (Ferguson et al. 2004). Other studies (Bouwens et al. 2004a; Bouwens et al. 2004, hereinafter, B04) then demonstrated that the decrease extended to . However, in extending this trend, it was necessary to make some assumptions about the surface brightness distribution at since only the highest surface brightness objects are accessible in GOODS at these redshifts.
In this paper, we use the exceptional depth of the Ultra Deep Field (UDF; Beckwith et al. 2004) and the UDF-parallel ACS fields (hereinafter, UDF-Ps; Bouwens et al. 2004a) to look at the size (surface brightness) distribution out to . These fields reach nearly and mags deeper than GOODS and for the first time permit clean comparisons relative to lower redshift () samples. The superb depth of these fields also allows for an important estimate of the incompleteness at high redshift in shallow, wide area surveys like GOODS. Throughout, we refer to the value for , (Steidel et al. 1999) as and the F606W, F775W, and F850LP filters as , and , respectively. We assume (Bennett et al. 2003).
2 Observations and Analysis
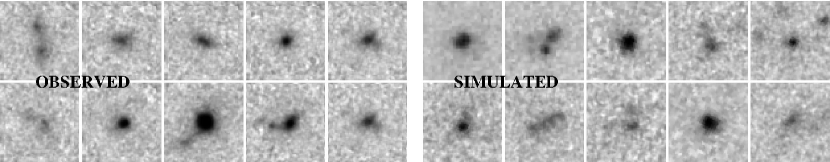
To maximize our baseline for determining size changes in high redshift galaxies (), we adopt a dropout sample set. For our -dropout sample, objects are selected from the WFPC2 HDF-N and HDF-S images (B04). For the higher redshift , , and -dropout samples, objects are selected at three different depths: one based on the relatively shallow, wide-area GOODS fields (B04), one based on the deeper two UDF-Ps, and one based on the UDF itself. The selection criteria for the samples are the same ones that were applied in B04, with magnitude limits given in Table 1 (see B04 and Bouwens et al. 2004c). These selection criteria include all but the reddest starbursts (UV continuum slopes , or equivalently applied to a yr burst) and some evolved galaxies (Franx et al. 2003) though the former objects are expected to be rare (Adelberger & Steidel 2000). Contamination from low-redshift interlopers is also expected to be small for these samples (%, B04). Figure 1 shows some examples of -dropouts from the UDF.
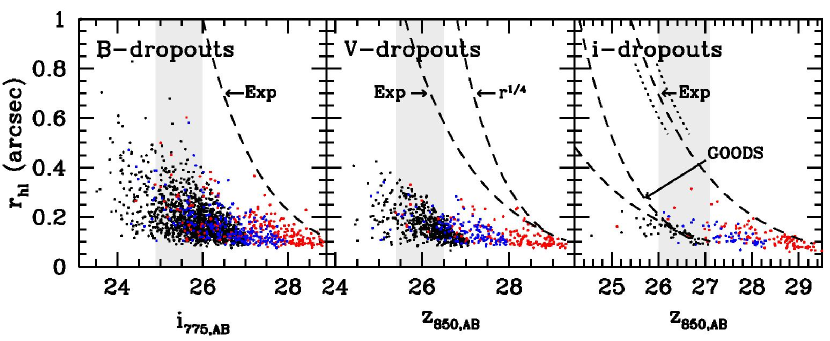
(a) Completeness / Surface Brightness Distributions. Before addressing size evolution across our sample set, it is important to examine what effect, if any, surface brightness biases might have on samples selected at the three depths considered here. A convenient way of looking at these biases is to use the size-magnitude diagram with completeness limits overplotted. Figure 2 shows the objects observed from all three fields for each dropout sample using the passband closest to rest-frame 1600 for the magnitude/size measurements. The half-light radii are calculated in circular apertures and rely on Kron-style magnitudes (1980) (with the Kron factor equal to 2.5) to establish the total flux. The 50% completeness limits are determined from a grid of simulations over size and magnitude. As is clear from Figure 2, the principal effect of the additional depth is to extend these samples to fainter magnitudes; larger, lower surface brightness objects do not appear in the deeper data. This suggests that high redshift galaxies are predominantly compact (″) and that surface brightness biases only have a significant impact on samples close to the magnitude limit (e.g., the GOODS -dropout sample).
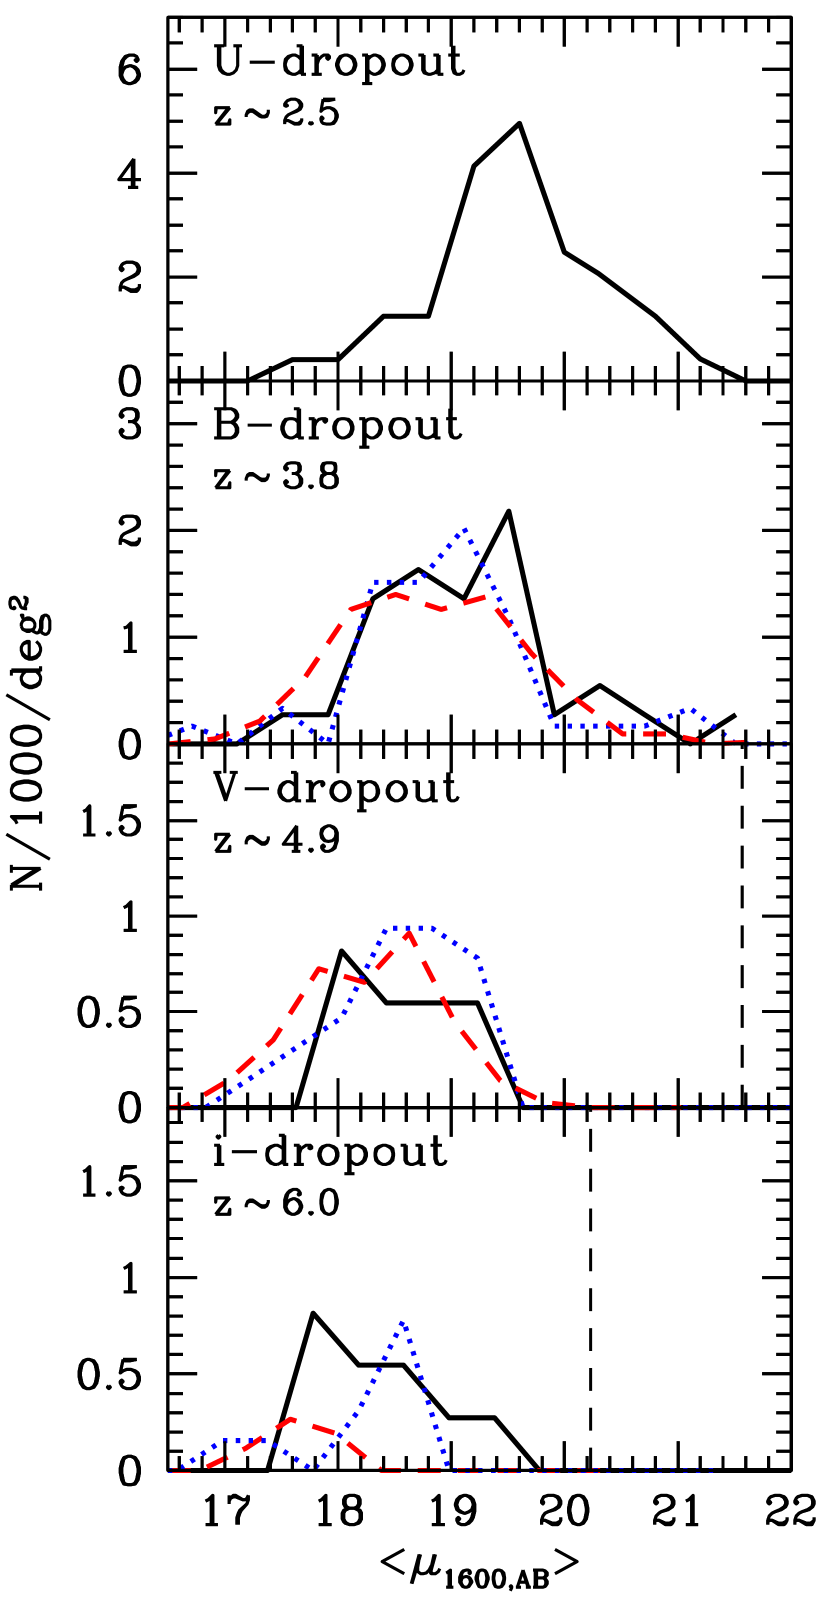
Binning the data in surface brightness provides us with an alternative way of identifying biases. Incompleteness in shallower surveys will result in a lower surface density and a higher mean surface brightness (reflecting the loss of the lower surface brightness population). To do this simultaneously with all dropout samples, we derive surface brightness distributions over a fixed range in luminosity (0.3-1.0 ) (corresponding to the magnitude intervals , , , and for our , , , and -dropout samples, respectively – see the gray vertical bands in Figure 2). The result is plotted in Figure 3. The surface brightnesses for individual objects are the mean values within the half-light radius using the mean color and redshift for each sample (see B04) to calculate . As expected, no strong biases are apparent for the lower redshift or -dropout samples, confirming the essential completeness of samples derived from the shallower data sets at these magnitudes. This situation is different however for the -dropouts as can be seen from the bias in both the mean surface brightnesses and the surface densities: a significantly lower 17.6 mag/arcsec2 in the GOODS fields vs. the 18.2 mag/arcsec2 in the UDF-Ps and 18.3 mag/arcsec2 in the UDF; and a significantly lower -dropouts arcmin-2 in the GOODS fields vs. the in the UDF-Ps and in the UDF, respectively. Such a bias is not unexpected given the proximity of the GOODS -dropout sample to its completeness limit (Table 1).
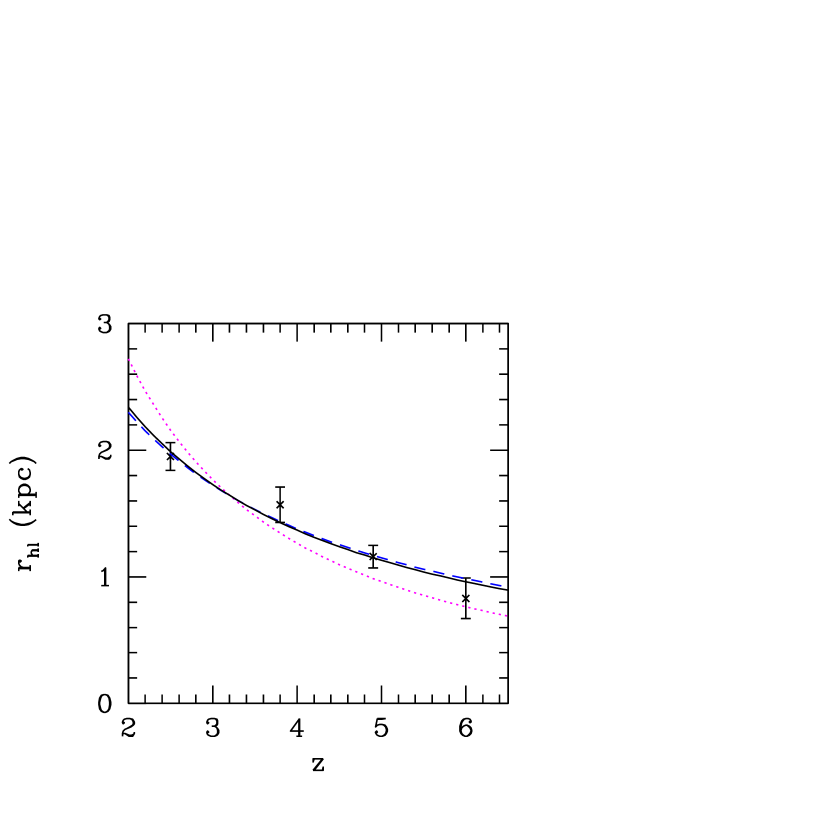
(b) Size/Surface Brightness Evolution. Having shown that our deeper data sets are reasonably complete at intermediate magnitudes, we proceed to measure the size evolution out to . Before making more rigorous estimates using a specific functional form, it is useful just to look at how the mean size (half-light radius) varied across our four dropout samples for objects of fixed luminosity () from Figure 2. To minimize biases, only the UDF is used for the , , and -dropout samples. Similar to the strong trends seen at high redshift with the GOODS data (Ferguson et al. 2004) where sizes decrease monotonically towards high redshift, the present data follow a relationship with redshift (Figure 4).
The next step is to measure the size evolution in a more rigorous manner giving greater emphasis to selection and measurement biases. To do this, we use different scalings of a lower redshift sample to model the UDF -dropouts, our deepest sample. Previously, we used such a procedure to estimate the size evolution from the UDF-Ps alone (Bouwens et al. 2004a). Here, we take advantage of the additional mag depth available from the UDF to extend this comparison to fainter magnitudes, , increasing the size of our samples. This magnitude range is useful since the UDF is complete to for objects of modest size ( – see Figure 2). As in our previous work, we adopt the HDF-N + HDF-S -dropout sample as our low redshift baseline to maximize leverage in and consider size scalings of the form where , projecting the lower redshift objects to using our well-established cloning machinery (Bouwens et al. 1998a,b; Bouwens et al. 2003; B04), which handles the artificial redshifting and reselection of galaxies. Finally, before comparing against the cloned sample, the UDF observations are smoothed to the -dropout PSF (ACS images) projected to (0.12″ FWHM).
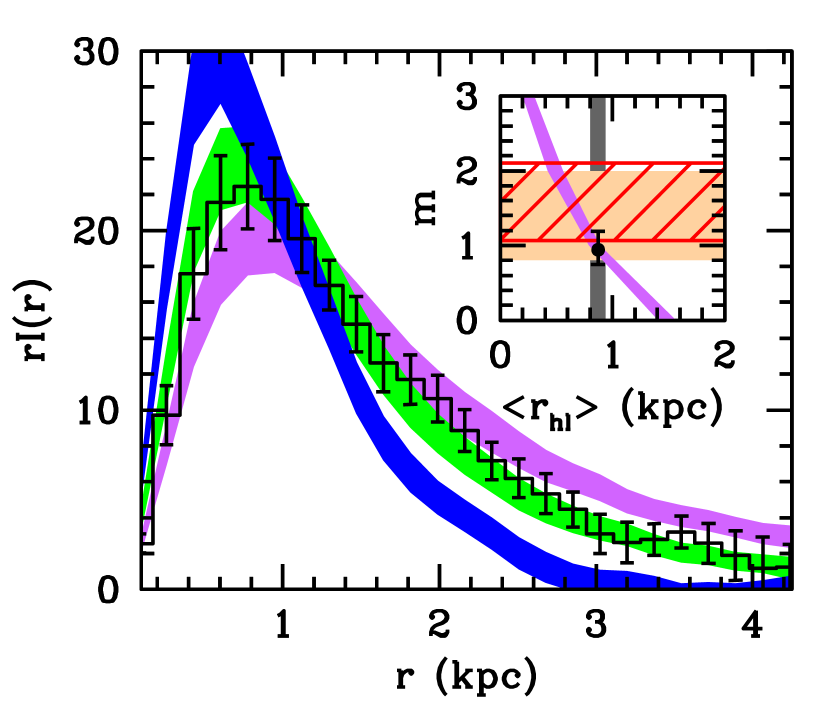
To evaluate the validity of the different scalings, comparisons are made using the mean radial flux profile (see B04). This gives the mean flux in circular annuli as a function of radius. An illustration of how the observations match different size scalings is provided in Figure 5, and it is clear that the observations prefer a size scaling of the -dropouts (for fixed luminosity). The and scalings produce profiles which are too broad and too sharp, respectively. Deriving the mean and scatter expected for different scalings and measuring the mean size from the observations (both corrected for PSF effects), we can estimate the best-fit value for , which is . To verify this result, the comparison was repeated in three distinct ways: (1) making the comparison in terms of the individual sizes of the cloned -dropouts vs. the UDF -dropouts, (2) using the mean radial flux profile of a cloned -dropout sample from the UDF to compare with the UDF -dropouts, and (3) making the same comparison between the cloned -dropouts and UDF -dropouts at fainter magnitudes (). With the possible exception of the third comparison (where a slightly shallower scaling was obtained), all three experiments yielded very similar scalings (), suggesting that the basic result here is robust.
3 Discussion and Summary
In this paper, we use the exceptional depth available in the UDF and UDF-Ps to examine the distribution of sizes and magnitudes of galaxies at and contrast the results with shallow surveys like GOODS. We find that the principal effect of depth is to add galaxies at faint magnitudes, not larger sizes, demonstrating that high redshift galaxies are predominantly compact (″) and that large (, kpc) low surface brightness objects are rare at high redshift. The UDF therefore provides more conclusive evidence for trends which were already apparent in the shallower HDF + GOODS data (Bouwens et al. 2003; Storrie-Lombardi, Weymann, & Thompson 2003; Ferguson et al. 2004; Giavalisco et al. 2004; B04) and HST follow-up to ground-based dropout samples (Giavalisco, Steidel, & Macchetto 1996) (see also discussion in Bunker et al. 2004).
Contrasting galaxy sizes at the high and low redshift ends of our sample set, we show that objects follow an approximate relationship with redshift (for fixed luminosity). Although consistent, this is less steep than the scaling determined at brighter ( mag) luminosities in our earlier analyses (B04; Bouwens et al. 2004a) and hence there may be some luminosity dependence to this scaling (and therefore evolution in the slope of the size-magnitude relationship), see also the scaling from the third comparison above. Note that the current scaling is essentially identical to the scaling expected for systems of fixed mass (Mo et al. 1998), pointing to a ratio which does not evolve much at high redshift for -bright galaxies. Since one can plausibly express the UV luminosity as the gas mass divided by some star formation time scale, one possible implication of the constant M/L ratio is one where this time scale does not evolve much with cosmic epoch. This is in contrast to the steep evolution in dynamical time and suggests a scenario where feedback processes are dominant in regulating the star formation efficiency.
Interestingly enough, a recent study (Trujillo et al. 2004) at lower redshift () found that size does not evolve much with redshift for a fixed stellar mass contrary to the Mo et al. (1998) scaling. It is unknown whether this will hold true for the dynamical masses, or how this might change at earlier times. A resolution of these questions will undoubtably require the measurement of these quantities to higher redshift.
References
- Adelberger & Steidel (2000) Adelberger, K. L. & Steidel, C. C. 2000, ApJ, 544, 218.
- Beckwidth (2004) Beckwith, S. V. W. et al. 2004, in preparation.
- Bennett et al. (2003) Bennett, C. L. et al. 2003, ApJ, 583, 1.
- Bouwens, Broadhurst and Silk (1998) Bouwens, R., Broadhurst, T. and Silk, J. 1998a, ApJ, 506, 557.
- Bouwens, Broadhurst and Silk (1998) Bouwens, R., Broadhurst, T. and Silk, J. 1998b, ApJ, 506, 579.
- Bouwens, Broadhurst, & Illingworth (2003) Bouwens, R., Broadhurst, T., & Illingworth, G. 2003, ApJ, 593, 640.
- Bouwens et al. (2004) Bouwens, R. J., et al. 2004a, ApJ, 606, L25.
- Bouwens et al. (2004) Bouwens, R.J, Broadhurst, T.J., Illingworth, G.D., Meurer, G.R., Blakeslee, J.P., Franx, M., & Ford, H.C. 2004b, ApJ, submitted (B04).
- Bouwens et al. (2004) Bouwens, R.J, et al. 2004c, ApJ, in preparation.
- Bunker et al. (2004) Bunker, A.J., Stanway, E.R., Ellis, R.S., McMahon, R.G. 2004, MNRAS, submitted.
- Ferguson et al. (2004) Ferguson, H. C. et al. 2004, ApJ, 600, L107.
- Franx et al. (2003) Franx, M., et al. 2003, ApJ, 587, L79.
- Giavalisco, Steidel, & Macchetto (1996) Giavalisco, M., Steidel, C. C., & Macchetto, F. D. 1996, ApJ, 470, 189.
- Giavalisco et al. (2004) Giavalisco, M. et al. 2004, ApJ, 600, L103.
- Kron (1980) Kron, R. G. 1980, ApJS, 43, 305.
- Lanzetta et al. (2002) Lanzetta, K. M., Yahata, N., Pascarelle, S., Chen, H., & Fernández-Soto, A. 2002, ApJ, 570, 492.
- Mo, Mao, & White (1998) Mo, H. J., Mao, S., & White, S. D. M. 1998, MNRAS, 295, 319.
- Steidel et al. (1999) Steidel, C. C., Adelberger, K. L., Giavalisco, M., Dickinson, M. and Pettini, M. 1999, ApJ, 519, 1.
- (19) Storrie-Lombardi, L.J., Weymann, R.J., & Thompson, R.I. 2003, ApJ, 591, 623.
- (20) Trujillo, I., et al. 2004, ApJ, 604, 521.
- Williams, R.E, et al. (1996) Williams, R.E., et al. 1996, AJ, 112, 1335.
| Area | AB Mag. | |||
|---|---|---|---|---|
| Sample | # | LimitaaSample Selection Limit. | bbLimiting luminosity, using the Steidel et al. (1999) value for . | |
| (HDFs) | 9 | 197 | 0.08 | |
| (GOODS) | 294 | 1301 | 0.14 | |
| (UDF-Ps) | 21 | 231 | 0.06 | |
| (UDF) | 13 | 248 | 0.02 | |
| (GOODS) | 294 | 491 | 0.23 | |
| (UDF-Ps) | 23 | 127 | 0.09 | |
| (UDF) | 13 | 160 | 0.03 | |
| (GOODS) | 294 | 52 | 0.33 | |
| (UDF-Ps) | 23 | 37 | 0.13 | |
| (UDF) | 13 | 85 | 0.04 |