DUST TEMPERATURES IN ASYMMETRIC PRESTELLAR CORES
We present 2D Monte Carlo radiative transfer simulations of flattened prestellar cores. We argue the importance of observing prestellar cores near the peak of their emission spectra, and we point out observable characteristic features on isophotal maps of asymmetric cores at FIR wavelengths that are indicative of the cores’ density and temperature structure. These features are on scales 1/5 to 1/3 of the overall core size, and so high resolution observations are needed to observe them. Finally, we discuss the importance of determining the temperatures of prestellar cores with high accuracy.
Keywords: Stars: formation – ISM: clouds-structure-dust – Methods: numerical – Radiative transfer
1 Introduction
Prestellar cores are condensations in molecular clouds that are on the verge of collapse or already collapsing. Their study is important for constraining the initial conditions for star formation (see André et al. 2000). Prestellar cores have typical sizes AU, and typical masses . They are cold with typical dust temperatures K. Their density profiles tend to be flat in the centre and to fall off as () in the envelope. Many authors have used Bonnor-Ebert (BE) spheres to represent prestellar cores (e.g. Alves et al. 2001). However, studies of the shapes of cores indicate that they are best described as triaxial ellipsoids, and they are close to being oblate spheroids (Goodwin et al. 2002). Additionally, numerical simulations of the collapse of turbulent molecular clouds indicate that prestellar cores are transient, non-spherical systems, which when projected onto the plane of sky appear to mimic BE spheres (Ballesteros-Paredes et al. 2004). Information about prestellar cores comes from molecular line observations (e.g. NH3, CO), but also from continuum observations, where cores are seen in emission (FIR, submm and mm) or absorption (NIR). In this paper, we focus on modelling the continuum emission of prestellar cores.
2 Asymmetric models of prestellar cores
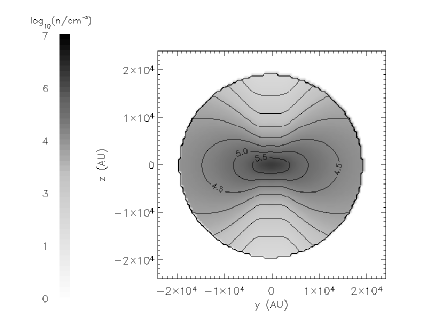
We use 2D models to represent slightly asymmetric prestellar cores (see Stamatellos et al. 2004). Our goal is to capture generically the different features we might hope to detect on the isophotal maps of such cores. We use a Plummer-like density profile (Plummer 1915), that is modified to include azimuthally symmetric departures from spherical symmetry. This profile is simple and captures the basic observed characteristics of prestellar cores. Here, we present a model of a slightly flattened core (disk-like asymmetry; Fig. 1, left), with density profile
| (1) |
where is the density at the centre of the core, and is the extent of the central region in which the density is approximately uniform. The parameter determines the equatorial-to-polar optical depth ratio , i.e. the maximum optical depth from the centre to the surface of the core (), divided by the minimum optical depth from the centre to the surface of the core ( and ). The parameter determines how rapidly the optical depth from the centre to the surface rises with increasing , i.e. going from the north pole at to the equator at . We assume that the core has a spherical boundary at radius , and , , , , and . The simulations are performed using Phaethon, a 3D Monte Carlo radiative transfer code (Stamatellos & Whitworth 2003).
3 Dust temperature profiles
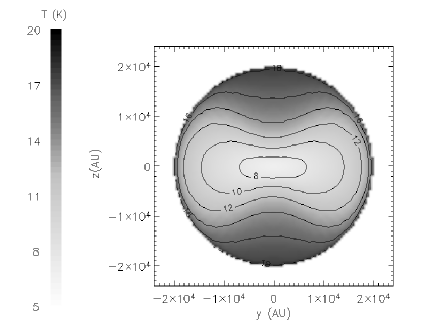
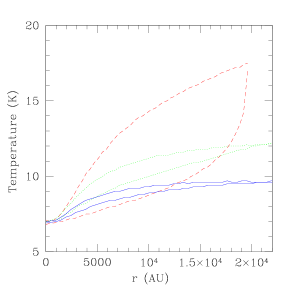
The dust temperature (Fig. 1, right) drops from around 17 K at the edge of the core to 7 K at the centre of the core (also see Zucconi et al. 2001; Evans et al. 2001; Stamatellos & Whitworth 2003). We find that the dust temperature inside a core with disk-like asymmetry is dependent, similar to the results of Zucconi et al. (2001) and Gonçalves et al. (2004). As expected, the equator of the core is colder than the poles. The difference in temperature between two points having the same distance from the centre of the core but with different polar angles , is larger for more asymmetric cores (see Stamatellos et al. 2004). This temperature difference will affect the appearance of the core at wavelengths shorter than or near the core peak emission.
4 SEDs and isophotal maps
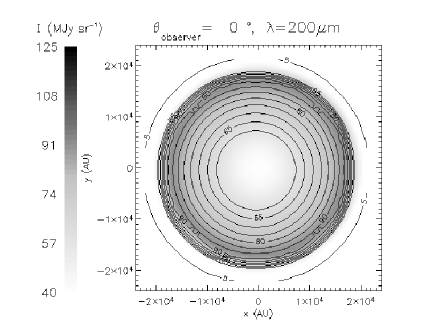
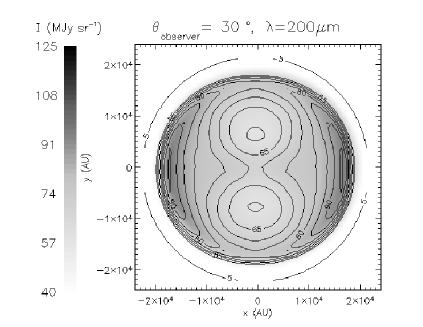
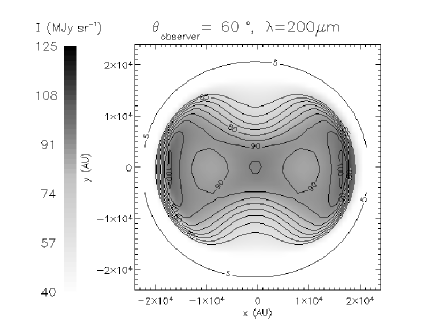
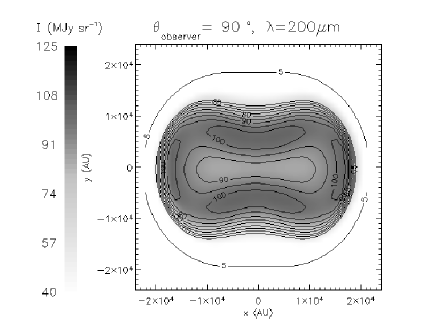
The SED of the slightly asymmetric core we examine, is the same at any viewing angle, because the core is optically thin to the radiation it emits (FIR and longer wavelengths). However, the isophotal maps do depend on the observer’s viewing angle. Additionally, they depend on the wavelength of observation. Phaethon calculates images at any wavelength, and therefore provides a useful tool for direct comparison with observations, e.g. at MIR (ISOCAM), FIR (ISOPHOT) and submm/mm (SCUBA, IRAM) wavelengths. We focus on wavelengths near the peak of the core emission (150-250 m; we choose 200 m as a representative wavelength). At 200 m the core appearance depends both on its temperature and its column density in the observer’s direction. This interplay between core temperature and column density along the line of sight results in characteristic features on the images of the cores (see Fig. 2). Such features include (i) the two intensity minima at almost symmetric positions relative to the centre of the core, on the image at 30∘, and (ii) the two intensity maxima, again at symmetric positions relative to the centre of the core, on the image at 90∘.
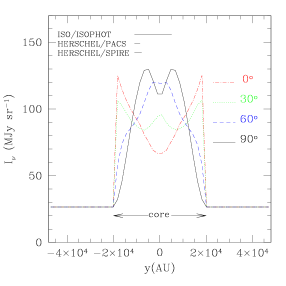
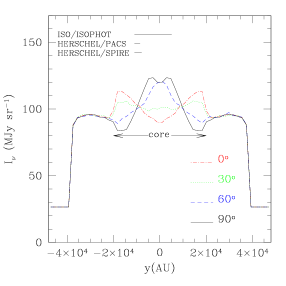
We conclude that isophotal maps at 200 m contain detailed information, and sensitive, high resolution observations at 200 m are helpful in constraining the core density and temperature structure and the orientation of the core with respect to the observer. In Fig. 3, left, we present a perpendicular cut (at ) of the core images shown in Fig. 2. We also plot the beam size of the ISOPHOT C-200 camera (90′′, or 9000 AU for a core at 100 pc) and the beam size of the upcoming (2007) Herschel (13′′or 1300 AU for the band of PACS; 17′′or 1700 AU for the band of SPIRE). ISOPHOT’s resolution is probably not good enough to detect the features mentioned above. Indeed, a search in the Kirk (2002) sample of ISOPHOT observations (also see Ward-Thompson et al. 2002) does not reveal any cores with such distinctive features. However, Herschel should, in principle, be able to detect such features in the future.
5 The effect of the parent cloud
Cores are generally embedded in molecular clouds, with visual optical depths ranging from 2-10 (e.g. in Taurus) up to 40 (e.g. in Oph). Due to the ambient cloud the radiation incident on a core embedded in the cloud is reduced in the UV and optical, and enhanced in the FIR and submm (Mathis et al. 1983). Previous radiative transfer calculations of spherical cores embedded at the centre of an ambient cloud (Stamatellos & Whitworth 2003), have shown that embedded cores are colder ( K) and that the temperature gradients inside these cores are smaller than in non-embedded cores.
Here, we examine the same core as before when it is embedded in a uniform density ambient cloud with different visual extinctions . The ambient cloud is illuminated by the interstellar radiation field. Relative to the non-embedded core, the core embedded in an ambient cloud with is colder and has lower temperature gradient (Fig. 3, centre). The isophotal maps are similar to those of the non-embedded core, but the characteristic features are less pronounced. This is because the temperature gradient inside the core is smaller when the core is embedded. In Fig. 3, right, we present a perpendicular cut through the centre of the embedded core image. It is evident that the features are quite weak, but they have the same size as in the non-embedded core (Fig. 3, left), and they should be detectable with Herschel, given an estimated rms sensitivity better than MJy sr-1 at 170-250 m.
Thus, continuum observations near the peak of the core emission can be used to obtain information about the core density and temperature structure and orientation, even if the core is very embedded ().
6 Application: Modelling L1544
We model L1544 (core distance ) using a slightly flattened density profile ( and ). Our goal is to fit the SCUBA 850 m image (Fig. 5, left), the SED data points (Fig. 5, right), and to calculate the temperature profile in the core. To fit the observational data we choose the asymmetry parameter , based on the 850 m image of the core. Then we vary the mass of the core (by adjusting the central core density and the core flattening radius), so as to fit the submm and mm SED data. Finally, we vary the extinction through the ambient cloud in order to fit the FIR SED data.
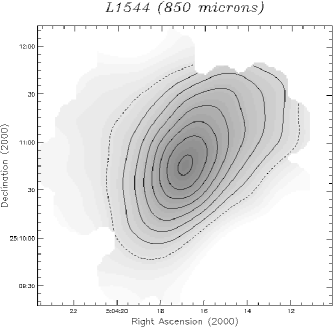

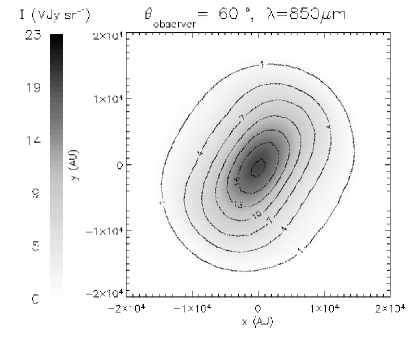

The best-fit model is obtained using central density , inner flattening radius , core extent , and an ambient cloud of visual extinction . These values are in good agreement with observations of L1544 (e.g. Ward-Thompson et al. 2002, Kirk et al. 2004). The calculated luminosity emitted from the core is L, in agreement with observations (Kirk 2002). The model fits the SED data very well (Fig. 5, right). The model also reproduces reasonably well the central region of the L1544 850 m map (cf. Figs 5 and 5, left). However, it does not reproduce the asymmetries in the outer parts of the core, which are signatures of triaxiality.
The temperature at the edge of the core is K and at the centre K (Fig. 5, left). The dust temperature we calculate with the model is lower by K than the temperature estimated by Kirk (2002) using FIR (90, 170 and 200 m) ISOPHOT observations ( K). However, ISO observations have difficulty distinguishing the core from the ambient cloud, and thus this larger temperature may be due to the presence of the hotter ambient cloud in the observing beam. As a result of overestimating the dust temperature, the core mass calculated by Kirk (2002) is underestimated. The core mass is (e.g. André et al. 1999), where is the flux at a submm or mm wavelength, and is the assumed dust opacity per unit mass. If the core temperature is overestimated by 2 K (10 K instead of 8 K) then using the 850 m flux the core mass is underestimated by a factor of 1.6 (). The core mass of the model is M which is similar to what Kirk et al. (2002) calculated (). However, we note that Kirk uses a dust opacity , which is smaller by a factor of 2 than the dust opacity we use (). Thus, to consistently compare the mass we need to divide the Kirk (2002) value by 2.
We conclude that accurate estimates of core temperatures are important when calculating core masses from submm and mm observations, since e.g. overestimating temperatures by even just 1-2 K can lead to underestimating core masses by a factor of 2.
7 Conclusions
Far-infrared continuum maps of prestellar cores reflect both the column density and temperature field along the line of sight, and thus contain complementary information to the mm continuum maps that mainly trace column density. The radiative transfer models presented here show that the effect of the combined dust temperature and column density along the line of sight is to produce characteristic features in the FIR intensity maps. These features are useful for constraining the conditions in prestellar cores, and are expected to be present in cores with high enough temperature gradients (2 K).
Acknowledgements
We acknowledge help from the EC Research Training Network “The Formation and Evolution of Young Stellar Clusters” (HPRN-CT-2000-00155). We also thank P. André for useful comments.
References
References
- [1] Alves, J., Lada, C. J., & Lada, E. A. 2001, Nature, 409, 159
- [2] André, P., Ward-Thompson, D., & Barsony, M. 2000, Protostars and Planets IV, 59
- [3] Ballesteros-Paredes, J., Klessen, R. S., & Vázquez-Semadeni, E. 2003, ApJ, 592, 188
- [4] Evans, N. J., Rawlings, J. M. C., Shirley, Y. L., & Mundy, L. G. 2001, ApJ, 557, 193
- [5] Gonçalves, J., Galli, D., & Walmsley, M. 2004, A&A, 415, 617
- [6] Goodwin, S. P., Ward-Thompson, D., & Whitworth, A. P., 2002, MNRAS, 330, 769
- [7] Kirk, J., Ph.D. Thesis, Cardiff University, 2002
- [8] Kirk, J., et al. 2004, in preparation
- [9] Plummer, H. C., 1915, MNRAS, 76, 107
- [10] Stamatellos, D. & Whitworth, A. P. 2003, A&A, 407, 941
- [11] Stamatellos, D. & Whitworth, A. P., André, P., Ward-Thompson 2003, A&A, in press
- [12] Ward-Thompson, D., André, P., & Kirk, J. M. 2002, MNRAS, 329, 257
- [13] Zucconi, A., Walmsley, C. M., & Galli, D. 2001, A&A, 376, 650