Observations of the X-ray Pulsar GX 301-2 with the ART-P Telescope of the Granat Observatory
Astronomy Letters, Vol. 30, No. 8, 2004, pp. 540 548. Translated from Pis’ma v Astronomicheskii Zhurnal, Vol. 30, No. 8, 2004, pp. 596 604. Original Russian Text Copyright © 2004 by Tsygankov, Lutovinov, Grebenev, Gilfanov, Sunyaev.
1 Space Research Institute, Russian Academy of Sciences,
Profsoyuznaya ul. 84/32, Moscow 117810, Russia
2 Max-Planck-Institut für Astrophysik, Karl-Schwarzschild-Str. 1,
Postfach 1317, D-85741 Garching, Germany
The variability of the X-ray flux from the pulsar GX 301-2 is analyzed by using data from the ART-P telescope of the Granat Observatory. The intensity variations with time scales of several thousand seconds are studied at various orbital phases. The high-state flux from the source exceeds its low-state flux by as much as a factor of 10. The hardness and spectrum of the source are shown to change greatly with its intensity. These intensity variations are most likely caused by substantial inhomogeneities in the stellar wind from the companion star.
© 2004 MAIK ”Nauka/Interperiodica”.
Key words: pulsars, neutron stars, X-ray sources.
∗ E-mail: aal@hea.iki.rssi.ru
INTRODUCTION
The X-ray pulsar GX 301-2, which forms a binary system with the blue supergiant Wray 977 with an eccentricity of 0.462 and an orbital period of 41.5 (Sato et al. 1986), is one of the longest-period pulsars known to date. Throughout the history of its observations, the spin period of this source has repeatedly underwent abrupt changes. In April 1984, the Tenma satellite measured the maximum pulsation period, 701.14 s (Sato et al. 1986), which decreased sharply to 677 s in 1992 (Lutovinov et al. 1994; Chichkov et al. 1995). At this point, however, the period of prolonged steady spin-up with a mean rate of -4.4 x 10⁻³ yr-1 ended, and the pulsation period stabilized at 679.5 s in November 1996 (Pravdo et al. 2001). On smaller time scales, the switches between spin-up and spin-down of the neutron star manifest themselves much more frequently (Chichkov et al. 1995; Koh et al. 1997). The X-ray flux recorded from the binary is variable during the orbital cycle. As the pulsar approaches the optical star, the X-ray luminosity of the binary increases and reaches its maximum 1.2 days before periastron passage (White et al. 1984). An increase in the intensity of the source is also observed near the apoastron (Chichkov et al. 1995; Koh et al. 1997).
Parkes et al. (1980) determined the parameters of the optical star (its radius and mass 30M⊙) and the distance to the binary system ( 1.8 kpc). Note that the precise spectral type of the companion star has not yet been firmly established. Some of the authors classify it as a B star (Vidal 1973; Kaper et al. 1995), while others (Parkes et al. 1980) classify it as an emission-line Be star. The normal star may occupy an intermediate position and occasionally switches over from one state to another.
At present, there is no agreement about the structure and distribution of the matter in the binary GX 301-2/Wray 977 either. Based on the very small changes in the characteristic values of these parameters with pulse phase, Tashiro et al. (1991) concluded that the distribution of the photoabsorbing and iron line emitting matter was spherically symmetric. On the other hand, having performed detailed phase-resolved spectroscopy, Leahy et al. (1990) concluded that the distribution of the matter around the neutron star was nonuniform. All authors point out a significant hydrogen column density reaching x cm-2.
In this paper, we present the results of a comprehensive analysis of the observational data for the pulsar GX 301-2 obtained with the ART-P telescope of the Granat orbital observatory, identifying two distinct (high and low) states in its light curve.
OBSERVATIONS
The X-ray pulsar GX 301-2 was observed by the Granat observatory from January 1991 through February 1992. Over this period, the ART-P telescope conducted four observing sessions for this source with a total useful time of ks (see Table 1).
The ART-P X-ray telescope consists of four coaxial, completely independent modules, each of which includes a position-sensitive detector with a geometrical area of cm2 and a coded mask. The telescope is sensitive to photons in the energy range 2.5-60 keV (the energy resolution is % in the -keV calibration iron line) and can image the sky within a 3436 field of view with a nominal angular resolution of arcmin (the angular size of the mask element). For a more detailed technical description of the telescope, see Sunyaev et al. (1990).
The observations were carried out in photon-by-photon mode in which the coordinates of each photon on the detector, its energy (1024 channels), and arrival time (the photon arrival time was accurate to within 3.9 ms, and the dead time was 580 s) were written into the ART-P buffer memory. This mode allows both timing and spectral analyses of the emission from each X-ray source within the ART-P field of view to be performed. Data were transferred to the main memory after the temporary buffer was filled (once in 200-250 s–the exposure time) during 25-30 s,which led to gaps in information.
All of the observations of the pulsar GX 301-2 were performed by the third ART-P module with a reduced sensitivity to soft (3-8 keV) energies. Subsequently, this complicated and, in several cases, did not allow a spectral analysis of the X-ray emission.
TIMING ANALYSIS
Our studies showed that the flux from GX 301-2 near the periastron and apoastron is highly variable. Two states, high and low, can be arbitrarily identified; the switches between them can occur several times during one observing session. Figure 1a shows the light curves of the pulsar for all four observing sessions. The hardness, which is defined as the ratio of the fluxes from the source in the energy ranges 30-40 and 10-20 keV, is given for each light curve (Fig. 1b).
We see from the figure that the switches of the source from the low state to the high state and back are rapid; its intensity during such switches changes by about an order of magnitude. At the same time, the hardness of the source during the switch to its high state decreases (by a factor of 3). Note that although the absolute stability of the low-state intensity is higher than that of the high-state intensity, as illustrated by Fig. 1, the fractional rms of these variations are close. Thus, the fractional rms during periastron passage changed from 21% to 34% in the low and high states, respectively; near the apoastron, its values were 25% and 35% for the low and high states, respectively. Near an orbital phase of 0.3, the fractional rms was 34%.
Table 1 gives the pulsation periods determined by a superposed-epoch analysis after the correction of the photon arrival time for the motion of the neutron star in the binary system and for the motion of the Earth and the spacecraft. Throughout our observations (about 13 months), the period decreased by 6 s, which corresponds to a mean value of yr-1.
Table 1. ART-P observations of the pulsar GX 301-2 during 1991-1992
| Date | Orbital phase | Exposure time, s | Flux, mCrab | , erg s-1 | Period, s |
|---|---|---|---|---|---|
| 09.01.91 | 0.03-0.04 | 23584 | |||
| (I) | 2835 | ||||
| (II) | 6126 | ||||
| (III) | 7067 | ||||
| (IV) | 7556 | ||||
| 13.08.91 | 0.23-0.24 | 33346 | – | – | |
| 29.01.92 | 0.31 | 11376 | |||
| 07.02.92 | 0.52-0.53 | 28540 | |||
| (I) | 986 | ||||
| (II) | 13965 | ||||
| (III) | 13589 |
| In the energy range 6-40 keV. | |
| For the assumed distance to the source of kpc. | |
| For technical reasons, the spectrum of the source cannot be reconstructed. |
We analyzed the behavior of the pulse profile and the pulse fraction for the source as a function of its state and the energy range. Figure 2 shows the phase light curves of the pulsar averaged over each of the sessions in five energy ranges (3-6, 6-10, 10- 20, 20-30, and 30-40 keV). The pulse profile has a double-peaked shape with a slight dominance of the first peak; the intensity of the second peak increases relative to the first peak as the energy increases. During the source’s switches from one state to the other, the pulse shape remains virtually unchanged, only the intensity of the emission changes.
The pulse fraction, which is defined as , where and are the background-corrected count rates at the maximum and minimum of the pulse profile, is given in Table 2 for all observing sessions in various energy ranges (6-10, 10-20, 20-30, 30-40, and 6-40 keV) as a function of the source’s state. In view of the technical peculiarities of the third module described above, the pulse fraction in the energy range 3-6 keV was not calculated.
It follows from the table that the pulse fraction remains fairly high and weakly depends on the energy range and the source’s intensity, although the pulsations in the energy range 30-40 keV are slightly blurred and the pulse fraction slightly decreases in the energy range 10-20 keV. As the source passed through the apoastron (February 7, 1992), its pulsations completely disappeared when it was in the low state. For this case, the table gives only upper limits on the pulse fraction.
Table 2. Pulse fractions for GX301-2.
| Date | Pulse fraction, % | ||||
|---|---|---|---|---|---|
| 6-10 keV | 10-20 keV | 20-30 keV | 30-40 keV | 6-40 keV | |
| 09.01.91 | |||||
| I | — | — | — | — | — |
| II | |||||
| III | |||||
| IV | |||||
| 13.08.91 | |||||
| 29.01.02 | — | — | |||
| 07.02.92 | |||||
| I | — | — | — | — | — |
| II | |||||
| III | |||||
| Cannot be determined because of poor statistics. | |
| Cannot be determined for technical reasons. | |
| The upper limit. |
SPECTRAL ANALYSIS
To study the properties of the pulsar GX 301-2 in detail, we performed a spectral analysis of its emission in different states. The main model used in our analysis was a simple power law, which is most characteristic of X-ray pulsars at energies up to 10-15 keV. However, we did not always use this simple model. As required, we used various modifications of the model that were specified in general form by the equation
| (1) |
where is the photon energy in keV, is the normalization of the power-law component to 10 keV, is the photon spectral index, is the cutoff energy, is the e-folding energy in the source’s spectrum, is the hydrogen column density, and is the interstellar absorption cross section.
This model includes both the low-energy cutoff attributable to photoabsorption and the purely empirical multiplicative component that is commonly used to describe the spectra of X-ray pulsars, the high-energy cutoff (White et al. 1983). Formally, photoabsorption was recorded only in one session on January 9, 1991, when the source was in the low state. In this case, the hydrogen column density was cm-2. Such a high value agrees well with the results by Haberl (1991), who performed a detailed analysis of the photoabsorption at various orbital phases. We failed to perform a more detailed analysis of this parameter due to the technical problems of the third ART-P module discussed above and obtained only upper limits for the remaining observing sessions (see Table 3).
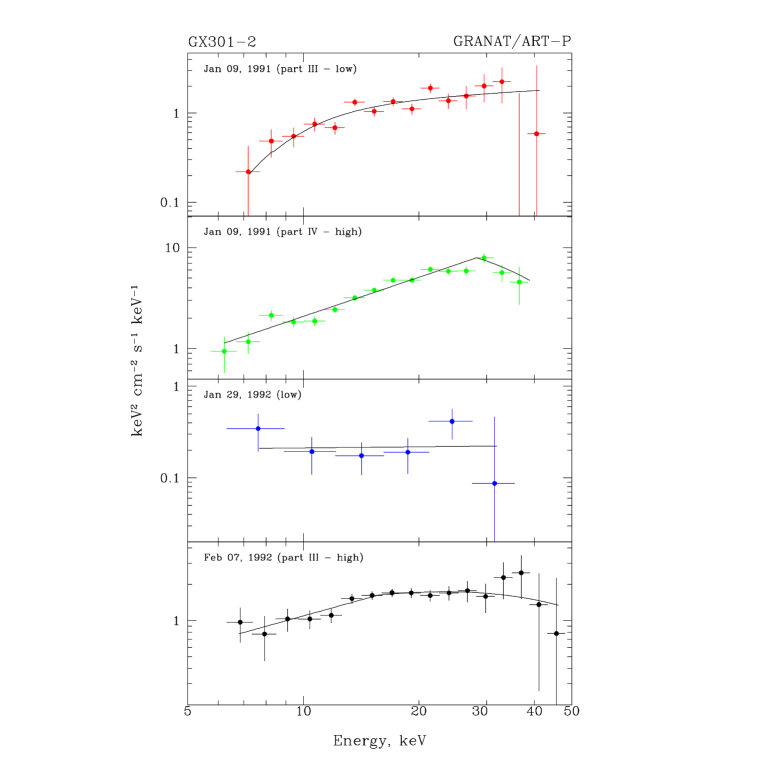
Based on the test, we passed to a more complex model. The model was assumed to be acceptable if the probability that the value did not improve by chance exceeded 95%. Table 3 gives the best-fit parameters for the pulsar’s spectra averaged over the period of the observing session under consideration that corresponded a certain state of the source.
As we see from Table 3, the high-state spectrum of the source is slightly softer than its low-state spectrum. The cutoff energy as well as the e-folding energy remain constant, within the error limits, and are in good agreement with the results of other authors (Leahy et al. 1990). However, they show up only in the high state, which may be attributable to poor statistics when analyzing the emission from the source in its low state. Figure 3 shows how the energy spectrum changes with the source’s state.
Table 3. Best-fit parameters for the spectrum of GX301-2
| Date | cm-2 | |||||
|---|---|---|---|---|---|---|
| 09.01.91 | ||||||
| (I) | 1.11(7) | |||||
| (II) | 1.19(17) | |||||
| (III) | 1.73 (15) | |||||
| (IV) | 2.72(13) | |||||
| 29.01.92 | 0.21(5) | |||||
| 07.02.92 | ||||||
| (I) | 0.90(8) | |||||
| (II) | 1.18(8) | |||||
| (III) | 0.79(16) |
| All errors are given at the 1 level. | |
| The flux at 10 keV (phot.cm-2s-1keV-1). | |
| The value normalized to the number of degrees of freedom . | |
| The upper limit on the atomic hydrogen column density. |
DISCUSSION
Despite the abundance of observational data, the precise accretion pattern in the binary system GX 301-2/Wray 977 that would account for the nature of its X-ray emission is not yet completely clear. The source exhibits variable emission, it behaves in a new fashion from orbit to orbit, and the intensity peaks and minima shift, occasionally replacing one another (except for the peaks near the periastron and apoastron, although their intensities also vary significantly).
Several models of the interaction of a compact object with interstellar matter in a binary system were suggested to interpret the observational data. Pravdo et al. (1995) showed that the periodic outbursts were difficult to explain only by isotropic accretion from the stellar wind and explained this behavior of the source either by the interaction of the neutron star with an equatorially enhanced stellar wind typical for stars or by the formation of an accretion disk around the neutron star, which may also be a source of angular momentum, causing it to spin up. Leahy et al. (2002) presented the results of a long-term monitoring of GX 301-2 and considered several possible models for the generation of emission, with the wind+stream model yielding the best fit to the experimental data.
The hydrodynamic simulations of a nonaxisymmetric gas stream in the binary system GX 301- 2/Wray 977 by Taam and Fryxell (1989) revealed significant aperiodic luminosity fluctuations (with a factor as large as 10) on time scales of the order of several thousand seconds. Tashiro et al. (1991) studied the aperiodic intensity variations of GX 301-2 that could be the result of plasma turbulence near the neutron-star surface and that manifest themselves on time scales up to several tens of seconds.
The intensity variations considered here are also aperiodic in pattern and are observed on time scales from several tens of seconds to several hours (see Fig. 1). The observed intensity fluctuations of the source under study on short time scales are most likely attributable to local inhomogeneities in the stellar wind, its clumpy structure. Of particular interest is the observing session near the apoastron on February 7, 1992, when a prolonged decrease in the intensity of the source and the disappearance of pulsations were recorded (part II of the last light curve in Fig. 1).
A plausible explanation of the observed intensity decrease is the eclipse of the neutron star by a substantial inhomogeneity in the stellar wind on the line of sight between the observer and the object. Let us attempt to estimate its characteristic parameters. Following Castor et al. (1975), we can write
| (2) |
where is the terminal velocity of the stellar wind, is the radius of the optical companion, and . Assuming the characteristic time the source stays in its low state to be 10 ks and the range of possible wind terminal velocities to be from km s-1 (Kaper et al. 1995) to 1000 km s-1 (Parkes et al. 1980), we obtain the size of the inhomogeneity from formula (2). In our case, the terminal velocity of the stellar wind was calculated near the apoastron, which corresponds to a distance of 5 from the optical companion (Sato et al. 1986). Since the orbital velocity of the neutron star, 100 km s-1, is low compared to the terminal velocity of the wind, we disregarded it. Note that the source switches to and from its low state not abruptly, but over several (4-5) exposures (Fig. 1); i.e., the duration of this switch is 800–1000 s. Thus, the boundaries of the inhomogeneity are slightly blurred and are 15–20% of its total size.
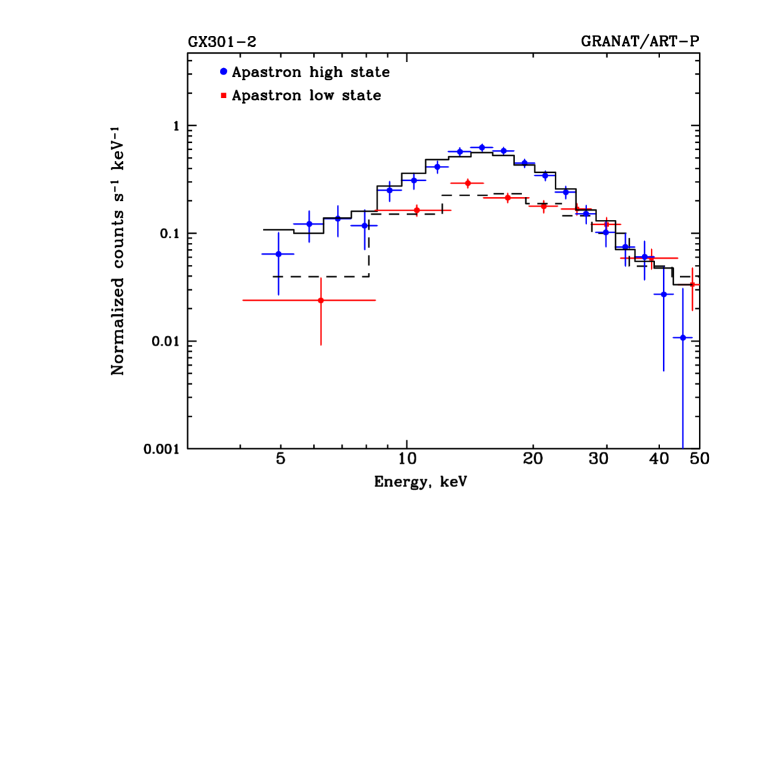
Figure 4 shows the pulse-height spectra of the pulsar GX 301-2 obtained for its low and high states during the observations on February 7, 1992. The normalization of the low-state spectrum was multiplied by a factor of 2.6 to match it to the high-state spectrum at energies above 25 keV, where these spectra have approximately the same shape. We see that the low-state spectrum in softer energy channels exhibits a cutoff. Taking into account this spectral feature attributable to photoabsorption, we can estimate the atomic hydrogen column density at the time in question, atoms cm-2. Assuming the size of the inhomogeneity to be , we determined its electron density, cm-3.
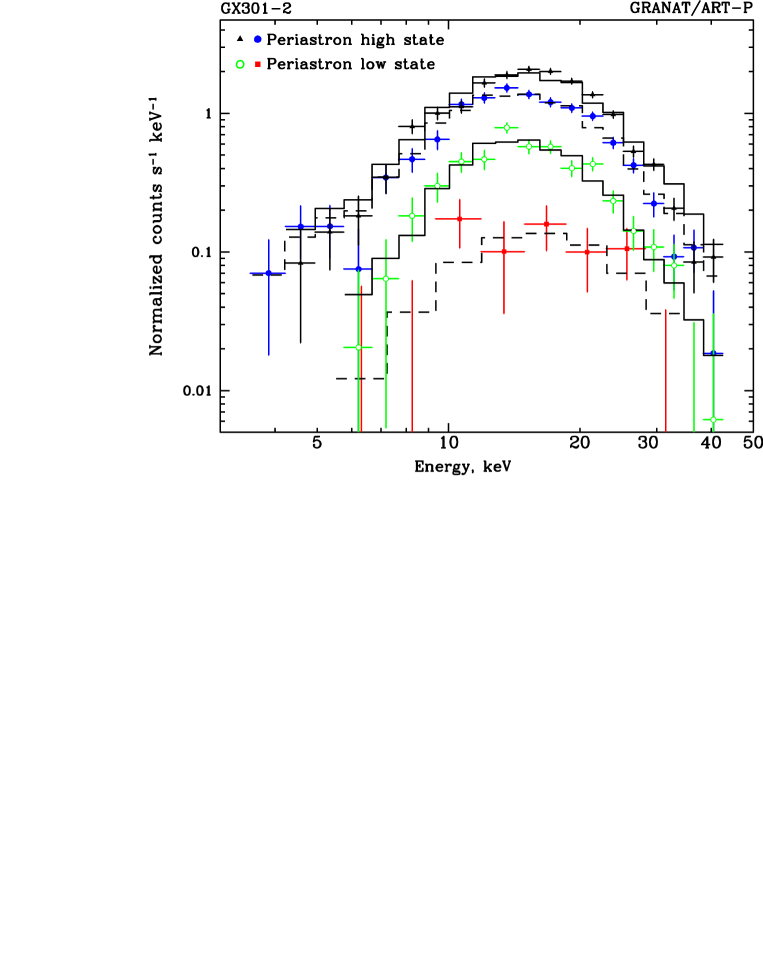
For comparison, Fig. 5 shows the pulse-height profiles of the pulsar GX 301-2 at orbital phase 0.03– 0.04 near the periastron. We see that the shape of the spectra is almost constant and does not depend on the flux. Only their normalization changes, which is indicative of the absence of enhanced (additional) photoabsorption in the low state (although the upper limits given in Table 3 are significant, which is most likely due to the shortage of data in the soft spectral range).
The dipping in the source’s spectrum at high energies observed at the apoastron may be attributable to Thomson scattering. The intensity ratio of 2.6 (see above) implies that the scattering optical depth of the condensation under consideration is 1. The corresponding electron density of the inhomogeneity is cm-3 ( is the Thomson scattering cross section) at a size of , which is in agreement with the above densities of the cloud estimated from the observed absorption at low energies.
Based on a model with an equatorially enhanced stellar wind, Waters et al. (1988) showed for several X-ray binary systems with stars that its density around such stars varies as
| (3) |
where is the gas density near the surface of the optical star, is the distance from the star, and is a parameter equal to 3 for most of the stars under consideration.
Using the values of from the same paper ( g cm-3) and formula (3), we obtain the mean density of the stellar wind in the equatorial disk around the optical companion near the apoastron, g cm-3, which corresponds to an electron density of cm-3.
Our estimates indicate that the inhomogeneities of the scale under consideration are denser than the average equatorial stellar wind characteristic of stars of this spectral type by a factor of about 40-50.
Note that the disappearance of pulsations is rather difficult to explain in terms of our simple model in which the neutron star is eclipsed by an inhomogeneity in the stellar wind with an optical depth . Following Mendoz and van der Klis (2000), we can roughly estimate the optical depth of a cloud with a size of required to decrease the pulse fraction by a factor of 3 (see Table 2), . The derived spread in optical depths may be attributable to poor statistics when searching for pulsations and determining the pulse fraction in the low state (particularly in soft energy channels).
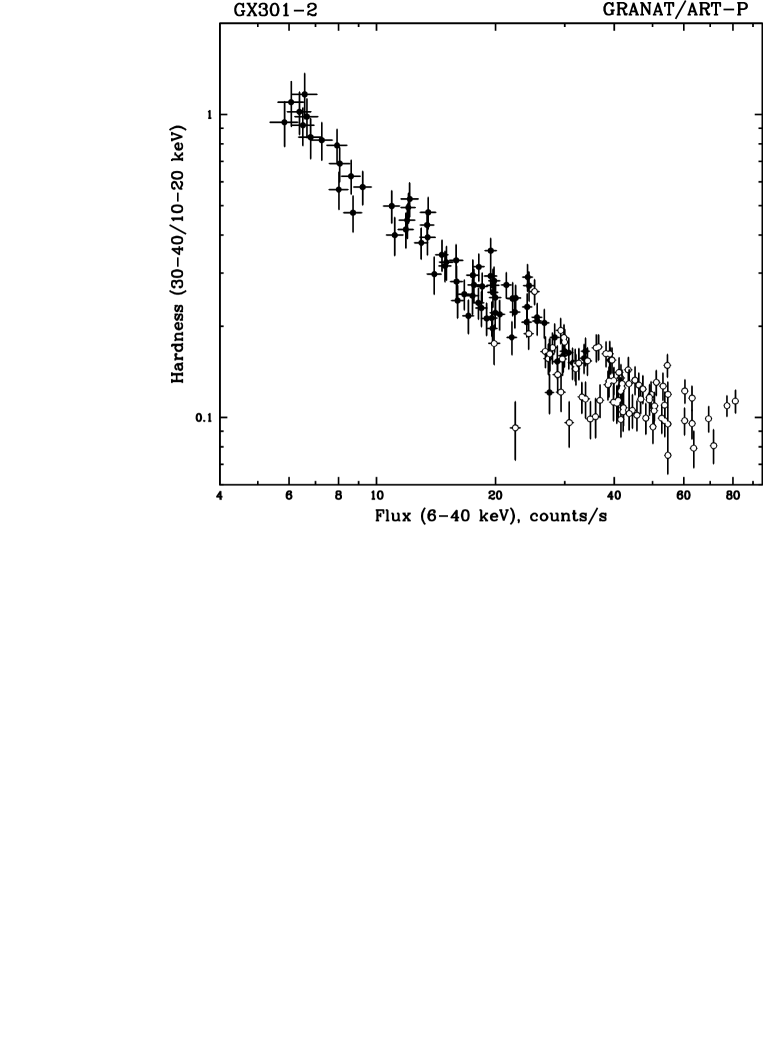
In conclusion, we present the following interesting fact: the hardness of the source during periastron and apoastron passage is proportional to its intensity (Fig. 6) and can be formally described by the relation , where is the hardness, and is the flux from the source in mCrab. For the apoastron, this dependence is stronger (, filled circles) than it is for the periastron (, open circles).
ACKNOWLEDGMENTS
This study was supported by the Russian Foundation for Basic Research (projects no. 02-02-17347 and 04-02-17276) and the Nonstationary Phenomena in Astronomy Program. We wish to thank K.G. Sukhanov, flight director, the staffs of the Lavochkin Research and Production Center, RNIIKP, and the Deep Space Communications Center in Evpatoria, the Evpatoria team of the Space Research Institute (Russian Academy of Sciences), the team of I.D. Tserenin, and B.S. Novikov, S.V. Blagii, A.N. Bogomolov, V.I. Evgenov, N.G. Khavenson, and A.V. D’yachkov from the Space Research Institute who operated the Granat observatory, provided the scientific planning of the mission, and performed a preliminary telemetry data processing. We also wish to thank the team of M.N. Pavlinsky (Space Research Institute) and the staff of the former Research and Development Center of the Space Research Institute in Bishkek who designed and manufactured the ART-P telescope.
REFERENCES
1. Castor J.I., Abbott D.C., Klein R.I., Astrophys. J. 195, 157 (1975).
2. Chichikiv M.A., Sunyaev R.A., Lapshov I.Yu. et al., Astronomy Letters 21, 435 (1995).
3. Haberl F., Astrophys. J. 376, 245 (1991).
4. Kaper L., Lamers H.J.G.L.M., Ruymaerkers E. et al., Astron. Astrophys. 300, 446 (1995).
5. Koh D., Bildsten L., Chakrabarty D. et al., Astrophys. J. 479, 993 (1997).
6. Leahy D.A., Matsuoka M., Adv. Space Res. 10, (2)95 (1990).
7. Leahy D.A., Astron. Astrophys. 391, 219 (2002).
8. Lutovinov A.A., Grebenv S.A., Sunyaev R.A.et al., Astronomy Letters 20, 538 (1994).
9. Melatos A., Johnston S., Melrose D.B., Mon. Not. Roy. Astron. Soc. 275, 381 (1995).
10. Mendoz M., van der Klis M., Mon. Not. Roy. Astron. Soc. 318, 938 (2000).
11. Parkes G.E., Mason K.O., Murdin P.G. et al., Mon. Not. Roy. Astron. Soc. 191, 547 (1980).
12. Pravdo S.H., Day C.S.R., Angelini L. et al., Astrophys. J. 454, 872 (1995).
13. Pravdo S.H., Ghosh P., Astrophys. J. 554, 383 (2001).
14. Sato N., Nagase F., Kawai N. et al., Astrophys. J. 304, 241 (1986).
15. Sunyaev R.A., Babichenko S.I., Goganov D.A. et al., Adv. Space Res. 10, (2)233 (1990).
16. Taam R.E., Fryxell B.A., Astrophys. J. 339, 297 (1989).
17. Tashiro M., Makishima K., Ohashi T. et al., Mon. Not. Roy. Astron. Soc. 252, 156 (1991).
18. Vidal N.V., Astrophys. J. 186, 81 (1973).
19. Waters L.B.F.M., Taylor A.R., van den Heuvel E.P.J. et al., Astron. Astrophys. 198, 200 (1988).
20. White N., Swank J., Holt S., Astrophys. J. 270, 771 (1983).
21. White N.E., Swank J.H., Astrophys. J. 287, 856 (1984).