The HI Parkes Deep Zone of Avoidance Survey
Abstract
The 64-m Parkes telescope, equipped with the 21-cm multibeam receiver, has completed a sensitive survey (typically 6 mJy beam-1 rms) for HI galaxies in the Zone of Avoidance (ZOA) accessible to the telescope, , and 5∘. While galaxy candidate inspection is not yet quite complete, and final number not yet determined, the survey has yielded about 1000 galaxies. The data, in the form of three-dimensional datacubes, have been inspected by eye, and candidate lists assembled, and about half have now been checked for reality, and accepted into the final catalog. The distributions on the sky and in redshift space are presented, showing galaxies belonging to previously-known structures, and newly-discovered features. Of the 469 confirmed HI galaxies, 191 have a NIR source within in the 2MASS Extended Source Catalog, but the incidence of NIR counterparts is a strong function of longitude: in the low obscuration, low stellar surface density Puppis region, 131 of the 186 HI galaxies have 2MASS counterparts (70%), while in the Galactic bulge region, only 6 of the 155 HI detections have a 2MASS extended source coincident (4%). This is attributable to the HI survey’s ability to detect galaxies even in regions of high foreground stellar surface density.
Institute for Astrophysics, University of New Mexico, 800 Yale Blvd., NE, Albuquerque, NM, 87131, USA
Depto. de Astronomía, Universidad de Guanajuato, Apdo. Postal 144, Guanajuato, GTO 36000, México
Australia Telescope National Facility, CSIRO, P. O. Box 76, Epping, NSW 1710, Australia
1. Why a 21-cm Survey?
Dedicated searches for galaxies and clusters have been successful in recent years in narrowing the ZOA, and obtaining redshifts, where possible, to map three dimensional large-scale structures at low Galactic latitude (see Kraan-Korteweg & Lahav 2000 for an overview of the various multiwavelength campaigns in the ZOA, and the many contributions in this volume.) Results from the 2 Micron All-Sky Survey (2MASS) have produced an impressive narrowing of the ZOA, particularly away from the Galactic bulge region, and allowed appreciation of low-latitude large-scale structure traced by a homogeneous sample (see contribution from Huchra in this volume.) However, such methods fail in regions of heaviest obscuration, and highest foreground stellar surface density. Fortunately, 21-cm searches for HI-bearing galaxies have been proven to succeed in obscured and confused areas (eg. Kerr & Henning 1987; Kraan-Korteweg et al. 1994; Henning et al. 1998; Henning et al. 2000.)
2. The Survey
2.1. Parameters and Strategy
The multibeam receiver system on the Parkes 64-m telescope, with its large footprint on the sky, allows a sensitive, wide area survey. The ZOA accessible from Parkes, covering , 5∘, was observed to quite uniform sensitivity, due to the strategy of observing overlapping strips of constant Galactic latitude (Staveley-Smith et al. 1998; Henning et al. 2000; Donley et al. 2004). The data were bandpass-corrected, Doppler corrected, calibrated and gridded with resulting pixel and beam sizes of , and , respectively. The observations were done over 27 fields of (). The effective integration time per beam was 2100 s [compare with 450 s per beam integration time of the HI Parkes All Sky Survey (HIPASS; Meyer et al. 2004)]. The correlator bandwidth of 64 MHz, set to cover the velocity range to 12700 km s-1, provides coverage in the third dimension, thus we speak of the datacubes, three-dimensional position-position-velocity representations of the survey data.
Because of the strong HI signal of the Galaxy, which causes spectral ringing, the data were Hanning smoothed, resulting in a velocity resolution of 27.0 km s-1, a significant increase over the channel spacing of 13.2 km s-1. Strong continuum emission was subtracted, although some residual continuum baseline ripple remains where there was particularly strong continuum emission.
2.2. Survey Sensitivity
Over most of the volume surveyed, away from small regions of strong continuum, the noise was about 6 mJy beam-1 rms, which compares favorably to the HIPASS noise of 13 mJy beam-1. This noise of 6 mJy beam-1 is equivalent to a 5 HI mass detection limit of d M⊙ (for a galaxy with a linewidth of 200 km s-1). For instance, the survey was sensitive to galaxies with M⊙ at 60 Mpc, and M⊙ at 100 Mpc. Thus, the survey was sensitive to normal spirals well beyond the Great Attractor region, and could detect some galaxies beyond 10,000 km s-1. It was also sensitive to very low mass local dwarfs, as well.
2.3. Searching for Galaxies
The 27 datacubes were searched by members of the HI Parkes ZOA
Team. The cubes were searched by eye, because experimentation with
automatic galaxy detection algorithms
indicated that in the complicated region of the ZOA, with regions of
increased noise due to continuum sources and Galactic HI, the human
eye-brain system is enormously more effective at finding galaxies.
Each cube was searched by two, or sometimes three, independent
searchers, using the visualization tool karma KVIEW (Gooch 1995),
producing independent lists of galaxy candidates.
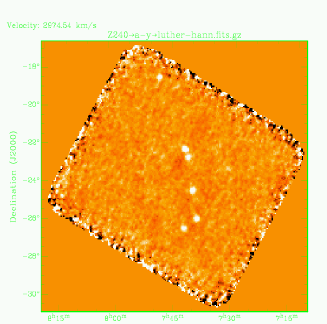
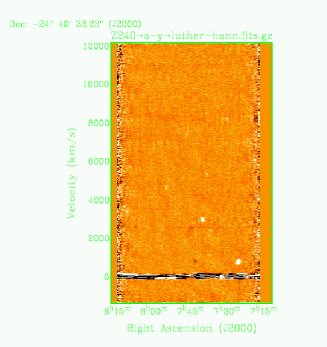
Figure 1 shows two slices through one of the datacubes, as a searcher
would display and search the data.
While the entire velocity
range of the data was searched, confusion due to Galactic HI generally
prevented the recognition of galaxies within about km s-1.
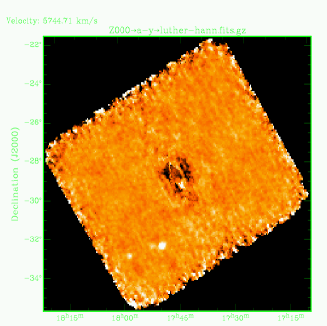
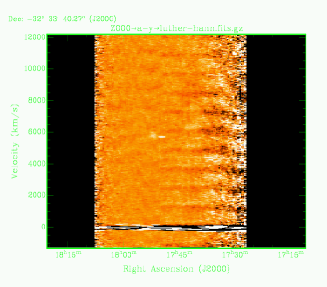
In addition, the higher noise at low latitudes near the Galactic Center
creates a residual ZOA, but even quite close to the Galactic Center direction
we were able to detect galaxies (Fig. 2).
The datacubes have all been searched, and a list of over 1000 galaxy candidates has been produced. To generate a uniformly-selected catalog, all galaxy candidates will be inspected by one person (PAH), who decides if a candidate is to be included in the final catalog. As of writing (June 2004), 16 of the 27 cubes have been inspected by the adjudicator, with 469 candidates accepted. The adjudication is complete over the longitude ranges of to , to , and other isolated longitudes. In the regions to and to (the “northern extension”), the data are presented by Donley et al. (2004).
3. Distribution of the Detected Galaxies and Candidates
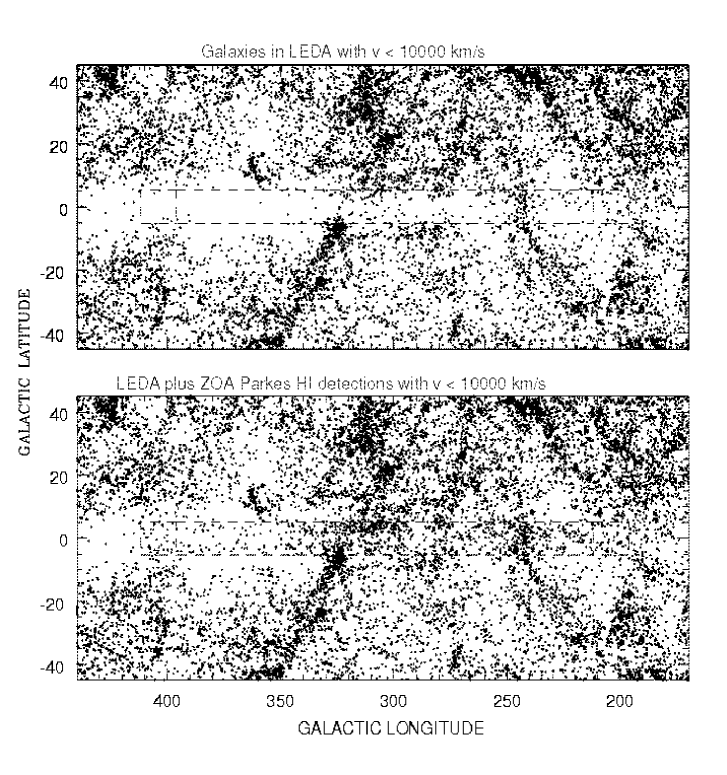
In Figure 3, the upper panel shows the distribution of galaxies in the literature (selected from the LEDA database), and the outline of our survey region in the ZOA. The traditional ZOA is clearly visible as a paucity of galaxies at low Galactic latitude. In the lower panel, with our confirmed galaxies and candidates added in, the ZOA fills in remarkably well, and several large-scale structures are seen to cross the Galactic Plane. The Great Attractor region is seen as an overdensity at , the Hydra-Antlia filament at and the Puppis filament crosses at . The Local and Sagittarius voids are visible as an underdensity of galaxies at .
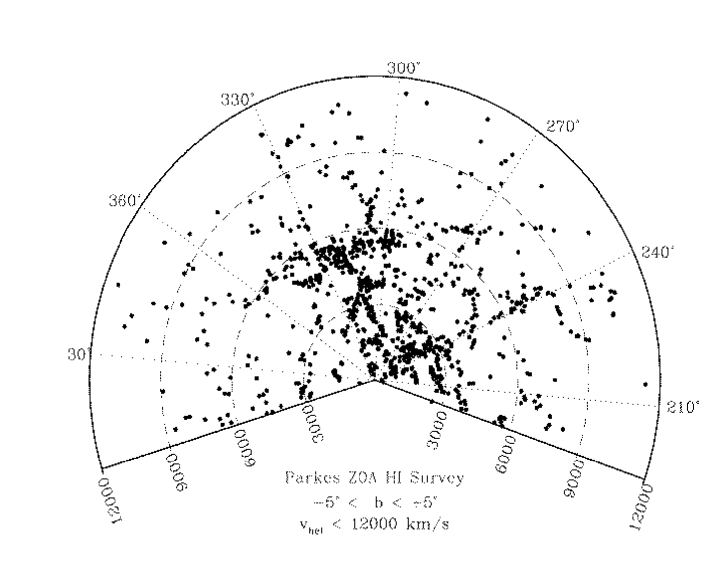
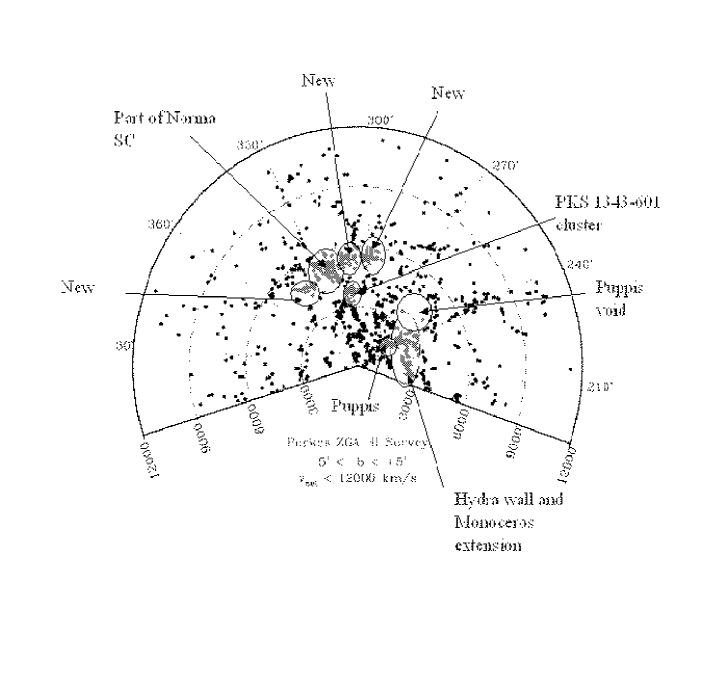
In velocity space, as shown in Figure 4, quite a number of structures become apparent. The broad overdensity of the Great Attractor is evident at velocity km s-1. Only a portion of this feature was known from higher-latitude catalogs, and is labelled as part of the Norma supercluster in Figure 5. Galaxies associated with the PKS 1343-601 cluster are also labelled in Figure 5, as is the Puppis cluster, and background void. The filament hinted at, at in Figure 3 becomes clear in the wedge diagram, which we label “Hydra wall and Monoceros extension” in Figure 5.
4. 2MASS Counterparts
Of the 469 confirmed HI galaxies (most others will certainly be real, but the adjudication is not yet complete), there are 191 for which there is a NIR source listed within 6′in the 2MASS Extended Source Catalog. We have not yet examined these NIR sources to check if they are all galaxian, or if some are confused Galactic objects, quite possible at low latitudes. In the longitude range to , there are 186 HI detections, 131 of which have an extended 2MASS counterpart (70%). As we continue to study the HI-selected galaxies, we can investigate the populations of ZOA galaxies uncovered at 21 cm vs. at NIR wavelengths. One would expect the HI galaxies to be generally of later type, but this will be quantified better in the future.
In contrast, in the Galactic bulge region, to , only 6 of the 155 HI detections have a 2MASS extended source within 6′of the HI (4%). The poor performance of the NIR survey in recovering the HI-selected galaxies is due to the extreme stellar confusion in the Galactic bulge. The completeness of the 2MASS survey is a function of stellar survey density, and drops even as far as from the Galactic Center near the Galactic plane.
5. Ongoing Work
To produce the final catalog of the HI Parkes Deep ZOA Survey, we are working to finish the adjudication of candidates. We then will measure HI parameters, and quantify the selection function a posteriori, since this sample has been selected by human eyes. When the full sample is constructed, its HI properties, large-scale structures traced, and NIR counterparts will be investigated. We are also extending the search region with new observations to higher latitudes in the Galactic bulge area, since there the ZOA extends further than from the plane (see Fig. 3.) Finally, we are exploring the possibility of using the new 21-cm multibeam receiver at the Arecibo Observatory to extend our map of hidden HI galaxies and large-scale structures further to the north.
Acknowledgments.
We very warmly thank the other ZOA cube searchers (J. Donley, A. J. Green, S. Juraszek, B. S. Koribalski, E. M. Sadler, I. Stewart, and A. Schröder) and other participants in the survey. This research used the Lyon-Meudon Extragalactic Database (LEDA), supplied by the LEDA team at the Centre de Recherche Astronomique de Lyon, Obs. de Lyon. We also made use of the NASA/IPAC Extragalactic Database, which is operated by the Jet Propulsion Laboratory, California Institute of Technology, under contract with the National Aeronautics and Space Administration. PAH is grateful for the support of the American Astronomical Society and the National Science Foundation in the form of an International Travel Grant, which enabled her to attend this conference. RCKK thanks CONACyT for their support (research grants 27602E and 40094F). Finally, we thank our Cape Town hosts, Prof. Anthony Fairall and Dr. Patrick Woudt for creating a wonderful atmosphere at the conference for science, and for showing us beautiful Cape Town and the Peninsula.
References
Donley, J.L., Staveley-Smith, L., Kraan-Korteweg, R.C. et al. AJ, submitted
Gooch, R.E. 1995, in ASP Conf. Ser. 101, Astronomical Data Analysis Software and Systems V, ed. G.H. Jacoby & J. Barnes (San Francisco: ASP), 80
Henning, P.A., Kraan-Korteweg, R.C., Rivers, A.J. et al. 1998, AJ,115, 584
Henning, P.A., Staveley-Smith, L., Ekers, R.D. et al. 2000, AJ, 119, 2686
Kerr, F.J., & Henning, P.A. 1987, ApJ, 320, L99
Kraan-Korteweg, R.C., Loan, A.J., Burton, W.B. et al. 1994, Nat, 372, 77
Kraan-Korteweg, R.C., & Lahav, O. 2000, A&ARv, 10, 211
Kraan-Korteweg, R.C., Staveley-Smith, L., Donley, J., & Henning, P.A. in IAU Symp. 216, Maps of the Cosmos, eds. Matthew Colless & Lister Staveley-Smith, (San Francisco: ASP), in press (astro-ph/0311129)
Meyer, M.J., Zwaan, M.A., Webster, R.L. et al. MNRAS, 350, 1195
Staveley-Smith, L., Juraszek, S., Koribalski, B.S. et al. 1998, AJ, 116, 2717