The ACS Virgo Cluster Survey II. Data Reduction Procedures11affiliation: Based on observations with the NASA/ESA Hubble Space Telescope obtained at the Space Telescope Science Institute, which is operated by the Association of Universities for Research in Astronomy, Inc., under NASA contract NAS 5-26555
Abstract
The ACS Virgo Cluster Survey is a large program to carry out multi-color imaging of 100 early-type members of the Virgo Cluster using the Advanced Camera for Surveys (ACS) on the Hubble Space Telescope. Deep F475W and F850LP images ( SDSS and ) are being used to study the central regions of the program galaxies, their globular cluster systems, and the three-dimensional structure of Virgo itself. In this paper, we describe in detail the data reduction procedures used for the survey, including image registration, drizzling strategies, the computation of weight images, object detection, the identification of globular cluster candidates, and the measurement of their photometric and structural parameters.
1 Introduction
The Virgo Cluster is the largest concentration of early-type galaxies in the Local Supercluster. As such, it has played a central role in understanding how these galaxies form and evolve in dense environments, providing invaluable information on the extragalactic distance scale, the nature of galactic nuclei, globular cluster systems, and the shape and universality of the galactic luminosity function. Indeed, the population of early-type Virgo galaxies has been the target of several thousand observations with the Hubble Space Telescope (HST) since its launch in 1990.
In the eleventh HST observing cycle, we initiated the ACS Virgo Cluster Survey (Côté et al. 2004; hereafter Paper I), a program to acquire F475W ( SDSS ) and F850LP ( SDSS ) images for 100 early-type members of Virgo using the Advanced Camera for Surveys (ACS; Ford et al. 1998). Paper I of this series describes the survey itself, including a brief overview of the scientific goals, the selection of the program galaxies and their ensemble properties, the choice of filters, the field placement and orientation, and the anticipated sensitivity limits.
It is the aim of the ACS Virgo Cluster Survey to use a single, homogeneous dataset to measure surface brightness fluctuation (SBF) distances, study the globular cluster systems, and examine the central structure of 100 early-type members of the Virgo Cluster. Both the scope of the survey — consisting of 500 ACS images spread over 100 separate fields — and its multiple scientific goals require an automated and flexible data reduction procedure. In this paper, we describe the pipeline used in the reduction and analysis of the ACS imaging for this survey. As discussed in Paper I, the ACS Virgo Cluster Survey also includes a substantial coordinated parallel component, consisting of WFPC2 imaging for 100 “intergalactic” fields in Virgo; a complete discussion of the reduction and analysis of these parallel data will be given in a separate paper. Similarly, future papers in this series will present additional details on the isophotal, globular cluster and SBF analyses.
2 Data Reduction Procedures
2.1 Observations
The program (GO-9401) consists of ACS imaging for 100 confirmed members of the Virgo Cluster having morphological types E, S0, dE, dE,N or dS0. The program galaxies span a factor of 450 in blue luminosity: i.e., . The 21 brightest program galaxies constitute a complete sample of Virgo galaxies brighter than , while the full sample includes nearly half of all early-type members of Virgo with .
Observations for each program galaxy were carried out within a single orbit with HST, using the ACS Wide Field Channel (WFC). This camera consists of two butted 20484096 CCD detectors (15m pixels) having spectral response in the range 0.35–1.05m. With a scale of 0.049 arcsec per pixel, the camera has a 202 field of view. The center of each galaxy was positioned near the WFC aperture, at pixel position (2096, 200) on the WFC1 detector, and then offset perpendicular to the gap between the WFC1 and WFC2 detectors. For the 12 brightest galaxies, this offset was 10′′. An offset of 5′′ was applied to the remaining galaxies.
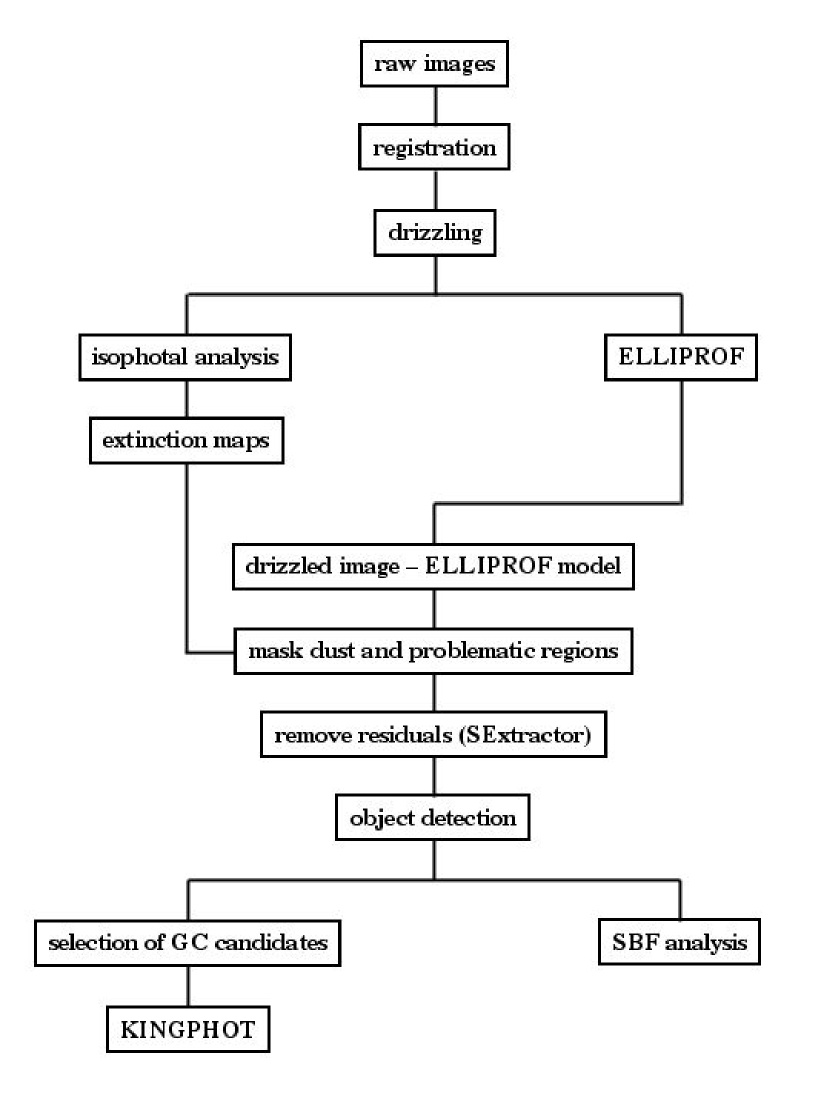
An identical observing sequence was adopted for each galaxy: , two 375 sec exposures in the F475W filter (750 sec in total), two 560 sec exposures in the F850LP filter, and a single 90 sec exposure in F850LP (1210 sec in total). For several of the program galaxies, the central surface brightness in the redder bandpass can approach mag arcsec-2, so this 90 sec F850LP exposure was required to repair nuclei saturated in the deep F850LP images. The entire dataset for each galaxy therefore consists of an identical set of five images, which were reduced and analyzed as described below. These reduction procedures are summarized in schematic form by the flowchart shown in Figure 1.
Table 1 gives the observing log for all ACS observations related to program GO-9401. From left to right, the columns of this table record the identification number of each program galaxy, the Virgo Cluster Catalog number from Binggeli, Sandage & Tammann (1985), the universal date of start of the observation, the dataset name, the universal time at the start of the observation and the position angle, , of the y axis of the WFC1 detector. The final two columns give the exposure time and filter for each observation.
2.2 Source Matching and Image Registration
The imaging for each program galaxy was completed in a single orbit — at fixed telescope position and roll angle — so the images for each galaxy are expected to be closely registered. Nevertheless, small offsets might be present, so shifts between the images were measured using the method described in Blakeslee et al. (2003). A brief overview of this method is given below.
To determine the shifts () and rotations between the various images, SExtractor (Bertin & Arnout 1996) was run with a signal-to-noise threshold of S/N = 10 on both science extensions for each image.111There are two such extensions ( CCD detectors) for the Wide Field Channel on ACS. The resultant catalogs were trimmed on the basis of object size and shape parameters, thereby rejecting the vast majority of cosmic rays, CCD artifacts, and diffuse extended objects. If fewer than ten “good” sources remained, SExtractor was rerun at a lower threshold. The () coordinates of each source were then corrected using the distortion model read from the IDCTAB FITS table specified in the image headers. For each observation, sources in the two CCD chips were placed on a common rectified frame using the IDCTAB parameters V2REF and V3REF.
The MATCH program of Richmond et al. (2000), which is based on the triangle-based search algorithm of Valdes et al. (1995), was used to derive shifts and rotations with respect to a reference image. By default, this reference image was taken to be the one having the greatest number of detected sources. The MATCH program was modified to accept an input guess for the transformation (derived from the headers) and report additional diagnostics to aid in evaluating the success of the matching. The complete catalog of sources was then used to fine tune this initial transformation.
This exercise revealed the measured rotations to be negligibly small in all cases, so we simply evaluated the median (y) shifts for the full list of matched sources. The median shifts measured for the images were typically 0.2 pixel.
2.3 Drizzling
With the offsets determined in this way, the images were combined using the PYRAF task multidrizzle (Koekemoer et al. 2002). Since several of the program galaxies fill a significant fraction of the field of view (, the brightest galaxies have effective radii ), the task was run without sky subtraction. Cosmic ray rejection was performed using this task; after some experimentation, the relevant parameters in the task driz_cr were set to scale = ′1.7 0.7′ and snr = ′4.5 2.0′. The drizzled images have dimension pixels for all galaxies.
Given the differing requirements of the various scientific programs, both Lanczos3 and Gaussian kernels were used to distribute flux onto the output image, thereby producing two independent image sets for each galaxy. For the globular cluster and SBF analysis, images were generated using a Lanczos3 kernel, which reduces the correlation between output pixels (and thus produces images with better noise characteristics for SBF analysis). As a drawback, the negative lobes of this kernel make the repair of bad pixels less effective. This is a potentially significant problem for the measurement of surface brightness profiles in the innermost regions of the program galaxies. Thus, the Gaussian kernel was used to create the drizzled images used in the isophotal analysis of the program galaxies.
In order to repair bad pixels, the bits parameter is set to indicate which pixels are to be considered good based on their value in the data quality file and thus drizzled into the final image. For isophotal analysis, we set bits=8322, which allows for the rejection of saturated pixels (, saturated pixels are not drizzled and the final value in the drizzled image is obtained by scaling based on the good pixels). Due to the difficulty in repairing bad pixels with the Lanczos3 kernel, we set bits=8576, which allows the flux from saturated pixels to be drizzled onto the final images.
2.4 Weight Images
Weight images were constructed in order to perform object detection and to aid in the determination of photometric and structural parameters for the globular cluster candidates (see §2.6). The presence of a strong signal arising from the SBF of the program galaxies — particularly in the band — requires that the “noise” contributed by the SBF must be included in the weight images in order to avoid the detection of spurious sources corresponding to real fluctuations in the underlying stellar populations.
In constructing the weight images, we begin with the WHT images, , produced by multidrizzle, in which each pixel contains the effective exposure time: , the total time during which photons contributing to observed counts were collected. The instrumental variance, , is then calculated as
| (1) |
where is the exposure time and is the detector readnoise for WFC/ACS. The factors and were determined empirically by comparing the resulting variance images calculated using the above expression with the noise measured directly in exposures of varying duration drawn from the ACS Early Release Observations. The values determined in this way were and . With the instrumental noise properties in hand, weight (inverse variance second-2) images consisting of Poisson and readnoise were calculated as
| (2) |
where denotes the data image in electrons second-1. Weight images in this form are then used in the measurement of photometric and structural parameters for the globular cluster candidates, as described in §2.6.
As noted above, it is important to include the contribution of SBF “noise” when performing object detection. The ratio of the variance from SBF, , to that of the Poisson noise from the galaxy, is given by (Tonry & Schneider 1988)
| (3) |
where
is the fluctuation magnitude in the given band, is the mean intensity of the galaxy, and
Here is the photometric zeropoint in the given band. From extensive ground-based observations, the fluctuation magnitude of bright Virgo ellipticals is known to be (Tonry et al. 2001). This value must be transformed to the bandpasses of ACS Virgo Cluster Survey, bearing in mind that the correction in this case is required for a typical program galaxy rather than a luminous giant. To estimate this correction, we make use of the scaling relation from Tonry et al. (2001), and assume mean fluctuation colors of and based on the models of Blakeslee, Vazdekis & Ajhar (2001). From Equation 3, we then find and for the and bandpasses, respectively.
This estimate of the SBF contribution to the variance does not take into account the effect of the PSF, which will reduce its value per pixel. Convolving simulated noise images with the ACS PSF, we found that the variance per pixel should be reduced by factors of 12 and 14 for the and bandpasses, respectively. With the galaxy model, , calculated as described in §2.5 below, the final weight image — including Poisson noise, readnoise and the contribution from the SBF — is then
| (4) |
with and 3 for the and bandpasses, respectively. We emphasize again that this SBF “noise” behaves in reality as a signal, and by incorporating its contribution in the weight images, we are effectively increasing the detection threshold in proportional to the SBF signal. To include these weights in the object detection process, the SExtractor parameter MAP_RMS was set to .
For some galaxies, internal dust obscuration, generally confined within the core region, significantly affects the surface brightness profiles and poses problems for both object detection and the estimation of the local background. The method used to flag pixels affected by dust will be described in detail in a future paper; very briefly, an optical depth map is created (in the band, for convenience) as
This expression applies to the case in which the dust is located entirely in the galaxy’s foreground; this assumption is almost certainly incorrect, and so represents a strict lower limit to the amount of absorption present. In the dust regions, , the ratio of the unextincted count rates in the and band, is estimated by linearly interpolating (or extrapolating, if the dust affects the center) the azimutally averaged values of observed in the regions immediately surrounding the dust areas. A pixel is then flagged as affected by dust if is positive, larger than the local standard deviation in the dust extinction map, and if more than one contiguous pixel is affected. The last two conditions are necessary in order not to flag noise spikes. In the case of galaxies that contain large scale central dust disks, a more conservative approach was followed prior to object detection and determination of the local background, and the entire disk was masked by hand222 These galaxies are VCC1030, VCC1154, VCC1250 and VCC1535. For both and , pixels that were determined to have dust are given zero weight. This prevents them from biasing the background determination (discussed in Sec 2.5), creating false object detections, or biasing the fitting of globular cluster surface brightness profiles. For VCC1316 (M87), pixels lying on its jet where also given zero weight.
2.5 Galaxy Models and Object Detection
A two-dimensional model for each program galaxy, , is needed to compute the weight images used to perform object detection. Once this model is in hand, it is possible to subtract the galaxy and perform the detections on a nearly flat background, greatly simplifying the estimation of the background for the detected sources. This is particularly important in the inner regions of the galaxies, where the background can vary dramatically on small spatial scales.
Galaxies were modeled using the ELLIPROF program described in the SBF survey of Tonry et al. (1997). This software was used to estimate and construct the weight images that include the contribution of the SBF signal (§2.4). A crucial preliminary step in construction of these models is the determination of the background “sky” count rate for each galaxy. Figure 2 shows the measured count rates, in both the F475W and F850LP filters, for the full sample of galaxies. These count rates, , refer to the modal pixel values (in units of electrons pixel-1 second-1) measured at distances of 90–150″. The upturn seen for the 10 brightest galaxies clearly reflects the contribution of the galaxies themselves to the measured backgrounds ( these galaxies have a median effective radius of 50″). To estimate the true background for these objects (all of which have similar locations with respect to the ecliptic plane), we use the fact that the background intensity scales with the SUNANGLE parameter, , which gives the angle between the Sun and the V1 axis of the telescope. Figure 3 shows the measured background count rates as a function of for the full sample of galaxies. The dashed curve in each panel shows the function
where the values of , , and for each filter have been determined directly from the 90 faintest galaxies in the sample. For the 10 brightest galaxies, which are shown as filled squares in Figure 3, we use equation 5 to estimate the true background count rates.
While the ELLIPROF models generally matched the galaxies quite well, there were in some cases large-scale residuals which remained after subtracting the models. To remove these residuals, the following procedure was adopted. First, SExtractor was run on the image, , constructed by subtracting from the science image the galaxy model, , . The SExtractor image is controlled by the parameters BACK_FILTERSIZE and BACK_SIZE which, after some experimentation, were set to 1 and 40, respectively.333See Bertin & Arnouts (1996) for a discussion of how the background is estimated by SExtractor. The choice for the latter parameter is particularly important since it must be set to a value small enough to remove much of the structure not accounted for by , yet at the same time large enough to leave the power spectrum of the point spread function (PSF) unaffected. The adopted value of BACK_SIZE = 40 accounts for structure on scales of and yet is 20 times the FWHM of the PSF.
For seven of the galaxies, ELLIPROF was unable to produce acceptable models because of the presence of strong disk components which were not well approximated by elliptical isophotes modulated by low-order Fourier terms.444These galaxies are VCC685, VCC1125, VCC1242, VCC1535, VCC1692, VCC1857 and VCC2095. We experimented with parametric bulge+disk models, but these also resulted in unacceptably large residuals. Instead, we settled on the same basic approach as used in the ground-based SBF survey for modeling early-type disk galaxies: fitting 2-D bicubic splines after first taking the logarithm of the galaxy image, except here used SExtractor to do the fitting. The logarithmic transformation reduces the steep surface brightness gradients, allowing them to be fitted more accurately by the spline interpolation. We then took the inverse logarithm of the model, subtracted it from the original image, and proceeded with fitting the residuals in linear space as described above.
Object detection on the final subtracted image was performed using a detection threshold of five connected pixels at a significance level. The detections in both the F475W and F850LP images were then matched using a matching radius of which, after some experimentation, was deemed to be optimal: , larger values produced an excess of spurious matches, while some clear associations were missed for smaller choices. A mask was constructed by assigning zero weight to the elliptical regions of the object shape determined by SExtractor and then scaling the parameters by 1.2 times the Kron radius (in units of ). As the Kron radius will include of the object’s flux, the factor of 1.2 ensures that most of the object’s flux will be masked. With this object mask, an improved background image, , is then determined with SExtractor. By masking the objects when estimating , we avoid biasing of the background by the sources — an important consideration given the rather small value adopted for the BACK_SIZE parameter.
The final F475W and F850LP images for object detection, photometry, and SBF analysis are then . Object detection was performed one last time by running SExtractor on , with the detection performed independently in both images, using a detection threshold of five connected pixels at a significance level. Since the background has already been subtracted from , SExtractor was run without further determination of the background (, the background was fixed at a constant value of zero).
The pixel positions of the detections were converted to celestial coordinates using the header information, and those sources detected in a single filter only were discarded. The detections in the F475W and F850LP images were again matched using a matching radius of . To investigate the accuracy of the absolute pointing, we compared the coordinates for 950 astrometric standards in our survey fields to those listed in the Guide Star Catalog 2.2 (McLean et al. 1998). We find mean offsets of –020 and 018 in right ascension and declination, with rms scatter about these value of 057 and 070, respectively. These results are consistent with the absolute pointing accuracy of 03 reported in Jordán et al. (2004; hereafter Paper III) based upon a comparison of the celestial coordinates of the nucleus of VCC1316 (M87 = NGC4486) with that measured using VLBI. The internal accuracy of the celestial coordinates for a given galaxy is 001 (Meurer et al. 2002).
2.6 Globular Cluster Selection, Photometry and Structural Parameters
Our final matched catalog of SExtractor sources consists of globular clusters associated with each galaxy, as well as foreground stars and compact background galaxies. Additional selection criteria were applied to isolate candidate globular clusters for further analysis.
-
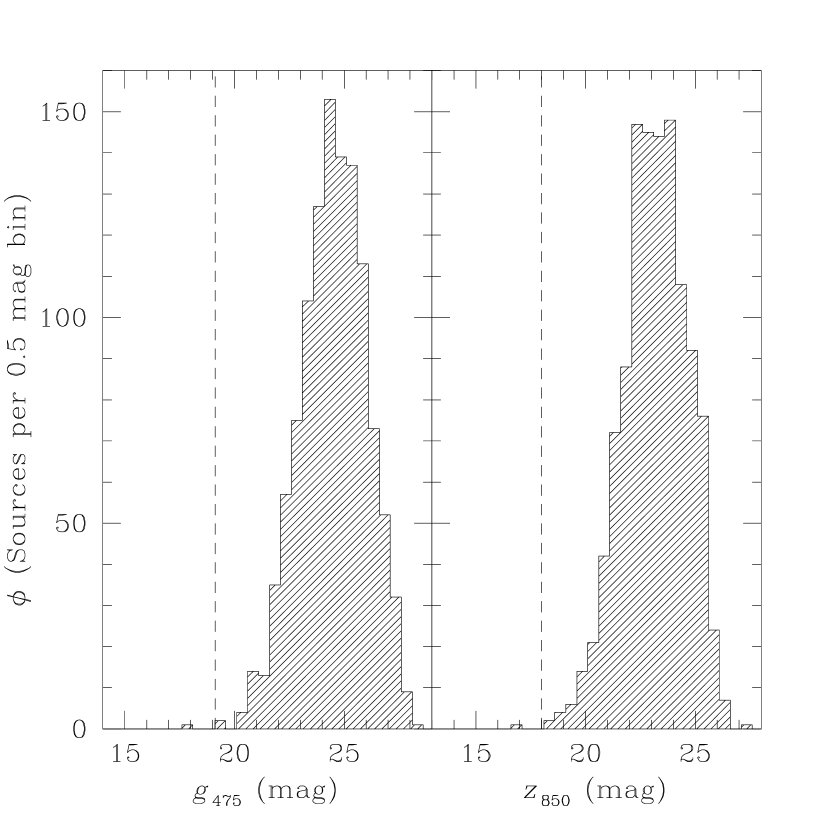
(1) Selection on Magnitude: It is well established that the luminosity function of globular clusters has a near Gaussian form (, Harris 2001). At the distance of Virgo, the luminosity function peaks at (Whitmore et al. 1995; Ferrarese, Côté & Jordán 2003). To select a sample of probable globular clusters, we discard all sources in the SExtractor catalog with or . These limits are roughly five magnitudes brighter than the expected turnover of the globular cluster luminosity function at the distance of Virgo. For a luminosity function dispersion of (Harris 2001), this selection will eliminate 0.02% of the globular clusters associated with the program galaxies, or only 2 clusters from the full survey. In any event, all sources brighter than these cutoffs were inspected visually to identify potentially interesting objects. Figure 4 shows the luminosity distribution of all sources in the SExtractor object catalog for VCC1226 (M49 = NGC4472). The dashed vertical lines in each panel indicate the magnitude cutoff used to select probable globular clusters.
-
(2) Selection on Shape: Globular clusters in the Local Group are nearly spherical systems, or at most, only modestly flattened. We therefore discard those sources in the SExtractor source catalog which have a mean elongation, , measured in the F475W and F850LP filters to be . This generous limit easily includes even the most elongated clusters in the Milky Way, M31 and the Magellanic Clouds (White & Shawl 1987; Lupton 1989; van den Bergh & Morbey 1994). The distribution of elongations for the full sample of sources in VCC1226 is shown in Figure 5. The inset to this figure compares the elongations measured in the two bandpasses.
In addition to these cuts, any sources found within 10 pixels () of the galaxy centers were omitted from the analysis of the two-dimensional surface brightness profiles of the detected sources (see below). In practice, this criterion eliminates only the nuclei of the program galaxies. The properties of these nuclei, and their relationship to the host galaxies, will be investigated separately in a future paper.
At a distance of 17 Mpc (Tonry et al. 2001), the globular clusters associated with Virgo galaxies are marginally resolved with WFC/ACS. For example, the mean half-light radius of globular clusters in the Milky Way is pc. This translates into a half-light diameter of 007, or 1.45 pixels — readily measurable given the FWHM of the PSF in WFC mode.
A Perl/PDL code (KINGPHOT) has been developed (Jordán & Côté 2004) to measure photometric and structural parameters for those sources which satisfied the above criteria by fitting the two-dimensional ACS surface brightness profiles with PSF-convolved isotropic, single-mass King (1966) models. This family of models is well known to provide an excellent representation of the surface brightness profiles of Galactic globular clusters. Empirical PSFs in both F475W and F850LP, varying quadratically with CCD position, were derived using DAOPHOT II (Stetson 1987; 1993) and archival observations of moderately crowded fields in the outskirts of the Galactic globular cluster Tucanae (NGC 104). The observations consisted of a 30 sec F475W image from program GO-9656, and two 60 sec F850LP images from program GO-9018. The archival images were drizzled in the same manner as the science images and a total of 200 stars were used in each case to determine the PSF.
For each object classified as a globular cluster candidate, KINGPHOT is used to measure the total magnitude, King concentration index, , and half-light radius, in both bandpasses. Note that we use as scale factor in lieu of the more traditional core radius, , but the two parameters are related as described in McLaughlin (2000). While the selection on magnitude and elongation described above serves to lessen the contamination of the globular cluster catalogs by stars and galaxies, some interlopers inevitably remain. In a future paper, we describe a method to further reduce this contamination for each program galaxy by using our reduction pipeline to analyze archival F475W and F850LP blank field images at high Galactic latitude.
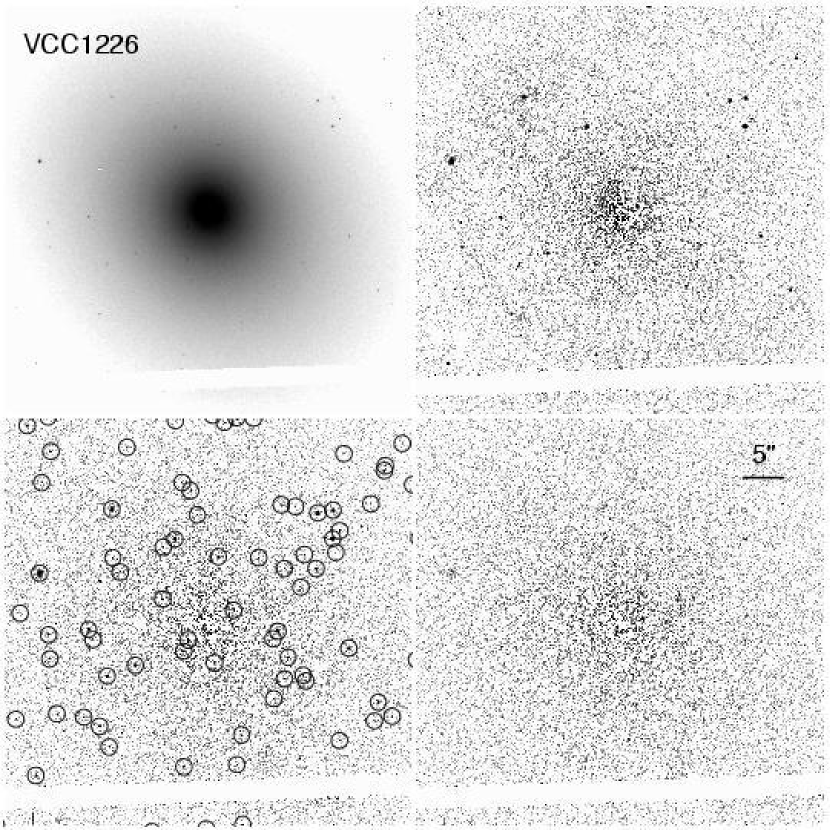
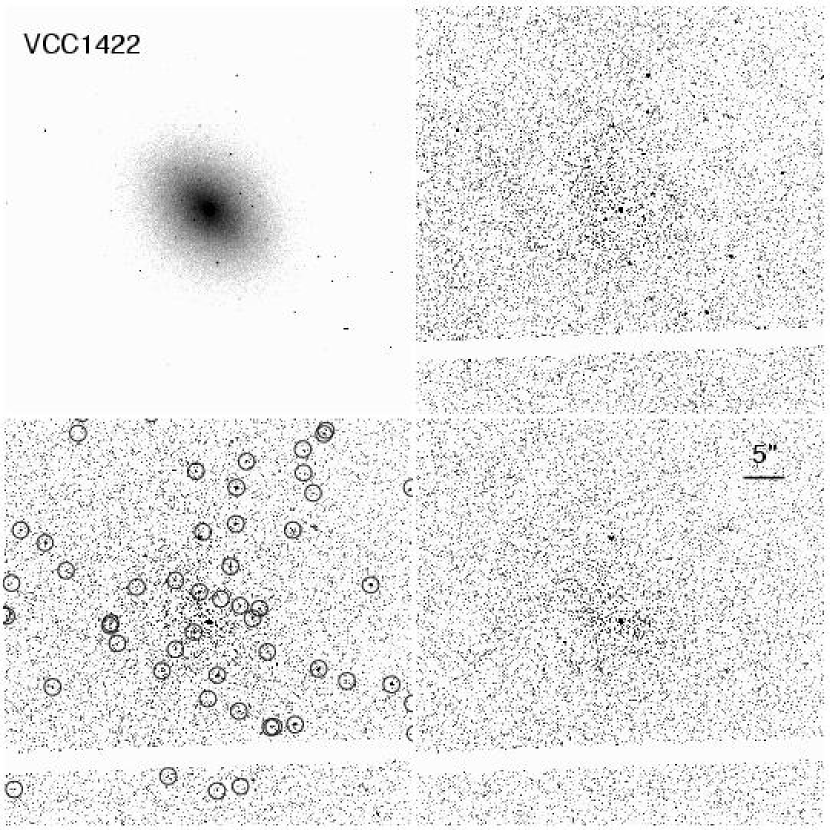
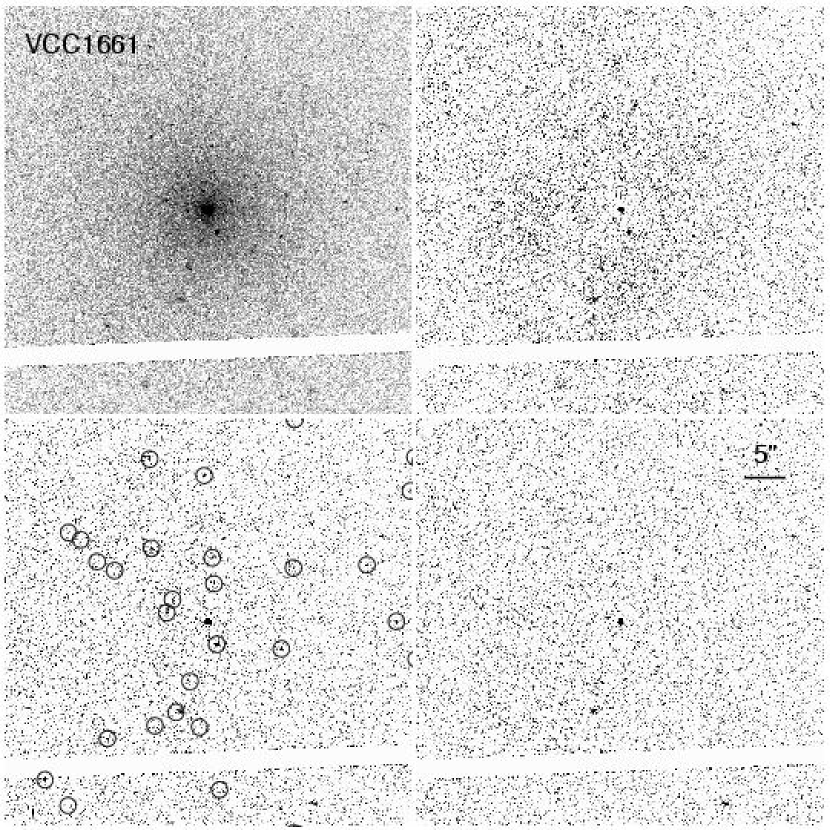
Figures 6 – 8 illustrate the reduction procedures described above for a representative sample of three program galaxies: VCC1226, VCC1422 and VCC1661. These are the first, 50th and 100th ranked galaxies in the survey, respectively. In each figure, we show the registered, geometrically corrected F475W image in the upper left panel. The upper right panel shows the residuals obtained after subtracting from this image the ELLIPROF model described in §2.5. The lower left panel shows the result of subtracting the SExtractor model for this residual background; the circles in this panel indicate those sources which satisfy the criteria used to select globular cluster candidates. Note that bright nuclei of VCC1422 and and VCC1661 are excluded from the respective globular cluster catalogs for these galaxies. The lower right panel shows the image obtained by subtracting the best-fit, PSF-convolved King model from each of the sources identified in the previous panel.
2.7 Foreground Extinction and Photometric Calibration
Since the Virgo Cluster spans 10∘ on the sky, a reddening for each galaxy was computed using the DIRBE maps of Schlegel, Finkbeiner & Davis (1998). The mean reddening for the sample was found to be = 0.029 mag, with a standard deviation of 0.008 mag. The corrections for foreground extinction, assumed to be constant within each ACS field, were taken to be
These extinction ratios correspond to the spectral energy distribution of a G2 star (see Table 27 of Sirianni et al. 2004), and are appropriate for the globular clusters and elliptical galaxies targeted in the survey. Calibrated magnitudes on the AB system were obtained using the relations
where and refer to the integrated fluxes, in units of electrons/sec, in the F475W and F850LP filters. The photometric zeropoints were taken from Sirianni et al. (2004).
3 Data Products
The reduction pipeline described above was designed to meet the scientific objectives of the ACS Virgo Cluster Survey. Future papers in this series will present scientific results from the survey as well as a variety of data products. These products include a catalog of probable globular clusters associated with each program galaxy and their basic properties (, celestial coordinates, magnitudes, colors and structural parameters) and the results of an isophotal analysis for each galaxy (, radial profiles of surface brightness, color, ellipticity, position angle, as well as extinction maps and dust masses). These data products, along with raw and fully processed images used in the analysis, will be made available through the project website: http://www.physics.rutgers.edu/$∼$pcote/acs.
References
- Bertin & Arnouts (1996) Bertin, E. & Arnouts, S. 1996, A&AS, 117, 393
- Binggeli, Sandage & Tammann (1985) Binggeli, B., Sandage, A., & Tammann, G.A., 1985, AJ, 90, 1681
- Blakeslee, Vazdekis & Ajhar (2001) Blakeslee, J.P., Vazdekis, A., & Ajhar, E. 2001, MNRAS, 320, 193
- Blakeslee et al. (2003) Blakeslee, J.P., Anderson, K.R., Meurer, G.R. & Benítez, N. 2003, in ASP Conf. Ser. 295: Astronomical Data Analysis Software and Systems XII, 257
- Côté et al. (2004) Côté, P., Blakeslee, J.P., Ferrarese, L., Jordán, A., Mei, S., Merritt, D., Milosavljević, M., Peng, E.W., & West, M.J. 2004, ApJS, in press (Paper I)
- Ferrarese, Côté & Jordán (2003) Ferrarese, L., Côté, P., & Jordán, A. 2003, ApJ, 599, 1302
- Ford et al. (1998) Ford, H.C., et al. 1998, Proc. SPIE, 3356, 234
- Harris (2001) Harris, W.E. 2001, in Star Clusters, Saas-Fee Advanced School 28, ed. L. Labhardt & B. Binggeli (Berlin:Springer), 223
- Jordán et al. (2004) Jordán, A., Côté, P., Ferrarese, L., Blakeslee, J.P., Mei, S., Merritt, D., Milosavljević, M., Peng, E., Tonry, J.L., & West, M.J. 2004, ApJ, in press (Paper III)
- Jordán & Côté (2004) Jordán, A., & Côté, P. 2004, in preparation
- King (1966) King, I.R. 1966, AJ, 71, 64
- Koekemoer et al. (2002) Koekemoer, A.M., Fruchter, A.S., Hook, R.N., & Hack, W. 2002, in The 2002 HST Calibration Workshop, ed. S. Arribas, A. Koekemoer, & B. Whitmore (STScI: Baltimore), p 339.
- Lupton (1989) Lupton, R.H., 1989, AJ, 97, 1350
- McLaughlin (2000) McLaughlin 2000, ApJ, 539, 618
- McLean et al. (1998) McLean, B., Hawkins, C., Spagna, A., Lattanzi, M., Lasker, B., Jenkner, H., White, R. 1998, in IAU Symp. 179, New Horizons from Multi-Wavelength Sky Surveys, ed. B.J. McLean, D.A. Golombek, J.J.E. Hayes, & H.E. Payne (Dordrecht: Kluwer), 431
- Meurer et al. (2002) Meurer, G.R., Lindler, D., Blakeslee, J.P., Cox, C., Martel, A.R., Tran, H.D., Bouwens, R.J., Ford, H.C., Clampin, M., Hartig, G.F., Sirianni, M., & de Marchi, G. 2002, in The 2002 HST Calibration Workshop, ed. S. Arribas, A. Koekemoer, & B. Whitmore (STScI: Baltimore), p 65.
- Richmond et al. (2000) Richmond, M.W., Droege, T.F., Gombert, G., Gutzwiller, M., Henden, A.A., Albertson, C., Beser, N., Molhant, N., & Johnson, H. 2000, PASP, 112, 397
- Schlegel et al. (1998) Schlegel, D.J., Finkbeiner, D.P., & Davis, M. 1998, ApJ, 500, 525
- Sirianni et al. (2004) Sirianni et al. 2004, in preparation
- Stetson (1987) Stetson, P.B. 1987, PASP, 99, 191
- Stetson (1993) Stetson, P.B. 1993, in IAU Colloq. 136, Stellar Photometry: Current Techniques and Future Developments, ed. C. J. Butler & I. Elliot (Cambridge: Cambridge Univ. Press), 291
- Tonry & Schneider (1988) Tonry, J.L., & Schneider, D.P. 1988, AJ, 96, 807
- Tonry et al. (1997) Tonry, J. L., Blakeslee, J. P., Ajhar, E. A., & Dressler, A., 1997, ApJ, 475, 399
- Tonry et al. (2001) Tonry, J.L., Dressler, A., Blakeslee, J.P., Ajhar, E.A., Fletcher, A.B., Luppino, G.A., Metzger, M.R., & Moore, C.B. 2001, ApJ, 546, 681
- White & Shawl (1987) White, R.E., & Shawl, S.J. 1987, ApJ, 317, 246
- Whitmore et al. (1995) Whitmore, B.C., Sparks, W.B., Lucas, R.A., Macchetto, F.D., & Biretta, J.A. 1995, ApJ, 454, L73
- Valdes et al. (1995) Valdes, F.G., Campusano, L.E., Velasquez, J.D., & Stetson, P.B. 1995, PASP, 107, 1119
- van den Bergh & Morbey (1994) Van den Bergh, S., & Morbey, C.L. 1994, ApJ, 283, 598
| ID | VCC | Date | Dataset | UT | Filter | ||
|---|---|---|---|---|---|---|---|
| (deg) | (sec) | ||||||
| 1 | 1226 | 2003-06-19 | j8fs01x5q | 06:50:34 | 114.72 | 90 | F850LP |
| j8fs01x6q | 06:54:22 | 560 | F850LP | ||||
| j8fs01x8q | 07:05:58 | 560 | F850LP | ||||
| j8fs01xaq | 07:18:11 | 375 | F475W | ||||
| j8fs01xcq | 07:26:42 | 375 | F475W | ||||
| 2 | 1316 | 2003-01-19 | j8fs02bdq | 20:47:35 | 269.99 | 90 | F850LP |
| j8fs02beq | 20:51:23 | 560 | F850LP | ||||
| j8fs02bgq | 21:02:59 | 560 | F850LP | ||||
| j8fs02biq | 21:15:12 | 375 | F475W | ||||
| j8fs02bkq | 21:23:43 | 375 | F475W | ||||
| 3 | 1978 | 2003-06-17 | j8fs03meq | 18:02:11 | 118.60 | 90 | F850LP |
| j8fs03mfq | 18:05:59 | 560 | F850LP | ||||
| j8fs03mhq | 18:17:35 | 560 | F850LP | ||||
| j8fs03mjq | 18:29:48 | 375 | F475W | ||||
| j8fs03mlq | 18:38:19 | 375 | F475W | ||||
| 4 | 881 | 2003-05-18 | j8fs04y3q | 08:09:39 | 140.20 | 90 | F850LP |
| j8fs04y4q | 08:13:27 | 560 | F850LP | ||||
| j8fs04y6q | 08:25:03 | 560 | F850LP | ||||
| j8fs04y8q | 08:37:16 | 375 | F475W | ||||
| j8fs04yaq | 08:45:47 | 375 | F475W | ||||
| 5 | 798 | 2003-02-01 | j8fs05dbq | 21:00:42 | 276.94 | 90 | F850LP |
| j8fs05dcq | 21:04:30 | 560 | F850LP | ||||
| j8fs05deq | 21:16:06 | 560 | F850LP | ||||
| j8fs05dgq | 21:28:19 | 375 | F475W | ||||
| j8fs05diq | 21:36:50 | 375 | F475W | ||||
| 6 | 763 | 2003-01-21 | j8fs06o0q | 20:49:42 | 285.65 | 90 | F850LP |
| j8fs06o1q | 20:53:30 | 560 | F850LP | ||||
| j8fs06o3q | 21:05:06 | 560 | F850LP | ||||
| j8fs06o5q | 21:17:18 | 375 | F475W | ||||
| j8fs06o7q | 21:25:50 | 375 | F475W | ||||
| 7 | 731 | 2003-06-06 | j8fs07f7q | 13:08:41 | 130.00 | 90 | F850LP |
| j8fs07f8q | 13:12:29 | 560 | F850LP | ||||
| j8fs07faq | 13:24:05 | 560 | F850LP | ||||
| j8fs07fcq | 13:36:18 | 375 | F475W | ||||
| j8fs07feq | 13:44:49 | 375 | F475W | ||||
| 8 | 1535 | 2003-07-12 | j8fs08lnq | 10:18:31 | 109.20 | 90 | F850LP |
| j8fs08loq | 10:22:19 | 560 | F850LP | ||||
| j8fs08lqq | 10:33:55 | 560 | F850LP | ||||
| j8fs08lsq | 10:46:08 | 375 | F475W | ||||
| j8fs08luq | 10:54:39 | 375 | F475W | ||||
| 9 | 1903 | 2003-07-19 | j8fs09lhq | 07:09:57 | 106.61 | 90 | F850LP |
| j8fs09liq | 07:13:45 | 560 | F850LP | ||||
| j8fs09lkq | 07:25:21 | 560 | F850LP | ||||
| j8fs09lmq | 07:37:34 | 375 | F475W | ||||
| j8fs09loq | 07:46:05 | 375 | F475W | ||||
| 10 | 1632 | 2003-07-07 | j8fs10eeq | 10:17:18 | 110.94 | 90 | F850LP |
| j8fs10efq | 10:21:06 | 560 | F850LP | ||||
| j8fs10ehq | 10:32:42 | 560 | F850LP | ||||
| j8fs10ejq | 10:44:55 | 375 | F475W | ||||
| j8fs10elq | 10:53:26 | 375 | F475W | ||||
| 11 | 1231 | 2003-06-12 | j8fs11a8q | 14:47:10 | 116.84 | 90 | F850LP |
| j8fs11a9q | 14:50:58 | 560 | F850LP | ||||
| j8fs11abq | 15:02:34 | 560 | F850LP | ||||
| j8fs11adq | 15:14:47 | 375 | F475W | ||||
| j8fs11afq | 15:23:18 | 375 | F475W | ||||
| 12 | 2095 | 2003-03-21 | j8fs12ipq | 18:38:38 | 227.99 | 90 | F850LP |
| j8fs12iqq | 18:42:26 | 560 | F850LP | ||||
| j8fs12isq | 18:54:02 | 560 | F850LP | ||||
| j8fs12iuq | 19:06:15 | 375 | F475W | ||||
| j8fs12iwq | 19:14:46 | 375 | F475W | ||||
| 13 | 1154 | 2003-07-17 | j8fs13xmq | 03:56:34 | 108.61 | 90 | F850LP |
| j8fs13xnq | 04:00:22 | 560 | F850LP | ||||
| j8fs13xpq | 04:11:58 | 560 | F850LP | ||||
| j8fs13xrq | 04:24:11 | 375 | F475W | ||||
| j8fs13xtq | 04:32:42 | 375 | F475W | ||||
| 14 | 1062 | 2003-02-09 | j8fs14knq | 17:56:13 | 288.99 | 90 | F850LP |
| j8fs14koq | 18:00:01 | 560 | F850LP | ||||
| j8fs14kqq | 18:11:37 | 560 | F850LP | ||||
| j8fs14ksq | 18:23:50 | 375 | F475W | ||||
| j8fs14kuq | 18:32:21 | 375 | F475W | ||||
| 15 | 2092 | 2003-01-20 | j8fs15g6q | 22:27:38 | 287.21 | 90 | F850LP |
| j8fs15g7q | 22:31:26 | 560 | F850LP | ||||
| j8fs15g9q | 22:43:02 | 560 | F850LP | ||||
| j8fs15gbq | 22:55:14 | 375 | F475W | ||||
| j8fs15gdq | 23:03:46 | 375 | F475W | ||||
| 16 | 369 | 2003-06-14 | j8fs16t2q | 19:35:28 | 129.80 | 90 | F850LP |
| j8fs16t3q | 19:39:16 | 560 | F850LP | ||||
| j8fs16t5q | 19:50:52 | 560 | F850LP | ||||
| j8fs16t7q | 20:03:05 | 375 | F475W | ||||
| j8fs16t9q | 20:11:36 | 375 | F475W | ||||
| 17 | 759 | 2003-06-11 | j8fs17pnq | 08:22:38 | 112.81 | 90 | F850LP |
| j8fs17poq | 08:26:26 | 560 | F850LP | ||||
| j8fs17pqq | 08:38:02 | 560 | F850LP | ||||
| j8fs17psq | 08:50:15 | 375 | F475W | ||||
| j8fs17puq | 08:58:46 | 375 | F475W | ||||
| 18 | 1692 | 2003-07-13 | j8fs18tnq | 07:06:54 | 109.80 | 90 | F850LP |
| j8fs18toq | 07:10:42 | 560 | F850LP | ||||
| j8fs18tqq | 07:22:18 | 560 | F850LP | ||||
| j8fs18tsq | 07:34:31 | 375 | F475W | ||||
| j8fs18tuq | 07:43:02 | 375 | F475W | ||||
| 19 | 1030 | 2003-01-31 | j8fs19ucq | 20:59:27 | 290.19 | 90 | F850LP |
| j8fs19udq | 21:03:15 | 560 | F850LP | ||||
| j8fs19ufq | 21:14:51 | 560 | F850LP | ||||
| j8fs19uhq | 21:27:03 | 375 | F475W | ||||
| j8fs19ujq | 21:35:35 | 375 | F475W | ||||
| 20 | 2000 | 2003-06-21 | j8fs20j8q | 06:52:14 | 124.00 | 90 | F850LP |
| j8fs20j9q | 06:56:02 | 560 | F850LP | ||||
| j8fs20jbq | 07:07:38 | 560 | F850LP | ||||
| j8fs20jdq | 07:19:51 | 375 | F475W | ||||
| j8fs20jfq | 07:28:22 | 375 | F475W | ||||
| 21 | 685 | 2003-06-13 | j8fs21mcq | 17:58:47 | 116.47 | 90 | F850LP |
| j8fs21mdq | 18:02:35 | 560 | F850LP | ||||
| j8fs21mfq | 18:14:11 | 560 | F850LP | ||||
| j8fs21mhq | 18:26:24 | 375 | F475W | ||||
| j8fs21mjq | 18:34:55 | 375 | F475W | ||||
| 22 | 1664 | 2003-07-07 | j8fs22etq | 11:54:55 | 111.15 | 90 | F850LP |
| j8fs22euq | 11:58:43 | 560 | F850LP | ||||
| j8fs22ewq | 12:10:19 | 560 | F850LP | ||||
| j8fs22eyq | 12:22:32 | 375 | F475W | ||||
| j8fs22f0q | 12:31:03 | 375 | F475W | ||||
| 23 | 654 | 2003-06-10 | j8fs23mnq | 21:09:46 | 120.01 | 90 | F850LP |
| j8fs23moq | 21:13:34 | 560 | F850LP | ||||
| j8fs23mqq | 21:25:10 | 560 | F850LP | ||||
| j8fs23msq | 21:37:23 | 375 | F475W | ||||
| j8fs23muq | 21:45:54 | 375 | F475W | ||||
| 24 | 944 | 2003-06-12 | j8fs24zpq | 13:11:28 | 116.00 | 90 | F850LP |
| j8fs24zqq | 13:15:16 | 560 | F850LP | ||||
| j8fs24zsq | 13:26:52 | 560 | F850LP | ||||
| j8fs24zuq | 13:39:05 | 375 | F475W | ||||
| j8fs24zwq | 13:47:36 | 375 | F475W | ||||
| 25 | 1938 | 2003-03-05 | j8fs25cnq | 21:30:57 | 249.98 | 90 | F850LP |
| j8fs25coq | 21:34:45 | 560 | F850LP | ||||
| j8fs25cqq | 21:46:21 | 560 | F850LP | ||||
| j8fs25csq | 21:58:33 | 375 | F475W | ||||
| j8fs25cuq | 22:07:05 | 375 | F475W | ||||
| 26 | 1279 | 2003-07-09 | j8fs26tiq | 08:41:47 | 110.32 | 90 | F850LP |
| j8fs26tjq | 08:45:35 | 560 | F850LP | ||||
| j8fs26tlq | 08:57:11 | 560 | F850LP | ||||
| j8fs26tnq | 09:09:24 | 375 | F475W | ||||
| j8fs26tpq | 09:17:55 | 375 | F475W | ||||
| 27 | 1720 | 2003-05-15 | j8fs27a9q | 08:08:29 | 129.00 | 90 | F850LP |
| j8fs27aaq | 08:12:17 | 560 | F850LP | ||||
| j8fs27acq | 08:23:53 | 560 | F850LP | ||||
| j8fs27aeq | 08:36:06 | 375 | F475W | ||||
| j8fs27agq | 08:44:37 | 375 | F475W | ||||
| 28 | 355 | 2003-06-13 | j8fs28jrq | 09:58:40 | 116.03 | 90 | F850LP |
| j8fs28jsq | 10:02:28 | 560 | F850LP | ||||
| j8fs28juq | 10:14:04 | 560 | F850LP | ||||
| j8fs28jwq | 10:26:17 | 375 | F475W | ||||
| j8fs28jyq | 10:34:48 | 375 | F475W | ||||
| 29 | 1619 | 2003-07-18 | j8fs29gcq | 08:45:12 | 110.61 | 90 | F850LP |
| j8fs29gdq | 08:49:00 | 560 | F850LP | ||||
| j8fs29gfq | 09:00:36 | 560 | F850LP | ||||
| j8fs29ghq | 09:12:49 | 375 | F475W | ||||
| j8fs29gjq | 09:21:20 | 375 | F475W | ||||
| 30 | 1883 | 2003-03-19 | j8fs30t7q | 17:00:03 | 239.94 | 90 | F850LP |
| j8fs30t8q | 17:03:51 | 560 | F850LP | ||||
| j8fs30taq | 17:15:27 | 560 | F850LP | ||||
| j8fs30tcq | 17:27:40 | 375 | F475W | ||||
| j8fs30teq | 17:36:11 | 375 | F475W | ||||
| 31 | 1242 | 2003-03-20 | j8fs31awq | 17:00:56 | 179.98 | 90 | F850LP |
| j8fs31axq | 17:04:44 | 560 | F850LP | ||||
| j8fs31azq | 17:16:20 | 560 | F850LP | ||||
| j8fs31b1q | 17:28:33 | 375 | F475W | ||||
| j8fs31b3q | 17:37:04 | 375 | F475W | ||||
| 32 | 784 | 2003-06-13 | j8fs32luq | 16:22:59 | 111.61 | 90 | F850LP |
| j8fs32lvq | 16:26:47 | 560 | F850LP | ||||
| j8fs32lxq | 16:38:23 | 560 | F850LP | ||||
| j8fs32lzq | 16:50:36 | 375 | F475W | ||||
| j8fs32m1q | 16:59:07 | 375 | F475W | ||||
| 33 | 1537 | 2003-01-20 | j8fs33flq | 19:12:52 | 286.93 | 90 | F850LP |
| j8fs33fmq | 19:16:40 | 560 | F850LP | ||||
| j8fs33foq | 19:28:16 | 560 | F850LP | ||||
| j8fs33fqq | 19:40:30 | 375 | F475W | ||||
| j8fs33fsq | 19:49:00 | 375 | F475W | ||||
| 34 | 778 | 2003-06-16 | j8fs34elq | 18:00:11 | 130.20 | 90 | F850LP |
| j8fs34emq | 18:03:59 | 560 | F850LP | ||||
| j8fs34eoq | 18:15:35 | 560 | F850LP | ||||
| j8fs34eqq | 18:27:48 | 375 | F475W | ||||
| j8fs34esq | 18:36:19 | 375 | F475W | ||||
| 35 | 1321 | 2003-07-16 | j8fs35seq | 05:32:39 | 106.93 | 90 | F850LP |
| j8fs35sfq | 05:36:27 | 560 | F850LP | ||||
| j8fs35shq | 05:48:03 | 560 | F850LP | ||||
| j8fs35sjq | 06:00:16 | 375 | F475W | ||||
| j8fs35slq | 06:08:47 | 375 | F475W | ||||
| 36 | 828 | 2003-07-17 | j8fs36y3s | 05:32:16 | 106.41 | 90 | F850LP |
| j8fs36y4q | 05:36:04 | 560 | F850LP | ||||
| j8fs36y6q | 05:47:40 | 560 | F850LP | ||||
| j8fs36y8q | 05:59:53 | 375 | F475W | ||||
| j8fs36yaq | 06:08:24 | 375 | F475W | ||||
| 37 | 1250 | 2003-01-20 | j8fs37fwq | 20:48:46 | 286.35 | 90 | F850LP |
| j8fs37fxq | 20:52:34 | 560 | F850LP | ||||
| j8fs37fzq | 21:04:10 | 560 | F850LP | ||||
| j8fs37g1q | 21:16:22 | 375 | F475W | ||||
| j8fs37g3q | 21:24:54 | 375 | F475W | ||||
| 38 | 1630 | 2003-07-30 | j8fs38s0q | 05:39:01 | 100.01 | 90 | F850LP |
| j8fs38s1q | 05:42:49 | 560 | F850LP | ||||
| j8fs38s3q | 05:54:25 | 560 | F850LP | ||||
| j8fs38s5q | 06:06:38 | 375 | F475W | ||||
| j8fs38s7q | 06:15:09 | 375 | F475W | ||||
| 39 | 1146 | 2003-12-28 | j8fs39cbq | 22:19:27 | 285.99 | 90 | F850LP |
| j8fs39ccq | 22:23:15 | 560 | F850LP | ||||
| j8fs39ceq | 22:34:51 | 560 | F850LP | ||||
| j8fs39cgq | 22:47:04 | 375 | F475W | ||||
| j8fs39ciq | 22:55:35 | 375 | F475W | ||||
| 40 | 1025 | 2003-04-05 | j8fs40g6q | 17:13:05 | 174.99 | 90 | F850LP |
| j8fs40g7q | 17:16:53 | 560 | F850LP | ||||
| j8fs40g9q | 17:28:29 | 560 | F850LP | ||||
| j8fs40gbq | 17:40:42 | 375 | F475W | ||||
| j8fs40gdq | 17:49:13 | 375 | F475W | ||||
| 41 | 1303 | 2003-07-09 | j8fs41txq | 10:17:26 | 114.60 | 90 | F850LP |
| j8fs41tyq | 10:21:14 | 560 | F850LP | ||||
| j8fs41u0q | 10:32:50 | 560 | F850LP | ||||
| j8fs41u2q | 10:45:03 | 375 | F475W | ||||
| j8fs41u4q | 10:53:34 | 375 | F475W | ||||
| 42 | 1913 | 2003-04-28 | j8fs42kuq | 19:05:58 | 131.00 | 90 | F850LP |
| j8fs42kvq | 19:09:46 | 560 | F850LP | ||||
| j8fs42kxq | 19:21:22 | 560 | F850LP | ||||
| j8fs42kzq | 19:33:35 | 375 | F475W | ||||
| j8fs42l1q | 19:42:06 | 375 | F475W | ||||
| 43 | 1327 | 2003-06-12 | j8fs43aqq | 16:23:25 | 116.61 | 90 | F850LP |
| j8fs43arq | 16:27:13 | 560 | F850LP | ||||
| j8fs43atq | 16:38:49 | 560 | F850LP | ||||
| j8fs43avq | 16:51:02 | 375 | F475W | ||||
| j8fs43axq | 16:59:33 | 375 | F475W | ||||
| 44 | 1125 | 2003-06-11 | j8fs44qbq | 09:58:52 | 117.01 | 90 | F850LP |
| j8fs44qcq | 10:02:40 | 560 | F850LP | ||||
| j8fs44qeq | 10:14:16 | 560 | F850LP | ||||
| j8fs44qgq | 10:26:29 | 375 | F475W | ||||
| j8fs44qiq | 10:35:00 | 375 | F475W | ||||
| 45 | 1475 | 2003-06-12 | j8fs45b8q | 17:59:01 | 117.21 | 90 | F850LP |
| j8fs45b9q | 18:02:49 | 560 | F850LP | ||||
| j8fs45bbq | 18:14:25 | 560 | F850LP | ||||
| j8fs45bdq | 18:26:38 | 375 | F475W | ||||
| j8fs45bfq | 18:35:09 | 375 | F475W | ||||
| 46 | 1178 | 2003-01-25 | j8fs46hjq | 20:53:34 | 287.17 | 90 | F850LP |
| j8fs46hkq | 20:57:22 | 560 | F850LP | ||||
| j8fs46hmq | 21:08:58 | 560 | F850LP | ||||
| j8fs46hoq | 21:21:11 | 375 | F475W | ||||
| j8fs46hqq | 21:29:42 | 375 | F475W | ||||
| 47 | 1283 | 2002-12-25 | j8fs47tkq | 18:39:12 | 301.00 | 90 | F850LP |
| j8fs47tlq | 18:43:00 | 560 | F850LP | ||||
| j8fs47tnq | 18:54:36 | 560 | F850LP | ||||
| j8fs47tpq | 19:06:49 | 375 | F475W | ||||
| j8fs47trq | 19:15:20 | 375 | F475W | ||||
| 48 | 1261 | 2003-07-13 | j8fs48u4q | 08:42:58 | 111.61 | 90 | F850LP |
| j8fs48u5q | 08:46:46 | 560 | F850LP | ||||
| j8fs48u7q | 08:58:22 | 560 | F850LP | ||||
| j8fs48u9q | 09:10:35 | 375 | F475W | ||||
| j8fs48ubq | 09:19:06 | 375 | F475W | ||||
| 49 | 698 | 2003-06-21 | j8fs49jpq | 08:26:52 | 128.00 | 90 | F850LP |
| j8fs49jqq | 08:30:40 | 560 | F850LP | ||||
| j8fs49jsq | 08:42:16 | 560 | F850LP | ||||
| j8fs49juq | 08:54:29 | 375 | F475W | ||||
| j8fs49jwq | 09:03:00 | 375 | F475W | ||||
| 50 | 1422 | 2003-07-09 | j8fs50ueq | 11:55:43 | 112.21 | 90 | F850LP |
| j8fs50ufq | 11:59:31 | 560 | F850LP | ||||
| j8fs50uhq | 12:11:07 | 560 | F850LP | ||||
| j8fs50ujq | 12:23:20 | 375 | F475W | ||||
| j8fs50ulq | 12:31:51 | 375 | F475W | ||||
| 51 | 2048 | 2003-06-08 | j8fs51tsq | 14:46:55 | 131.80 | 90 | F850LP |
| j8fs51ttq | 14:50:43 | 560 | F850LP | ||||
| j8fs51tvq | 15:02:19 | 560 | F850LP | ||||
| j8fs51txq | 15:14:32 | 375 | F475W | ||||
| j8fs51tzq | 15:23:03 | 375 | F475W | ||||
| 52 | 1871 | 2003-07-11 | j8fs52epq | 07:07:02 | 111.41 | 90 | F850LP |
| j8fs52eqq | 07:10:50 | 560 | F850LP | ||||
| j8fs52esq | 07:22:26 | 560 | F850LP | ||||
| j8fs52euq | 07:34:39 | 375 | F475W | ||||
| j8fs52ewq | 07:43:10 | 375 | F475W | ||||
| 53 | 9 | 2003-01-21 | j8fs53n9q | 19:12:36 | 265.78 | 90 | F850LP |
| j8fs53naq | 19:16:24 | 560 | F850LP | ||||
| j8fs53ncq | 19:28:00 | 560 | F850LP | ||||
| j8fs53neq | 19:40:14 | 375 | F475W | ||||
| j8fs53ngq | 19:48:44 | 375 | F475W | ||||
| 54 | 575 | 2003-07-13 | j8fs54ulq | 10:18:14 | 110.61 | 90 | F850LP |
| j8fs54umq | 10:22:02 | 560 | F850LP | ||||
| j8fs54uoq | 10:33:38 | 560 | F850LP | ||||
| j8fs54uqq | 10:45:51 | 375 | F475W | ||||
| j8fs54usq | 10:54:22 | 375 | F475W | ||||
| 55 | 1910 | 2003-01-31 | j8fs55t3q | 17:48:02 | 283.02 | 90 | F850LP |
| j8fs55t4q | 17:51:50 | 560 | F850LP | ||||
| j8fs55t6q | 18:03:26 | 560 | F850LP | ||||
| j8fs55t8q | 18:15:39 | 375 | F475W | ||||
| j8fs55taq | 18:24:10 | 375 | F475W | ||||
| 56 | 1049 | 2003-02-12 | j8fs56t5q | 14:47:23 | 289.99 | 90 | F850LP |
| j8fs56t6q | 14:51:11 | 560 | F850LP | ||||
| j8fs56t8q | 15:02:47 | 560 | F850LP | ||||
| j8fs56taq | 15:15:00 | 375 | F475W | ||||
| j8fs56tcq | 15:23:31 | 375 | F475W | ||||
| 57 | 856 | 2003-07-11 | j8fs57f8q | 08:41:59 | 109.21 | 90 | F850LP |
| j8fs57f9q | 08:45:47 | 560 | F850LP | ||||
| j8fs57fbq | 08:57:23 | 560 | F850LP | ||||
| j8fs57fdq | 09:09:36 | 375 | F475W | ||||
| j8fs57ffq | 09:18:07 | 375 | F475W | ||||
| 58 | 140 | 2003-06-15 | j8fs58beq | 09:59:11 | 115.61 | 90 | F850LP |
| j8fs58bfq | 10:02:59 | 560 | F850LP | ||||
| j8fs58bhq | 10:14:35 | 560 | F850LP | ||||
| j8fs58bjq | 10:26:48 | 375 | F475W | ||||
| j8fs58blq | 10:35:19 | 375 | F475W | ||||
| 59 | 1355 | 2003-01-21 | j8fs59kcq | 16:01:59 | 285.20 | 90 | F850LP |
| j8fs59kdq | 16:05:47 | 560 | F850LP | ||||
| j8fs59kfq | 16:17:23 | 560 | F850LP | ||||
| j8fs59khq | 16:29:36 | 375 | F475W | ||||
| j8fs59kjq | 16:38:07 | 375 | F475W | ||||
| 60 | 1087 | 2003-01-31 | j8fs60txq | 19:23:16 | 280.79 | 90 | F850LP |
| j8fs60tyq | 19:27:04 | 560 | F850LP | ||||
| j8fs60u0q | 19:38:40 | 560 | F850LP | ||||
| j8fs60u2q | 19:50:53 | 375 | F475W | ||||
| j8fs60u4q | 19:59:24 | 375 | F475W | ||||
| 61 | 1297 | 2003-02-25 | j8fs61n8q | 14:58:09 | 243.38 | 90 | F850LP |
| j8fs61n9q | 15:01:57 | 560 | F850LP | ||||
| j8fs61nbq | 15:13:33 | 560 | F850LP | ||||
| j8fs61ndq | 15:25:46 | 375 | F475W | ||||
| j8fs61nfq | 15:34:17 | 375 | F475W | ||||
| 62 | 1861 | 2003-11-20 | j8fs62lbq | 23:52:41 | 300.80 | 90 | F850LP |
| j8fs62lcq | 23:56:29 | 560 | F850LP | ||||
| 2003-11-21 | j8fs62leq | 00:08:05 | 560 | F850LP | |||
| j8fs62lgq | 00:20:18 | 375 | F475W | ||||
| j8fs62liq | 00:28:49 | 375 | F475W | ||||
| 63 | 543 | 2003-02-25 | j8fs63mrq | 13:21:25 | 249.98 | 90 | F850LP |
| j8fs63msq | 13:25:13 | 560 | F850LP | ||||
| j8fs63muq | 13:36:49 | 560 | F850LP | ||||
| j8fs63mwq | 13:49:02 | 375 | F475W | ||||
| j8fs63myq | 13:57:33 | 375 | F475W | ||||
| 64 | 1431 | 2003-01-10 | j8fs64ccq | 23:45:46 | 300.00 | 90 | F850LP |
| j8fs64cdq | 23:49:34 | 560 | F850LP | ||||
| 2003-01-11 | j8fs64cfq | 00:01:10 | 560 | F850LP | |||
| j8fs64chq | 00:13:22 | 375 | F475W | ||||
| j8fs64cjq | 00:21:54 | 375 | F475W | ||||
| 65 | 1528 | 2003-01-22 | j8fs65whq | 19:15:22 | 285.27 | 90 | F850LP |
| j8fs65wiq | 19:19:10 | 560 | F850LP | ||||
| j8fs65wkq | 19:30:46 | 560 | F850LP | ||||
| j8fs65wmq | 19:42:59 | 375 | F475W | ||||
| j8fs65woq | 19:51:30 | 375 | F475W | ||||
| 66 | 1695 | 2003-02-01 | j8fs66clq | 19:24:47 | 281.96 | 90 | F850LP |
| j8fs66cmq | 19:28:35 | 560 | F850LP | ||||
| j8fs66coq | 19:40:11 | 560 | F850LP | ||||
| j8fs66cqq | 19:52:24 | 375 | F475W | ||||
| j8fs66csq | 20:00:55 | 375 | F475W | ||||
| 67 | 1833 | 2003-03-20 | j8fs67baq | 18:37:57 | 213.63 | 90 | F850LP |
| j8fs67bbq | 18:41:45 | 560 | F850LP | ||||
| j8fs67bdq | 18:53:21 | 560 | F850LP | ||||
| j8fs67bfq | 19:05:34 | 375 | F475W | ||||
| j8fs67bhq | 19:14:05 | 375 | F475W | ||||
| 68 | 437 | 2003-07-15 | j8fs68mhq | 10:19:56 | 106.81 | 90 | F850LP |
| j8fs68miq | 10:23:44 | 560 | F850LP | ||||
| j8fs68mkq | 10:35:20 | 560 | F850LP | ||||
| j8fs68mmq | 10:47:33 | 375 | F475W | ||||
| j8fs68moq | 10:56:04 | 375 | F475W | ||||
| 69 | 2019 | 2003-03-19 | j8fs69tnq | 18:37:08 | 224.18 | 90 | F850LP |
| j8fs69toq | 18:40:56 | 560 | F850LP | ||||
| j8fs69tqq | 18:52:33 | 560 | F850LP | ||||
| j8fs69tsq | 19:04:46 | 375 | F475W | ||||
| j8fs69tuq | 19:13:17 | 375 | F475W | ||||
| 70 | 33 | 2003-07-15 | j8fs70l0q | 05:30:55 | 107.56 | 90 | F850LP |
| j8fs70l1q | 05:34:43 | 560 | F850LP | ||||
| j8fs70l3q | 05:46:19 | 560 | F850LP | ||||
| j8fs70l5q | 05:58:32 | 375 | F475W | ||||
| j8fs70l7q | 06:07:03 | 375 | F475W | ||||
| 71 | 200 | 2003-06-11 | j8fs71qxq | 11:34:02 | 115.21 | 90 | F850LP |
| j8fs71qyq | 11:37:50 | 560 | F850LP | ||||
| j8fs71r0q | 11:49:26 | 560 | F850LP | ||||
| j8fs71r2q | 12:01:39 | 375 | F475W | ||||
| j8fs71r4q | 12:10:10 | 375 | F475W | ||||
| 72 | 571 | 2003-06-23 | j8fs72d0q | 11:40:35 | 119.80 | 90 | F850LP |
| j8fs72d1q | 11:44:23 | 560 | F850LP | ||||
| j8fs72d3q | 11:55:59 | 560 | F850LP | ||||
| j8fs72d5q | 12:08:12 | 375 | F475W | ||||
| j8fs72d7q | 12:16:43 | 375 | F475W | ||||
| 73 | 21 | 2003-05-20 | j8fs73nrq | 14:34:15 | 131.80 | 90 | F850LP |
| j8fs73nsq | 14:38:03 | 560 | F850LP | ||||
| j8fs73nuq | 14:49:39 | 560 | F850LP | ||||
| j8fs73nwq | 15:01:52 | 375 | F475W | ||||
| j8fs73nyq | 15:10:23 | 375 | F475W | ||||
| 74 | 1488 | 2003-07-13 | j8fs74x8q | 19:55:08 | 113.01 | 90 | F850LP |
| j8fs74x9q | 19:58:56 | 560 | F850LP | ||||
| j8fs74xbq | 20:10:32 | 560 | F850LP | ||||
| j8fs74xdq | 20:22:45 | 375 | F475W | ||||
| j8fs74xfq | 20:31:16 | 375 | F475W | ||||
| 75 | 1779 | 2003-07-19 | j8fs75lwq | 08:46:03 | 104.01 | 90 | F850LP |
| j8fs75lxq | 08:49:51 | 560 | F850LP | ||||
| j8fs75lzq | 09:01:27 | 560 | F850LP | ||||
| j8fs75m1q | 09:13:40 | 375 | F475W | ||||
| j8fs75m3q | 09:22:11 | 375 | F475W | ||||
| 76 | 1895 | 2003-07-12 | j8fs76m2q | 11:57:17 | 108.01 | 90 | F850LP |
| j8fs76m3q | 12:01:05 | 560 | F850LP | ||||
| j8fs76m5q | 12:12:41 | 560 | F850LP | ||||
| j8fs76m7q | 12:24:54 | 375 | F475W | ||||
| j8fs76m9q | 12:33:25 | 375 | F475W | ||||
| 77 | 1499 | 2003-07-14 | j8fs77b4q | 03:55:42 | 110.21 | 90 | F850LP |
| j8fs77b5q | 03:59:30 | 560 | F850LP | ||||
| j8fs77b7q | 04:11:06 | 560 | F850LP | ||||
| j8fs77b9q | 04:23:19 | 375 | F475W | ||||
| j8fs77bbq | 04:31:50 | 375 | F475W | ||||
| 78 | 1545 | 2003-07-14 | j8fs78ccq | 05:31:40 | 110.61 | 90 | F850LP |
| j8fs78cdq | 05:35:28 | 560 | F850LP | ||||
| j8fs78cfq | 05:47:04 | 560 | F850LP | ||||
| j8fs78chq | 05:59:17 | 375 | F475W | ||||
| j8fs78cjq | 06:07:48 | 375 | F475W | ||||
| 79 | 1192 | 2003-06-06 | j8fs79fwq | 14:45:00 | 130.00 | 90 | F850LP |
| j8fs79fxq | 14:48:48 | 560 | F850LP | ||||
| j8fs79fzq | 15:00:24 | 560 | F850LP | ||||
| j8fs79g1q | 15:12:37 | 375 | F475W | ||||
| j8fs79g3q | 15:21:08 | 375 | F475W | ||||
| 80 | 1857 | 2003-04-17 | j8fs80lhq | 10:58:12 | 148.00 | 90 | F850LP |
| j8fs80liq | 11:02:00 | 560 | F850LP | ||||
| j8fs80lkq | 11:13:36 | 560 | F850LP | ||||
| j8fs80lmq | 11:25:49 | 375 | F475W | ||||
| j8fs80loq | 11:34:20 | 375 | F475W | ||||
| 81 | 1075 | 2003-07-14 | j8fs81cxq | 07:07:09 | 106.61 | 90 | F850LP |
| j8fs81cyq | 07:10:57 | 560 | F850LP | ||||
| j8fs81d0q | 07:22:33 | 560 | F850LP | ||||
| j8fs81d2q | 07:34:46 | 375 | F475W | ||||
| j8fs81d4q | 07:43:17 | 375 | F475W | ||||
| 82 | 1948 | 2003-07-14 | j8fs82deq | 08:44:04 | 112.21 | 90 | F850LP |
| j8fs82dfq | 08:47:52 | 560 | F850LP | ||||
| j8fs82dhq | 08:59:28 | 560 | F850LP | ||||
| j8fs82djq | 09:11:41 | 375 | F475W | ||||
| j8fs82dlq | 09:20:12 | 375 | F475W | ||||
| 83 | 1627 | 2003-01-22 | j8fs83wzq | 20:51:27 | 285.77 | 90 | F850LP |
| j8fs83x0q | 20:55:15 | 560 | F850LP | ||||
| j8fs83x2q | 21:06:51 | 560 | F850LP | ||||
| j8fs83x4q | 21:19:04 | 375 | F475W | ||||
| j8fs83x6q | 21:27:35 | 375 | F475W | ||||
| 84 | 1440 | 2003-07-13 | j8fs84v0q | 11:57:56 | 108.38 | 90 | F850LP |
| j8fs84v1q | 12:01:44 | 560 | F850LP | ||||
| j8fs84v3q | 12:13:20 | 560 | F850LP | ||||
| j8fs84v5q | 12:25:33 | 375 | F475W | ||||
| j8fs84v7q | 12:34:04 | 375 | F475W | ||||
| 85 | 230 | 2003-07-15 | j8fs85llq | 07:07:01 | 107.41 | 90 | F850LP |
| j8fs85lmq | 07:10:49 | 560 | F850LP | ||||
| j8fs85loq | 07:22:25 | 560 | F850LP | ||||
| j8fs85lqq | 07:34:38 | 375 | F475W | ||||
| j8fs85lsq | 07:43:09 | 375 | F475W | ||||
| 86 | 2050 | 2003-03-23 | j8fs86v1q | 17:03:34 | 220.38 | 90 | F850LP |
| j8fs86v2q | 17:07:22 | 560 | F850LP | ||||
| j8fs86v4q | 17:18:58 | 560 | F850LP | ||||
| j8fs86v6q | 17:31:11 | 375 | F475W | ||||
| j8fs86v8q | 17:39:42 | 375 | F475W | ||||
| 87 | 1993 | 2003-01-31 | j8fs87rcq | 14:36:10 | 282.30 | 90 | F850LP |
| j8fs87rdq | 14:39:58 | 560 | F850LP | ||||
| j8fs87rfq | 14:51:34 | 560 | F850LP | ||||
| j8fs87rhq | 15:03:47 | 375 | F475W | ||||
| j8fs87rjq | 15:12:18 | 375 | F475W | ||||
| 88 | 751 | 2003-06-19 | j8fs88xjq | 08:24:44 | 120.01 | 90 | F850LP |
| j8fs88xks | 08:28:32 | 560 | F850LP | ||||
| j8fs88xmq | 08:40:08 | 560 | F850LP | ||||
| j8fs88xoq | 08:52:21 | 375 | F475W | ||||
| j8fs88xqq | 09:00:52 | 375 | F475W | ||||
| 89 | 1828 | 2003-01-31 | j8fs89scq | 16:11:59 | 282.24 | 90 | F850LP |
| j8fs89sdq | 16:15:47 | 560 | F850LP | ||||
| j8fs89sfq | 16:27:23 | 560 | F850LP | ||||
| j8fs89shq | 16:39:36 | 375 | F475W | ||||
| j8fs89sjq | 16:48:07 | 375 | F475W | ||||
| 90 | 538 | 2003-07-14 | j8fs90dvq | 10:18:27 | 110.20 | 90 | F850LP |
| j8fs90dwq | 10:22:15 | 560 | F850LP | ||||
| j8fs90dyq | 10:33:51 | 560 | F850LP | ||||
| j8fs90e0q | 10:46:04 | 375 | F475W | ||||
| j8fs90e2q | 10:54:35 | 375 | F475W | ||||
| 91 | 1407 | 2003-07-15 | j8fs91jgq | 02:19:49 | 110.81 | 90 | F850LP |
| j8fs91jhq | 02:23:37 | 560 | F850LP | ||||
| j8fs91jjq | 02:35:13 | 560 | F850LP | ||||
| j8fs91jlq | 02:47:26 | 375 | F475W | ||||
| j8fs91jnq | 02:55:57 | 375 | F475W | ||||
| 92 | 1886 | 2003-07-15 | j8fs92klq | 03:56:27 | 110.81 | 90 | F850LP |
| j8fs92kmq | 04:00:15 | 560 | F850LP | ||||
| j8fs92koq | 04:11:51 | 560 | F850LP | ||||
| j8fs92kqq | 04:24:04 | 375 | F475W | ||||
| j8fs92ksq | 04:32:35 | 375 | F475W | ||||
| 93 | 1199 | 2003-02-24 | j8fs93i3q | 22:58:17 | 253.79 | 90 | F850LP |
| j8fs93i4q | 23:02:05 | 560 | F850LP | ||||
| j8fs93i6q | 23:13:41 | 560 | F850LP | ||||
| j8fs93i8q | 23:25:54 | 375 | F475W | ||||
| j8fs93iaq | 23:34:25 | 375 | F475W | ||||
| 94 | 1743 | 2003-07-18 | j8fs94grq | 10:21:12 | 107.41 | 90 | F850LP |
| j8fs94gsq | 10:25:00 | 560 | F850LP | ||||
| j8fs94guq | 10:36:36 | 560 | F850LP | ||||
| j8fs94gwq | 10:48:49 | 375 | F475W | ||||
| j8fs94gyq | 10:57:20 | 375 | F475W | ||||
| 95 | 1539 | 2003-06-24 | j8fs95jgq | 08:29:37 | 113.81 | 90 | F850LP |
| j8fs95jhq | 08:33:25 | 560 | F850LP | ||||
| j8fs95jjq | 08:45:01 | 560 | F850LP | ||||
| j8fs95jlq | 08:57:14 | 375 | F475W | ||||
| j8fs95jnq | 09:05:45 | 375 | F475W | ||||
| 96 | 1185 | 2003-07-11 | j8fs96fnq | 10:18:30 | 114.21 | 90 | F850LP |
| j8fs96foq | 10:22:18 | 560 | F850LP | ||||
| j8fs96fqq | 10:33:54 | 560 | F850LP | ||||
| j8fs96fsq | 10:46:07 | 375 | F475W | ||||
| j8fs96fuq | 10:54:38 | 375 | F475W | ||||
| 97 | 1826 | 2003-01-21 | j8fs97lrq | 17:38:15 | 278.39 | 90 | F850LP |
| j8fs97lsq | 17:42:03 | 560 | F850LP | ||||
| j8fs97luq | 17:53:39 | 560 | F850LP | ||||
| j8fs97lwq | 18:05:52 | 375 | F475W | ||||
| j8fs97lyq | 18:14:23 | 375 | F475W | ||||
| 98 | 1512 | 2003-07-19 | j8fs98kxq | 05:33:22 | 106.21 | 90 | F850LP |
| j8fs98kyq | 05:37:10 | 560 | F850LP | ||||
| j8fs98l0q | 05:48:46 | 560 | F850LP | ||||
| j8fs98l2q | 06:00:59 | 375 | F475W | ||||
| j8fs98l4q | 06:09:30 | 375 | F475W | ||||
| 99 | 1489 | 2003-07-15 | j8fs99m2q | 08:43:52 | 111.61 | 90 | F850LP |
| j8fs99m3q | 08:47:40 | 560 | F850LP | ||||
| j8fs99m5q | 08:59:16 | 560 | F850LP | ||||
| j8fs99m7q | 09:11:29 | 375 | F475W | ||||
| j8fs99m9q | 09:20:00 | 375 | F475W | ||||
| 100 | 1661 | 2003-12-25 | j8fsa0f4q | 23:56:43 | 289.99 | 90 | F850LP |
| 2003-12-26 | j8fsa0f5q | 00:00:31 | 560 | F850LP | |||
| j8fsa0f7q | 00:12:07 | 560 | F850LP | ||||
| j8fsa0f9q | 00:24:20 | 375 | F475W | ||||
| j8fsa0fbq | 00:32:51 | 375 | F475W |