DUST DEPLETION AND EXTINCTION IN A GAMMA-RAY BURST AFTERGLOW
Abstract
We put stringent constraints for the first time on the dust properties in the circumburst medium of a gamma-ray burst (GRB) afterglow. This is based on the optical spectrum of GRB 020813 (), obtained with Keck I LRIS 4.65 h after the burst. From the absorption lines in the spectrum, we derive very high column densities for six heavy elements with different refractory properties. The relative abundances resemble the dust depletion patterns in the Milky Way, from which we infer a visual extinction of and at 95% confidence level. However, the high columns of metals and dust contrast with an observed UV continuum spectrum that is remarkably close to a power law of the form , with no sign of curvature, or a 2200 Å extinction feature, suggesting low reddening. The Milky Way or Magellanic Cloud reddenings are possible only for very low visual extinctions ( or , respectively at 95% confidence), inconsistent with the values inferred from the depletion analysis. If we assume a GRB intrinsic spectrum and an extinction law of the forms and , we obtain (for ) the constraints from continuum spectrum: and .
Subject headings:
cosmology: observations – gamma rays: bursts – galaxies: abundances – ISM: dust, extinction1. Introduction
Long-duration gamma-ray bursts (GRBs) are probably associated with core-collapse supernovae (Hjorth et al. 2003a) and can be used to probe the interstellar medium of their star-forming environments. One of the open issues on the nature of GRBs is the dust properties in the circumburst medium. On the one hand, high heavy-element column densities have been measured in a few GRB afterglow spectra (Savaglio et al. 2003; Vreeswijk et al. 2004), suggesting that the dust content might be important, especially if star formation is very active. On the other hand, the spectral energy distribution (SED) of other GRB afterglows indicates that dust reddening is surprisingly low (Galama & Wijers 2001; Hjorth et al. 2003b). Up to now, a simultaneous analysis of heavy-element abundances to measure the dust depletion, and of a suitable UV/optical spectrum to estimate the dust extinction law, in the same GRB, has never been done. Afterglows fade so rapidly that obtaining high-quality spectra, for a full investigation of the dust properties, is very difficult.
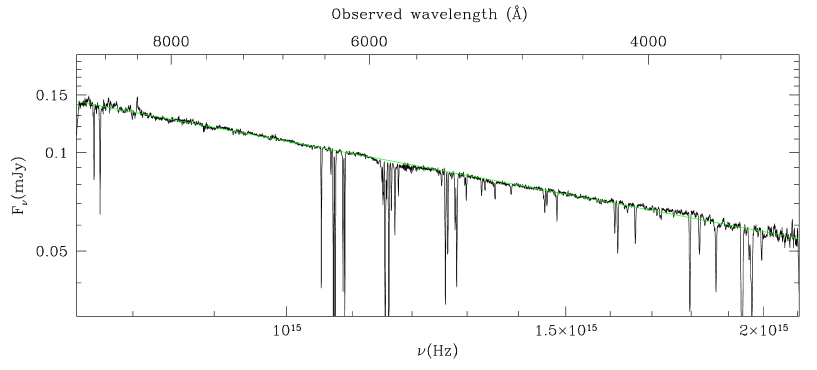
The spectrum of GRB 020813, obtained recently by Barth et al. (2003), offers us this opportunity. The optical spectrum has a very high signal-to-noise ratio (S/N), is very well flux-calibrated, and shows very little deviation from a perfect power law over a large wavelength interval ( in Å rest frame; Fig. 1). Moreover, the absorption lines of numerous different elements, with different refractory properties, have been detected with exceptional accuracy, thanks to the excellent spectral resolution. By visually inspecting the GRB spectrum, it can already be noticed that there is no sign of the 2200 Å extinction feature ( Hz), or curvature on even larger wavelength intervals, suggesting either an extinction law different from the Galactic type or a low dust content.
Our approach to studying the dust depletion is similar to what has been done routinely for years for strong absorption systems detected in QSO spectra, the so-called damped Ly (DLA) systems. The spectrum of GRB 020813 shows similar absorption features, most of which are associated with low-ionization species, so we consider this absorption system a GRB-DLA. Barth et al. (2003) detected seven low-ionization species (Fe II, Si II, Zn II, Cr II, Mn II, Mg II and Al II), and the lines are so strong that the absorbing gas is very likely neutral (H H I). QSO-DLAs provide detailed information on the neutral interstellar medium (ISM) of high redshift galaxies (Prochaska 2004 and references therein).
Our paper is structured as follows: in §2, we describe the measurement of the heavy-element column densities in the GRB 020813 circumburst medium; in §3 we derive the heavy-element depletion pattern; in §4 the visual extinction is estimated; in §5 we constrain, given the dust depletion, the extinction curve; and in §6 we summarize the results.
| Ion | [cm-2] | (km s-1) | [X/Zn] |
|---|---|---|---|
| Zn II | 62bbDoppler parameter is assumed to be the same as for Fe II. | ||
| Si II | |||
| Si II∗ | 56ccDoppler parameter is assumed to be the same as for Si II. | ||
| Mn II | |||
| Cr II | 62bbDoppler parameter is assumed to be the same as for Fe II. | ||
| Fe II | |||
| Ni II | |||
| Ti II | dd4 upper limit, obtained assuming km s-1. | ||
| Mg II | 62bbDoppler parameter is assumed to be the same as for Fe II. | ||
| Mg I | |||
| Al II | eeColumn density estimated using the curve of growth. | 62bbDoppler parameter is assumed to be the same as for Fe II. | |
| C I | dd4 upper limit, obtained assuming km s-1. | ||
| Ca II | ffCa II shows three absorbing components. |
2. Measurements of Heavy-element Column Densities
For the analysis of the GRB 020813 afterglow, we use the spectrum obtained with the LRIS spectrograph on the Keck I telescope in 2002 August 13 (Barth et al. 2003). The observations were made 4.65 h after the HETE-2 detection (Villaseñor et al. 2002) when the visual magnitude was . The observed spectral range is Å, and the resolution is Å per pixel, or FWHM km s-1 from the blue to the red end. The signal-to-noise ratio in the hour total exposure is very good, S/N , making this optical spectrum one of the best in terms of resolution and S/N ever obtained for a GRB afterglow. The spectrum of GRB 020813, after correction for Galactic extinction (; Schlegel et al. 1998), is shown in Figure 1. Barth et al. (2003) reported the equivalent widths of detected absorption lines, and identified two absorption systems, at and (see their Table 2). The former is very likely the redshift of the GRB. The lower-redshift system intersects the GRB line of sight, at a comoving distance111We adopt cosmological parameters , , and . of about 13 Mpc from the GRB. We fitted Voigt profiles to the absorption lines to determine column densities for both absorption systems, and cross-checked the results by using the curve-of-growth analysis (COG; Spitzer 1978) or the apparent optical depth method (Savage & Sembach 1991). As the intervening system at has low metal column densities ( times lower than the system), we neglect its dust extinction ( mag in the optical).
The absorption lines associated with the circumburst medium of GRB 020813 are numerous, and their equivalent widths in many cases deviate little from the linear part of the COG (rest-frame Å), allowing a good determination of column densities. The main uncertainty is the total number of absorbing components, which is not known because of the finite resolution and the intrinsic blending of lines. Although the multiple absorbing components appear as a single line, the single-component approximation still gives robust results (Jenkins 1986; Savage & Sembach 1991). However, in this case, the width of the lines is an effective Doppler parameter and does not provide useful information on the temperature of the gas. Parameters of all lines relevant for this work (and 1 errors) and abundances relative to zinc are given in Table 1. We adopt the common assumption, valid for neutral gas (), that the abundances of ions with ionization potentials above 13.6 eV, are very close to the total abundance of the corresponding element: , , , etc. We discuss possible contamination by high-ionization species (C IV and Al III) and ionization corrections in §2.2.
2.1. Low-ionization Absorption Lines
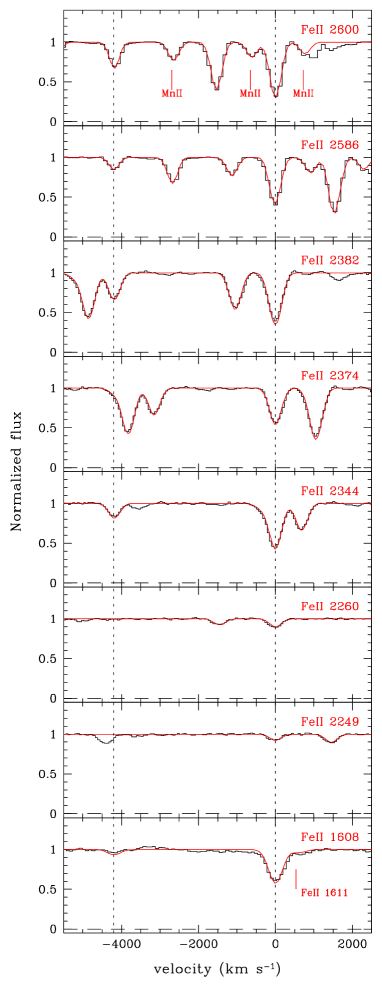
Figure 2 shows, in velocity space, the best-fit Voigt profiles for the Fe II absorption in the GRB-DLA and in the intervening system at , which marginally contaminates the GRB-DLA Fe II absorption. In the top and bottom panels, we also indicate the GRB-DLA Mn II triplet and the very weak Fe II line, respectively. Since many Fe II lines have large equivalent widths, we estimate the uncertainty due to saturation by considering the weakest transitions, Fe II ( Å). Using the COG, we derive and km s-1. This column density is consistent with (although less certain than) the one derived by profile fitting ( and ). Using the apparent optical depth method, which gives reliable results when the line profile is not known, we obtain , in agreement with the profile-fitting result.
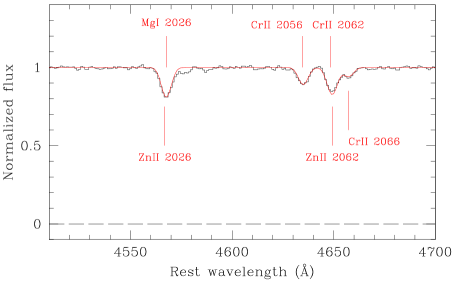
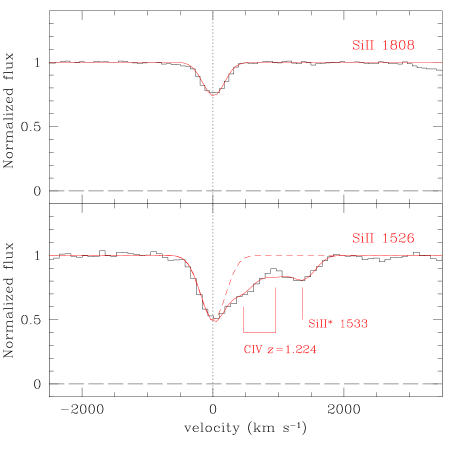
In Figure 3 we show the profile fits for Zn II, Cr II, and Mg I. The Mg I line marginally contaminates Zn II and is constrained by Mg I at Å. The Doppler parameter for Zn II and Cr II is very uncertain and thus has been assumed to be the same as for Fe II. Changing by km s-1 does not have a significant effect on the column densities. In general, the column densities of lines with small equivalent widths depend only weakly on the Doppler parameter. Figure 4 shows, in velocity space, the best-fit Si II profiles. Although the Si II line is contaminated by the C IV doublet, the fit is well constrained by the blue side of the line and by the Si II absorption.
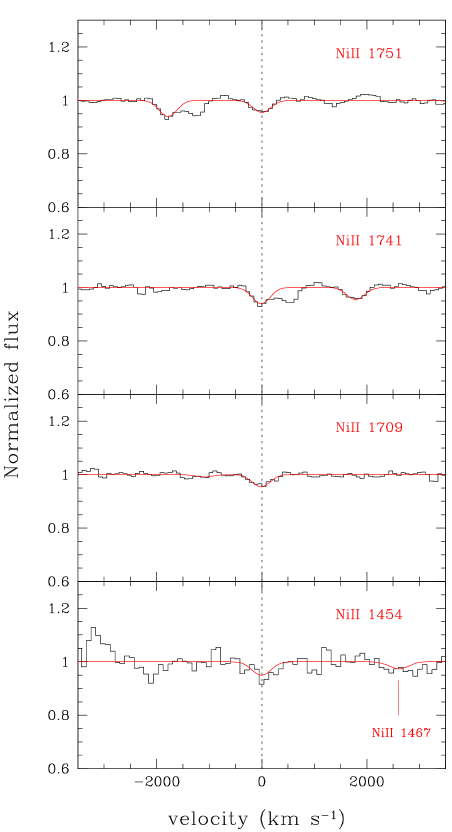
In Figure 5, we show 4 weak ( Å) Ni II lines, not identified by Barth et al. (2003), together with the best-fit profile. In the observed wavelength range, there are also three Ti II transitions. Two are not detected, while a third, the stronger Ti II line, falls in the wavelength range of the telluric absorption at Å. However, we can still infer an interesting upper limit on the column density.
The column densities of Mg II and Al II are very uncertain because these lines are heavily saturated. The presence of relatively strong Mg I and Ca II absorption (ionization potential below 8 eV) is another indication that the gas is mainly neutral. The non-detection of the relatively strong transition C I provides an upper limit for the column density.
2.2. Higher Ionization Lines and the Ionization Correction
The spectrum of GRB 020813 shows the higher ionization lines of C IV and Al III. We use these lines to demonstrate that the ionized gas is a small fraction of the total and that the ionization correction can be neglected. Al III and Al II absorptions were used to study the ionization state of the interstellar medium in QSO-DLAs (Howk & Sembach 1999).
The C IV column density is very likely a small fraction of the total C column density in our GRB circumburst gas, because the product of the wavelength and the oscillator strength for C IV is twice that for Fe II , the cosmic abundance of C is 10 times higher than that of Fe, and C is usually much less depleted than Fe in dust ( times). Therefore, if C IV gas were a large fraction of the total C gas, we would expect the equivalent width of C IV to be much higher than that of Fe II . However, the observed equivalent widths are 1.31 and 1.42 Å for C IV and Fe II , respectively (Barth et al. 2003), showing that the dominant ionization state of C is not C IV. Indeed we estimate that the C IV column density is , compared with an expected total C column density (in gas form) of .
For Al, the ionization correction is less certain. The Al III doublet gives a column density of (if its value is the same as that of Fe II). Al II shows only the very strong line at Å, for which we obtain (assuming as in Fe II), thus Al III can only be a small correction of the total Al. If is left as a free parameter, the Al III column density is even smaller, although not by much. We also note once more that most likely some Al III is located in a different, more ionized region in the host galaxy.
| Element | WHaaEffective Doppler parameter. | WDHbbWarm disk+halo depletion pattern. | WDccWarm disk depletion pattern. | CDddCool disk depletion pattern. | |
|---|---|---|---|---|---|
| Zn | |||||
| Si | |||||
| Mn | |||||
| Cr | |||||
| Fe | |||||
| Ni | |||||
2.3. The Si II∗ Transition
The spectrum of GRB 020813 also shows the ground fine-structure Si II∗ transition, from which we derive
| (1) |
The Si II∗ absorption was detected by Barth et al. (2003), but not identified. The ratio can in principle be used to determine the physical conditions of the gas (Bahcall & Wolf 1968). Theoretical predictions as a function of the gas temperature, gas density, and electron density have been made and compared with observations in QSO spectra (Srianand & Petitjean 2000; Srianand & Petitjean 2001; Silva & Viegas 2002). The ratio we find in this GRB-DLA is times lower than the value measured in a QSO highly ionized region (Srianand & Petitjean 2001). Although it is not possible to derive the density of the gas without knowing its temperature, the difference between the high-ionization gas in this QSO and GRB 020813 suggests a different physical nature.
The Si II∗ transition was detected for the first time in a GRB afterglow by Vreeswijk et al. (2004), who reported a low value of the column density ratio, . This GRB-DLA shows a very high H I column density (). Its gas is probably neutral, not only for the large H I column density, but also because the Al III column density (estimated by us using the reported doublet equivalent widths) is more than 10 times smaller than the expected total column of Al. We conclude that a low value of the ratio (also found in our GRB-DLA) does not imply that the gas is ionized. The presence of Si II∗ is an important result that deserves further attention to understand better the physical conditions of the circumburst medium.
3. Dust-Depletion Pattern
The absorption lines detected in the GRB spectrum give the column densities of heavy elements in the gas phase only. Thus, as different elements are locked in dust grains by different amounts, the column densities measured from absorption lines carry the signature of the chemical composition of the dust, i.e. the depletion pattern.
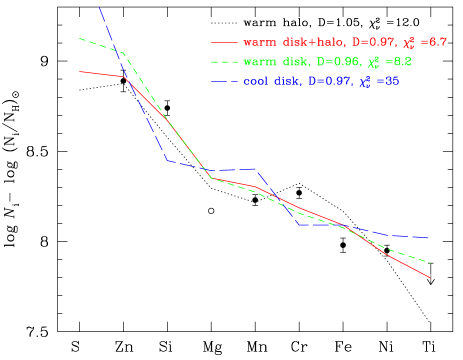
We have accurate column density measurements of six heavy elements: zinc, chromium, silicon, manganese, iron and nickel, plus a stringent upper limit for titanium (Table 1). To derive the dust-depletion pattern, we compare these column densities with several dust-depletion patterns in the Milky Way (Savage & Sembach 1996): warm halo (WH), warm disk+halo (WDH), warm disk (WD), and cool disk (CD).
We consider each of the four Milky Way (MW) depletion patterns as a model and denote by the expected column density of element in such a model to be compared with the corresponding observed column density in the GRB spectrum. In our approach, is also a function of the dust-to-metals ratio relative to the Galactic values ():
| (2) |
Here is the Galactic fraction of element in the gas phase and is the total (gas and dust phase) column density of the same element in the GRB-DLA. To express , we define as the relative heavy-element abundance
| (3) |
where is the total column density of metals in the GRB-DLA. For convenience, we express in terms of solar abundances (Gravesse & Sauval 1998): , where is a constant. To obtain the best depletion model, we minimize the reduced
| (4) |
where is the number of elements in the fit and is the error on the observed column density. We have defined the using logarithmic quantities, because the observational errors have an approximate lognormal distribution. Using the observed column densities, we find four solutions (one for each of the four depletion patterns) with four different and values. In Figure 6, we plot the column densities relative to solar abundances (both on a log scale) for the observed elements, together with the four best-fit models. The WH, WDH, and WD depletion patterns give very similar , whereas the CD pattern gives a worse fit. The results are similar if the errors on all the column densities are assumed to be equal. In Table 2, we report the total (gas+dust) column densities expected if the different depletion patterns in the MW are taken as models. The errors listed in Table 2 are the combination of 1 measurement errors and the deviations between the expectations given by the depletion models and the measured values. In Table 3 we present the overall dust parameters.
| Parameters | WHaaWarm halo depletion pattern. | WDHbbWarm disk+halo depletion pattern. | WDccWarm disk depletion pattern. | CDddCool disk depletion pattern. |
|---|---|---|---|---|
| 1.05 | 0.97 | 0.96 | 0.97 | |
4. Extinction from Depletion Pattern
The extinction is proportional to the column of dust along the line of sight. In the solar neighborhood, a gas cloud with cm-2 H I column density has visual extinction (Bohlin et al. 1978). The value of is about 1/4 lower in a Large Magellanic Cloud (LMC) cloud with similar H I column density (Prevot et al. 1984); however, this is compensated by the lower metallicity (1/4 solar). Therefore, the visual extinctions for two clouds with similar columns of metals, one in the LMC and another in the solar neighborhood, are similar. The dust depletion in our GRB-DLA (where [Fe/Zn] ) is closer to that in the LMC than that in the SMC ([Fe/Zn] in the former, [Fe/Zn] in the latter; Welty et al. 1997).
If the dust in the GRB 020813 circumburst medium were like that in the MW or LMC, we would derive a visual extinction related to the column density of dust by
| (5) |
Here and are the dust and metal columns, respectively, for a cm-2 gas cloud with solar metallicity, and and , as before, are the dust-to-metals ratio and the total metal column in our GRB-DLA. The and values (and relative 1 errors) are listed in Table 3. The inferred values are all higher than 0.3 (95% confidence level), with a best fit, obtained for the WDH depletion pattern (Fig. 6) of .
4.1. QSO-DLAs and GRB-DLAs
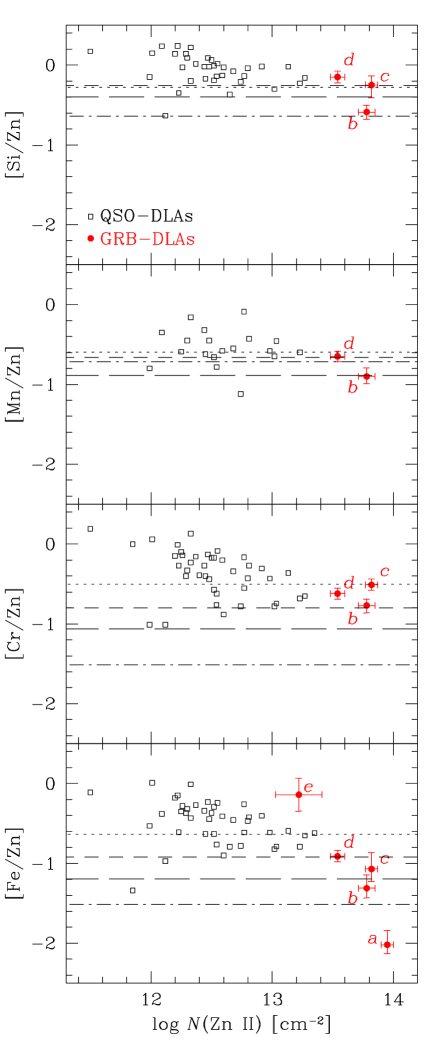
The QSO-DLAs are usually considered to be representative of the ISM of the whole population of galaxies at high redshifts. The dust effects in QSO-DLAs are generally small: the visual extinction in 44 QSO-DLAs (with detected Zn II, ) inferred using the same approach as above, is always . This difference from the extinction in the GRB 020813 circumburst medium () is indicated by the lower Zn II column densities and the larger [Fe/Zn] values typically seen in QSO-DLAs (zinc and iron are among the least and most depleted elements, respectively). This is illustrated in the bottom panel of Figure 7.
The difference between GRB-DLAs and QSO-DLAs may be the result of an observational bias: QSO-DLAs are generally found in the foreground of optically selected QSOs, and dusty QSO-DLAs are hard to find in such samples (Fall & Pei 1993). GRBs are (at least for some time) much brighter than QSOs and are detected by gamma-rays and so might be much less affected by this bias. Moreover, we know that GRBs are located in star-forming regions, where the densities are presumably higher than average, and large column densities of dust are not surprising.
The elements Cr, Mn, and Si (in addition to Fe) also indicate relatively high dust depletion in GRB 020813 (Fig. 7). Similar high depletions were found in the circumburst medium of three other GRBs (Savaglio et al. 2003). In another GRB-DLA (in GRB 030323), the [Fe/S] is consistent with zero, indicating little or no dust depletion (Vreeswijk et al. 2004). Since Zn II is not measured in this object, while S II is, we assume [Zn/S] and report this point in Figure 7.
5. Extinction from Continuum Spectrum
The presence of dust in the GRB circumburst medium can affect the observed GRB continuum spectrum. The GRB extinction law has never been determined by observation and is not known a priori. From the lack of apparent reddening in many GRB spectra, it has been concluded in those cases that dust is absent or that the extinction law is a weak function of the wavelength (gray extinction; Stratta et al. 2004). Perna et al. (2003) have shown, using numerical simulations, that the GRB X-ray/UV radiation field can significantly flatten the dust extinction curve.
We have already derived the heavy-element depletion pattern in GRB 020813, from which we inferred the visual extinction to be relatively high, , assuming the same rate of visual extinction as in the MW or LMC per unit of metal column density. However, the observed spectrum shows very little deviation from a perfect power law and no sign of the 2200 Å extinction feature (Fig. 1), which allows us to place strong constraints on the extinction curve of the intervening dust. We use a fairly general approach, namely, we assume that the intrinsic GRB emission is a power law
| (6) |
where and are not fixed a priori, and we apply a dust extinction law of the form
| (7) |
We vary , , and , and compare the corresponding model spectrum with the observed GRB 020813 spectrum using minimization. Because we are mainly interested in the confidence levels (CL) of only two of these four parameters ( and ), we project the four-dimensional confidence regions in the and space.
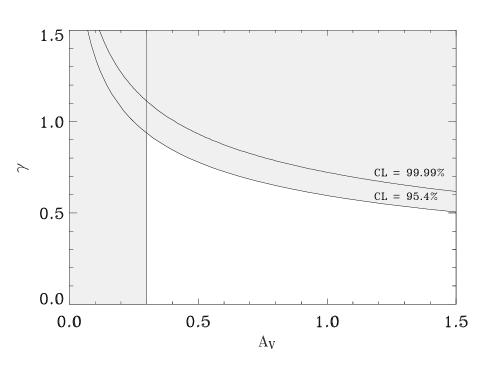
In Figure 8 we show versus for constant CL (solid lines). For (as inferred from the dust depletion), any value of between and 0 is allowed (95% CL), and this would give an intrinsic GRB spectral slope . The shaded vertical region is the one excluded by our depletion-pattern analysis.
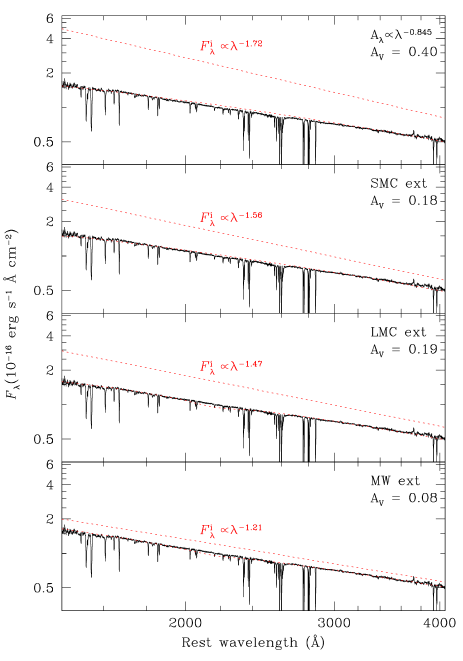
We also calculated the maximum values (95% CL) obtained with MW, LMC, and SMC extinction curves. For the MW and LMC extinctions, these give and , respectively, resulting from the absence of the 2200 Å extinction feature in the observed GRB spectrum. For the SMC extinction, which has a very weak 2200 Å bump, the constraint is .
In Figure 9, we show the intrinsic and reddened GRB model spectrum as compared to the observed spectrum. For the MW and MC extinction curves, this is done for the maximum allowed value (bottom three panels), while for the power-law extinction (top panel), is assumed. Since the upper limits on the visual extinctions inferred from MW and MC reddening () are smaller than the lower limits inferred from the depletions (), we have reached a contradiction and are forced to conclude that the dust in the circumburst medium of GRB 020813 cannot be like that in the MW and MC in all respects (both chemical and optical properties). We note that although variations in the extinction law in different OB association stars have been found in the MW (Fitzpatrick & Massa 1988), the presence of the 2200 Å bump is still very clear and would not be consistent with the observed GRB spectrum.
6. Summary and Conclusions
In this work, we studied, for the first time simultaneously, the dust depletion pattern and the extinction law in the circumburst medium of GRB 020813. Very little is known about the dust properties in the circumburst medium of any other GRB, mainly because the emission flux declines so rapidly that optical spectra are very hard to obtain.
An excellent optical spectrum of the GRB 020813 afterglow () was obtained with the Keck I LRIS hr after the burst by Barth et al. (2003), when the GRB was still rather bright (19th mag in the optical). From the numerous and strong absorption lines detected in the spectrum, we measured the column density of six heavy elements (Zn, Si, Cr, Mn, Fe, and Ni). The relative abundances resemble the Galactic dust-depletion patterns, from which we infer a visual extinction , and (95% confidence).
The relatively high visual extinction in GRB 020813 is hard to reconcile with the observed UV GRB continuum spectrum, which deviates very little from a perfect power law, suggesting low reddening. However, this can be explained if the extinction curve is only a weak function of the wavelength. We constrained the shape of the extinction curve, assuming the power-law form . For , we obtain . This high visual extinction rules out the possibility of MW, LMC, or SMC reddening, for which only , respectively, are allowed. The MW and LMC extinctions are also constrained by the absence of the 2200 Å extinction feature.
A moderately high visual extinction is not surprising if GRBs originate in regions of intense star formation and high density (Hjorth et al. 2003a). However, under some conditions, the GRB itself could destroy some of the dust grains (Fruchter et al. 2001).
Finally, heavy-element column densities in the circumburst medium of this GRB are considerably higher than those typically observed in QSO damped Ly systems (about 10 times higher), which is likely the result of a selection bias in the latter. The comparison of the dust-depleted element Fe, with the non-depleted element Zn, in the gas phase, gives [Fe/Zn] , whereas in 44 QSO-DLAs () this is [Fe/Zn] (0.28 dex 1 dispersion), suggesting a higher dust content in the circumburst medium of GRB 020813.
References
- (1) Bahcall, J. N., & Wolf, R. A. 1968, ApJ, 152, 701
- (2) Barth, A. J., et al. 2003, ApJ, 584, L47
- (3) Bergeson, S. D., & Lawler, J. E. 1993, ApJ, 408, 382
- (4) Bohlin, R. C., Savage, B. D., & Drake, J. F. 1978, ApJ, 224, 132
- (5) Fall, S. M., & Pei, Y. C. 1993, ApJ, 402, 479
- (6) Fedchak, J. A., Wiese, L. M., & Lawler, J. E. 2000, ApJ, 538, 773
- (7) Fitzpatrick, E. L., & Massa, D. 1988, ApJ, 328, 734
- (8) Fruchter, A., Krolik, J. H., & Rhoads, J. E. 2001, ApJ, 563, 597
- (9) Galama, T. J., & Wijers, R. A. M. 2001, ApJ 549, L209
- (10) Grevesse, N., & Sauval, A. J. 1998, Space Sci. Rev., 85, 161
- (11) Howk, J. C., & Sembach, K. R. 1999, ApJ, 523, L141
- (12) Hjorth, J. et al. 2003a, Nature, 423, 847
- (13) ———. 2003b, ApJ, 597, 699
- (14) Jenkins, E. B. 1986, ApJ, 304, 739
- (15) Kling, R., & Griesmann, U. 2000, ApJ, 531, 1173
- (16) Morton, D. C. 1991, ApJS, 77, 119
- (17) Prevot, M. L., Lequeux, J., Prevot, L., Maurice, E., & Rocca-Volmerange, B. 1984, A&A, 132, 389
- (18) Prochaska, J. X. 2004, in Origin and Evolution of the Elements, eds. A. McWilliam & M. Rauch (Cambridge: Cambridge Univ. Press), 458
- (19) Savage, B. D., & Sembach, K. R. 1991, ApJ, 379, 245
- (20) ———. 1996, ARA&A, 34, 279
- (21) Savaglio, S., Fall, S. M., & Fiore F. 2003, ApJ, 585, 638
- (22) Schectman, R. M., Povolny, H. S., & Curtis, L. J. 1998, ApJ, 504, 921
- (23) Schlegel, D. J., Finkbeiner, D. P., & Davis, M. 1998, ApJ, 500, 525
- (24) Silva, A. I., & Viegas, S. M. 2002, MNRAS, 329, 135
- (25) Srianand, R., & Petitjean, P. 2000, A&A, 357, 414
- (26) ———. 2001, A&A, 373, 816
- (27) Spitzer, L. 1978, Physical Processes in the Interstellar Medium (New York: Wiley)
- (28) Stratta, G., Fiore, F., Antonelli, L. A., Piro, L., de Pasquale, M., 2004, ApJ, 608, 846
- (29) Verner, D. A., Barthel, P. D., Tytler, D. 1994, A&AS, 108, 287
- (30) Villaseñor, J., et al. 2002, GCN Circ. 1471 (http://gcn.gsfc.nasa.gov/gcn3/1471.gcn3)
- (31) Vreeswijk, P. M., et al. 2004, A&A, 419, 927
- (32) Welty, D. E., Lauroesch, J. T., Blades, J. C., Hobbs, L. M., & York, D. G. 1997, ApJ, 489, 672