A Supernova Factory in the Merger System Arp 299
Abstract
We have imaged the nearby galaxy merger Arp 299 at arcsecond and milliarcsecond resolution, using both the Very Large Array and the Very Long Baseline Array. The large-scale radio emission from the merger contains 5 bright, compact radio sources embedded in diffuse emission, with diameters less than 200 pc. Supernova rates of 0.1 to 1 per year are required to produce the VLA-detected radio emission in these sources. Two of the compact VLA radio sources, designated Source A and Source D, also have been detected and imaged at milliarcsecond scales. Source A, which is associated with the nucleus of one of the merging galaxies, contains five milliarcsecond-scale sources, each with a radio power between 100 and 1000 times that of the Galactic supernova remnant Cassiopeia A. Four of these have flat or inverted spectra and appear to be young supernovae. Three of the VLBI-scale sources are located within 10 pc (projected) of one another, and two are separated by less than 3 pc, indicating that they all may be within the same super starcluster or complex of such clusters. The brightest VLBI-scale source, A0, has an extremely inverted spectrum, with at gigahertz frequencies. It seems to be the youngest supernova, which has not yet broken out of its circumstellar shell. The milliarcsecond radio sources within Source A appear to constitute a supernova factory, confirming the presence of an extreme starburst that peaked at least a few million years ago.
1 Introduction
Arp 299 (NGC 3690, Mrk 171)111The Arp 299 merger is sometimes referred to as NGC 3690 (west) and IC 694 (east), although the designation of various merger components and nearby companions in the literature is inconsistent (see Yamaoka et al. (1998) for a discussion); in this paper we refer to the whole system as Arp 299. is the “original” starburst galaxy (Gehrz, Sramek, & Weedman 1983) and an obvious merger system that has been studied extensively at many wavelengths. The galaxy distance is 41 Mpc for km s-1 Mpc-1 (Tully, 1988), where 1″ corresponds to 200 pc. The merger in Arp 299 is similar in age to the “Antennae”; both systems are considered to be in the “early” merger stage, slightly more than one crossing time ( yrs) before coalescence of the nuclei is expected (Keel & Wu, 1995; Read & Ponman, 1998). An active starburst in Arp 299 is indicated by the high frequency of recent optically discovered supernovae in the galaxy, including SN 1992BU (Van Buren et al., 1994), SN 1993G (Forti, 1993), SN 1998T (Li, Li, & Wan, 1998; Yamaoka et al., 1998), and SN 1999D (Qiu, Qiao, & Hu, 1999). Lai et al. (1999) used 2.2-m adaptive optics imaging of Arp 299 and detected what they believe to be many “super star clusters” (SSCs) that might include very high mass stars. Hubble Space Telescope (HST) FOC and NICMOS images (Meurer et al., 1995; Alonso-Herrero et al., 2000) reveal a population of young stellar clusters at ultraviolet, optical and near-infrared wavelengths.
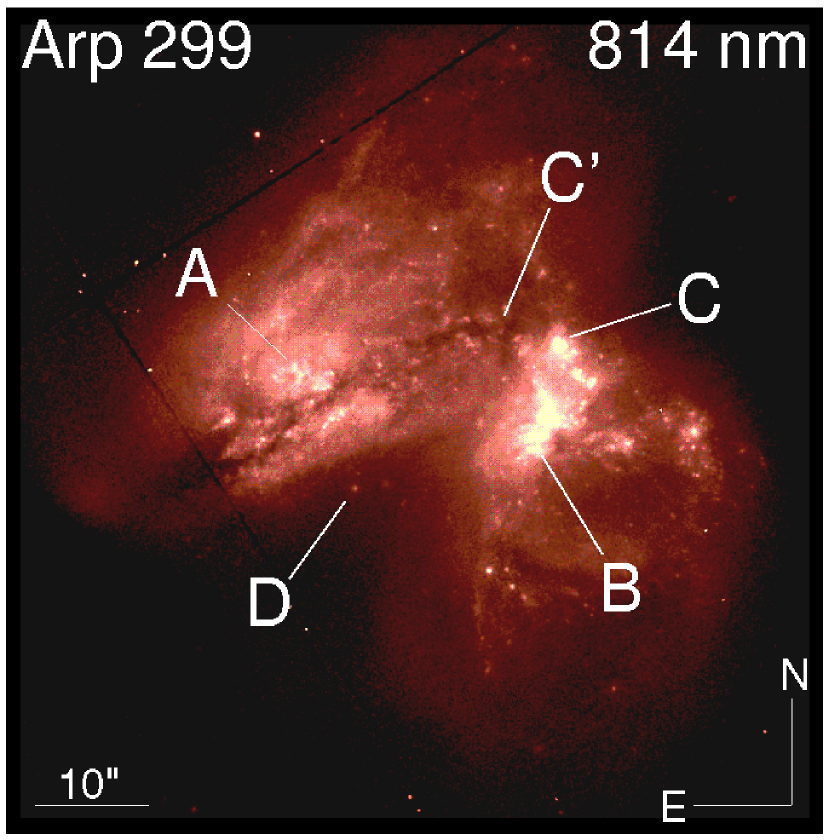
At visible wavelengths, the disks of the interacting galaxies appear to overlap, but the individual nuclei still are separate ( kpc) and distinguishable (See Figure 1). Unlike the “Antennae”, which has two clearly distinguished tidal tails, Arp 299 has a single tidal tail, indicative of a prograde-retrograde interaction in the past (700 Myr ago). The most recently initiated interaction also appears to be prograde-retrograde (Hibbard, 1997), a spin geometry which drives most of the gas towards the galaxy center and maintains star formation at an elevated level for an extended time. Most of the molecular gas in the system is concentrated near the nuclei, particularly the eastern (retrograde) nucleus (Sargent & Scoville, 1991), but CO is also found in other regions such as the bridge between the nuclei and the base of the tidal tails (Aalto et al., 1997; Casoli et al., 1999).
Arp 299’s infrared luminosity () is nearly in the Ultraluminous IR Galaxy (ULIRG) category (Hibbard, 1997). The eastern nucleus, hereafter source A (Gehrz et al., 1983), is the brightest component in the near-infrared, accounting for 50% of the total infrared luminosity of the system (Alonso-Herrero et al., 2000). There are numerous other point-like near-infrared sources in Arp 299, many of them in very dusty regions of the system (Alonso-Herrero et al., 2000). Many, but not all, of the infrared objects correspond to sources detected at radio wavelengths in VLA222The Very Large Array (VLA), the Very Long Baseline Array (VLBA), and the Robert C. Byrd Green Bank Telescope (GBT) are all operated by the National Radio Astronomy Observatory (NRAO), which is a facility of the National Science Foundation operated under cooperative agreement by Associated Universities, Inc. images (Gehrz et al., 1983; Zhao et al., 1997). Numerous H II regions populate the system near star-forming regions and it appears that star formation has been occurring at a high rate for about 10 Myr (Alonso-Herrero et al., 2000).
The new and archival radio observations presented here are part of a larger project studying the star formation rate of mergers, to determine at which stage of the merging process the maximum star formation occurs. This paper focuses on the properties of the five strongest radio sources in Arp 299, investigating them on scales of 100 pc and of 1 pc. The population of weaker radio sources and the diffuse radio emission in the system will be the subject of a separate paper (Neff, Campion, and Ulvestad, in prep).
2 VLA Observations, Archival Data, and Imaging
New observations of Arp 299 were made using the VLA (Thompson et al., 1980) at 4.9 and 8.4 GHz; these wavelengths were chosen because they are the most sensitive bands on the VLA. The new 4.9 and 8.4 GHz observations were made on 2000 October 24, 2001 March 19, and 2002 April 29. In 2000 October, the system was observed at 4.9 GHz with the A configuration. Eight-minute integrations of the galaxy were alternated with 1-minute scans of the phase calibrator J1128+5925 over a period of four hours; two 2-minute observations of 3C 286 were used for amplitude calibration. Arp 299 was observed at 8.4 GHz in the B configuration in 2001 March, with a similar observing strategy, except that the total observation time of four hours was spread out over an 8-hr period.
There are many additional observations of Arp 299 in the VLA archives, mostly from supernova monitoring campaigns. We selected a combination of data sets covering a wide range of baselines to complement the new 4.9 and 8.4 GHz observations and to maximize the aperture-plane coverage of the resulting combined data. We used only observations with more than 200 seconds of integration on Arp 299. All of the selected observations had a bandwidth of 50 MHz in each of two intermediate frequency channels for both right and left circular polarization. Each observation used 3C 286 as the flux calibrator and was calibrated to the primary flux density scale of Baars et al. (1977), as modified very slightly by VLA staff to account for source variability. We obtained 14 sets of archival data at 8.4 GHz and 11 sets of archival data at 4.9 GHz. We also retrieved one observation at 1.4 GHz. Observations exist in the VLA archive at higher frequencies (15 and 22 GHz); however we did not use these because the calibration is less certain and the data give inconsistent results. Details of all new and archival observations used in this paper are listed in Table 1. The noise levels for each individual image are listed; these images were made with the “robust” parameter for data weighting that provides the best combination of high sensitivity and high resolution (Briggs, 1995; Briggs, Schwab, & Sramek, 1998). The combination of the archival data with the new observations provided very high sensitivity over a wide range of spatial scales at 4.9 and 8.4 GHz. Although the image at 1.4 GHz is not of comparable sensitivity to the 4.9 and 8.4 GHz images, it is adequate for comparisons of emission from the strongest compact radio sources.
Each individual data set was calibrated, flagged, imaged, self-calibrated, and re-imaged using standard image processing techniques in the Astronomical Imaging Processing System, AIPS (van Moorsel, Kemball, & Greisen, 1996). At 4.9 and 8.4 GHz, the multiple data sets at each wavelength were combined into a single data set and another cycle of imaging plus self-calibration and imaging produced images with high resolution and low noise. The data processing included the removal of two background radio sources within the field of view. They are a companion E/S0 galaxy located 1′ to the northwest (sometimes referred to as IC 694 (Yamaoka et al., 1998)), and a strong background radio galaxy ′ southeast of Arp 299 (centered approximately at J2000 right ascension , declination 58°32′05″).
The default 8.4 GHz combined image was of higher resolution than the 4.9 GHz image. Thus the data weighting for the 8.4 GHz data was adjusted so that the resulting 8.4 GHz image matched the 0.′′38 0.′′31 resolution of the 4.9 GHz image; this adjustment increased the rms noise in the combined 8.4 GHz image. Figures 2 and 3 show the combined images of Arp 299 at 4.9 and 8.4 GHz, respectively. The 1.4 GHz image (Figures 4) could not be adjusted to match the resolution of the 4.9 and 8.4 GHz images, so additional images at 4.9 and 8.4 GHz were made to match the resolution of the 1.4 GHz image. These images are not shown, but are discussed occasionally below and are used in some of the analysis.
All of the images show five dominant compact radio sources. The four strongest radio sources (labeled A, B1, C, and C′) have been identified previously by Gehrz et al. (1983). The fifth brightest compact radio source, which we have labeled D after the Gehrz et al. (1983) notation for the region where this source is located, was identified previously at radio wavelengths by Huang et al. (1990) and discussed by Zhao et al. (1997). Source D clearly is visible in the 1.6-m NICMOS image shown by Alonso-Herrero et al. (2000), and in the HST 814 nm image (Figure 1). In our new radio images, Source B has been resolved into two sources, B1 and B2, for the first time at radio wavelengths (see Figures 2 and 3); these sources clearly are separated in near-infrared and optical images shown by Lai et al. (1999) and Alonso-Herrero et al. (2000).
Sources A, B1, C, C′, and D are the focus of this paper.
3 VLBA Observations and Imaging
We observed Arp 299 using Very Long Baseline Interferometry (VLBI) to search for possible active galactic nuclei (AGNs) or radio-luminous supernovae (SNe) within Sources A, B1, C, C′, and D.
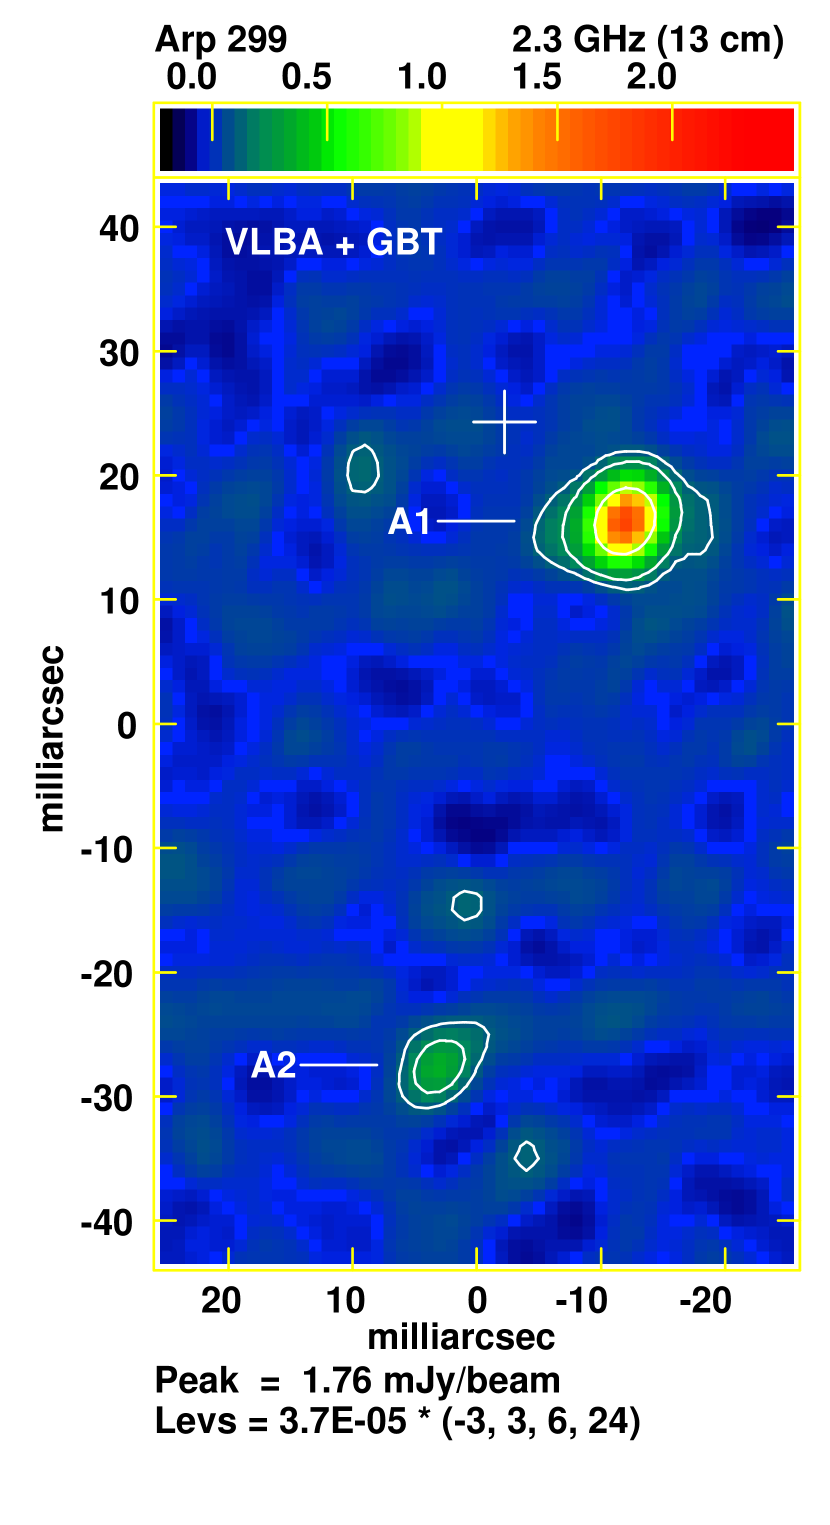
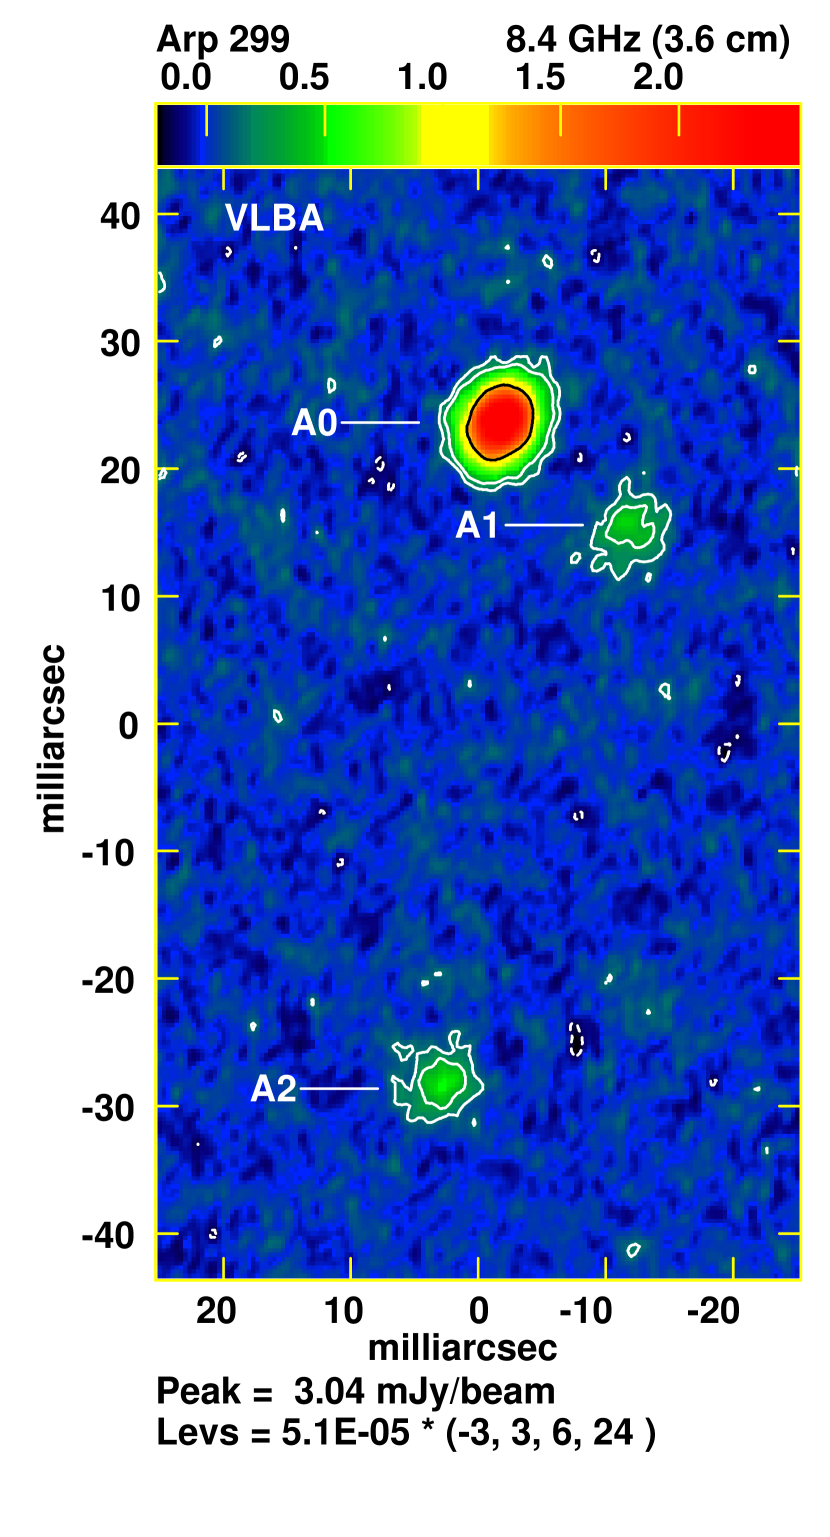
Three sets of VLBI observations were obtained in 2002 and 2003. In all cases, dual polarizations were observed, and Arp 299 was phase-referenced (Beasley & Conway, 1995) to the calibration source J1128+5925. The calibrator is only 0.9∘ away from the galaxy, allowing for good atmospheric calibration. On 2002 April 29, we observed the galaxy at 2.3 GHz using the VLBA2, and including the 100 by 110 meter GBT2 for increased sensitivity. The observation was made with 32 MHz total bandwidth and 2-bit sampling, for a total recorded data rate of 256 Mbit s-1. One-minute scans of the calibrator and 2.5-minute scans of the galaxy were alternated; total integration time on the galaxy was approximately 5 hours. A second observation was made on 2003 February 9 using only the VLBA. The galaxy was observed at 8.4 GHz in the same observing mode as in 2002; 1-minute scans on the calibrator and 3-minute scans of the galaxy were alternated. The total time on the galaxy was approximately 7 hours. Finally, a third follow-up (“target of opportunity”) observation was made on 2003 April 30/May 1 (hereafter 2003 May 1), using only the VLBA, at 2.3, 5.0, 8.4, and 15 GHz These observations used only 16 MHz total bandwidth and half the data rate of the previous observations. Galaxy scan times ranged from 1 to 3 minutes in the phase-referencing. The integration time at each of the four wavelengths was selected to achieve equal noise levels at all bands; in the final datasets, the noises at 2.3 and 15 GHz were slightly higher due to ambiguous phase connection (15 GHz) and radio-frequency interference (2.3 GHz). Details of the VLBA observations are listed in Table 2. Here, the listed noise levels are those for which “natural” weighting was used; this maximizes sensitivity, at some expense in resolution (Briggs et al., 1998).
Calibration, imaging and self-calibration of the VLBA data also were carried out using AIPS. Amplitude calibration was based on system temperature measurements made during the observations, and has an accuracy of %. Instrumental delays, delay rates, and phases were calibrated by using the phase-reference calibrator and then applied to the galaxy. Ionospheric corrections also were made using data provided by the Jet Propulsion Laboratory333IONEX files can be obtained by FTP from cddisa.gsfc.nasa.gov.. The data were processed using short correlator integration times (0.5 seconds) and enough spectral channels (32) to enable imaging at all locations in the merger without losses in peak intensity due to bandwidth or time-average smearing (Bridle & Schwab, 1998). Self-calibration was carried out when possible in our low signal/noise data, and was most successful for the first epoch 2.3 GHz observations, due to the highly sensitive baselines to the GBT.
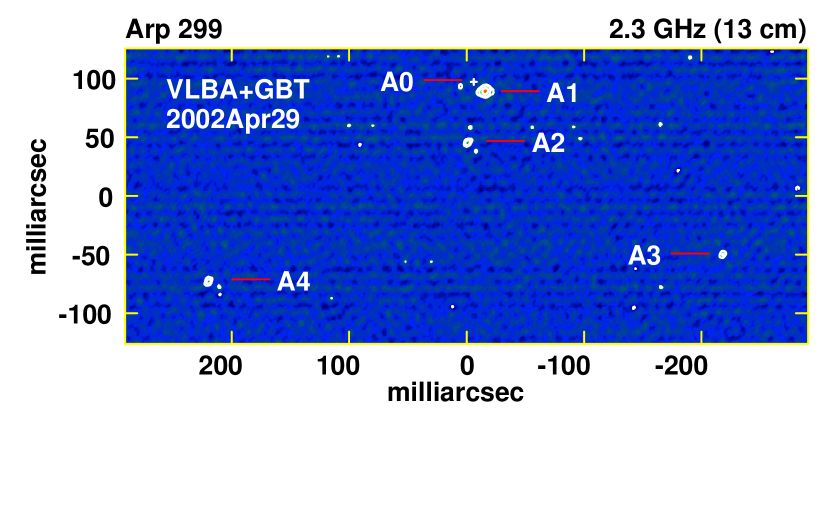
The 2.3 GHz image of Source A from 2002 (Figure 5) contains four unresolved compact sources located within 015 of the VLA position for this source. A fifth unresolved object is detected at the position of Source D. The other relatively strong VLA sources, B1, C, and C′, were not detected. The initial 8.4 GHz image from 2003 February showed all the sources present in 2002 - four in Source A and one in Source D. Efforts to self-calibrate the data at quite low signal/noise caused some of these sources to disappear, while others appeared in the images. Therefore, we use the original phase-referenced images in this paper. As in 2002, B1, C, and C′ remained undetected. However, a surprising result, shown in Figure 6, was the appearance of a new mJy source, dubbed A0 (as the strongest source), only 13 mas (2.6 pc) from A1. This source is discussed in more detail in Section 5.2.
Since we could not use self-calibration on Arp 299 in 2003 February, we employed the check source for the phase referencing, J1127+5650 (located roughly 2.5∘ from J1128+5925), to estimate the coherence loss due to imperfect phase calibration. Comparing the original and self-calibrated images for this check source, we find a coherence loss of 24%. The phase connection for the reference source is good, with apparent changes (depending on baseline length) of to between successive observations of the reference source; linear interpolation between these scans probably gives a phase error with respect to time of no more than , which could account for only a small fraction of a 24% coherence loss. Therefore, we infer that most of the coherence loss is caused by spatial structures in the atmosphere, in which case the phase error is likely to scale with the angular separation of reference source and target. Since Arp 299 is only 0.86∘ from J1128+2925, we infer that the loss of coherence for the galaxy should have been that for the check source, or about 8%. Therefore, we have increased the measured source flux densities at this epoch by 8%; since the uncertainty in this estimate of coherence loss may be as much as a factor of two, we also have added 8% (in quadrature) to the other error sources in computing the final flux density errors.
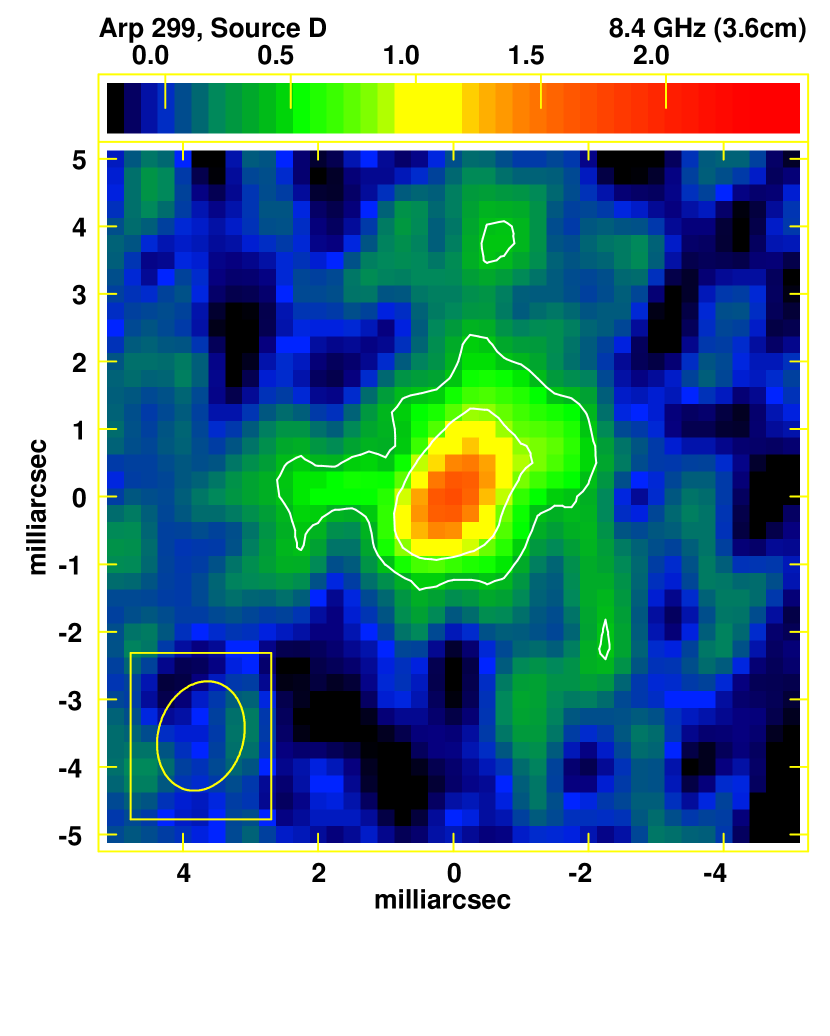
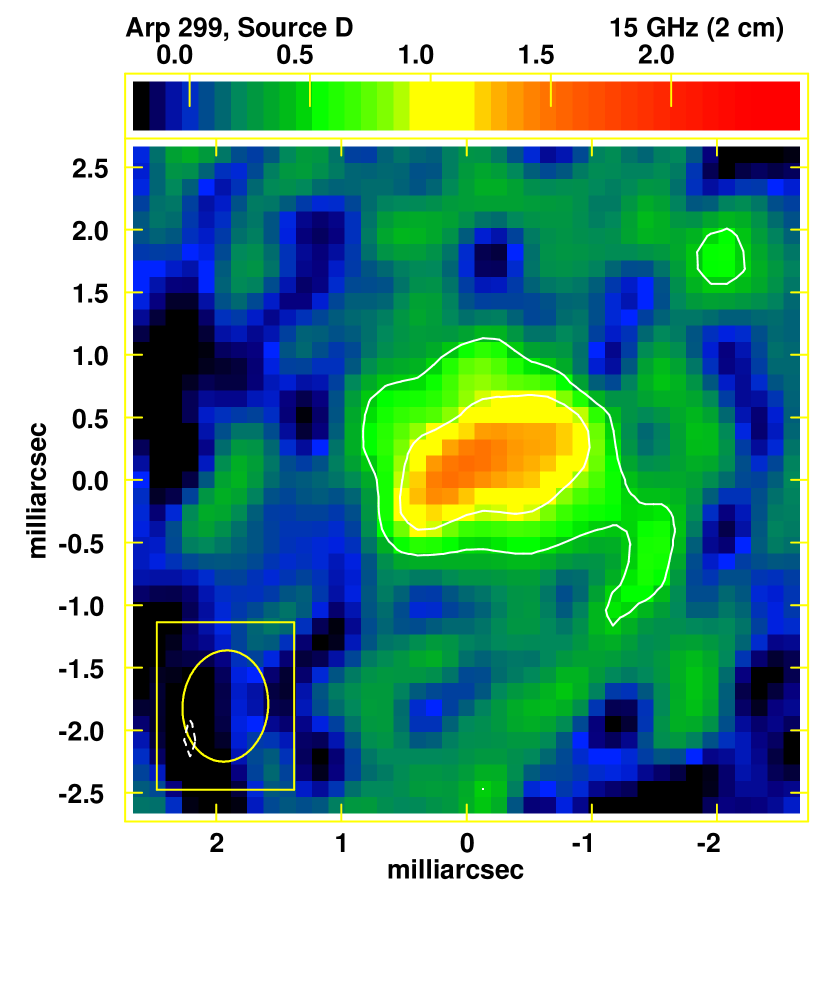
The appearance of A0 motivated a target-of-opportunity proposal for multi-frequency VLBA imaging, in order to determine the spectrum of this new source. These observations in 2003 May were carried out with the VLBA alone, used lower bandwidth than the previous observations, and did not include the GBT; therefore they have higher rms noises than the earlier observations. Source A0 was not detected above the level at 2.3 GHz in May 2003. Components A1, A2, A3, and A4 are detected at levels consistent with their previous sizes and flux densities, given the much higher error levels. Source D changed significantly between 2002 April and 2003 May: the 2.3 GHz flux density in 2003 was more than 6 times higher than it was a year earlier, and Source D also became resolved at both 8 and 15 GHz (Figure 7).
The properties and characteristics of these compact sources are discussed below.
4 Properties of the Compact Radio Sources
4.1 VLA Results
In both the high-resolution images and those matched to the 1.4 GHz resolution, single Gaussian models were fitted to the five strongest compact radio sources. If the model fitting indicated that the compact source was consistent with being unresolved, the source was re-fitted using a point-source model. Results of these fits are given in Tables 3 and 4. Flux density errors combine the noise, the fitting errors, and possible systematic calibration offsets, added in quadrature. For well-calibrated data, the overall amplitude scaling relative to Baars et al. (1977) is reported by the VLA Calibrator Manual444The latest version of the VLA Calibrator Manual is accessible at http://www.vla.nrao.edu/astro/. to be 1% to 2% at 1.4, 4.9, and 8.4 GHz. However, because most of our data are archival, with a variety of different weather qualities and observing strategies, we have conservatively assumed flux-scale errors of 5%.
Peak brightness temperatures at 8.4 GHz were calculated for Sources A, B1, C, C′, and D using the flux densities and sizes found at the highest resolution (see Table 3), and are given in Table 5. The brightness temperatures were calculated using Equation (1) from Falcke et al. (1996), modified for an elliptical gaussian:
| (1) |
Here, is the flux density at frequency , with and being the fitted full widths at half maximum of the major and minor axes of the sources. Total monochromatic radio powers for each source were derived from the matched-resolution images (see Table 4). These powers, given in Table 5, typically are thousands of times the power emitted by the Galactic supernova remnant Cassiopeia A, which is assumed to have a present 8.4-GHz flux density of 460 Jy (derived from Baars et al. 1977) at a distance of 3.4 kpc (Reed et al., 1995). The inferred brightness temperatures and radio powers are as expected from complexes of hundreds to thousands of supernova remnants, although we note that a few individual supernova remnants in dense environments have been observed to show comparable luminosities (Weiler et al., 1990; Van Dyk et al., 1993).
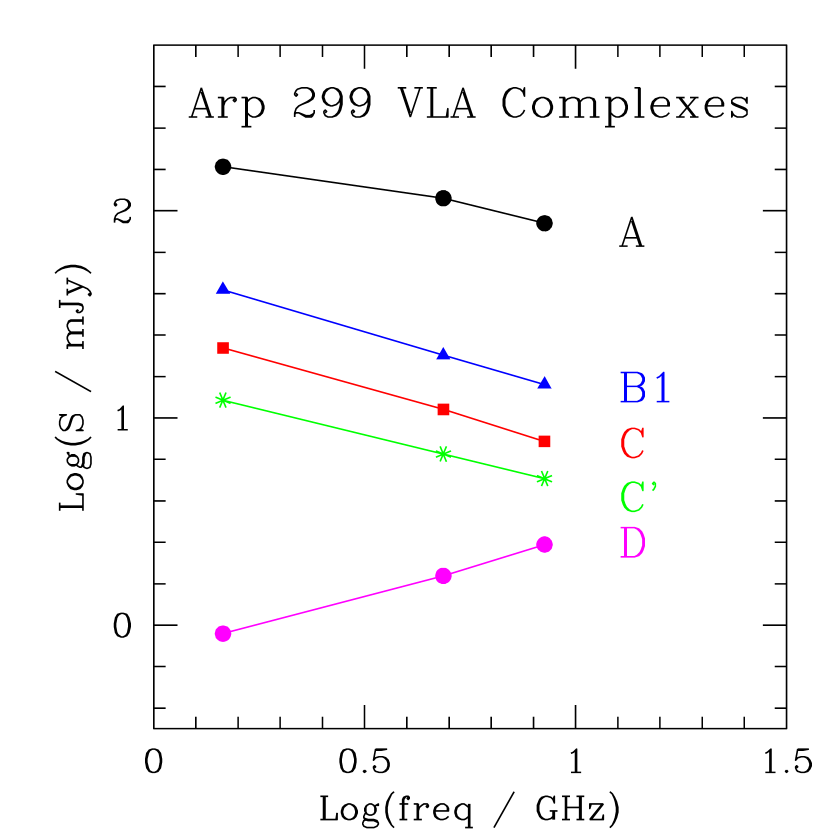
Figure 8 shows the radio spectra of the five compact components listed in Table 4. On VLA scales, Sources A, B1, C, and C′ all have spectra that decrease slightly with increasing frequency, while VLA source D has a spectrum that appears to peak at frequencies above 8 GHz. Two-point spectral indices, (), where is the flux density at frequency ), were calculated between 4.9 and 8.4 GHz from the images made with the same 121088 beam, and are listed in Table 5 (Supernova rates in the table are derived in section 5.3, below). In spite of the small frequency range spanned, errors in these spectral indices are fairly small, , because the five sources under study are detected with high signal/noise ratios. The spectral indices of to for Sources A, B1, C, and C′ are consistent with collections of typical galactic supernova remnants (Weiler et al., 2002). The spectrum of Source D is more enigmatic; we return to it in Section 5.4.
4.2 VLBA Results
In all VLBA images, compact sources were visually identified and then fitted to a gaussian using the AIPS task JMFIT. Details of the fits and flux measurements of the VLBA-scale compact sources are listed in Table 6 and Table 8. Random errors are assigned as the quadratic sum of the image noise levels (Table 2) and the amplitude calibration errors, estimated to be 5% at most wavelengths and (conservatively) as 10% at 15 GHz. In addition, for data that could not be self-calibrated in 2003 February, the flux density at 8.4 GHz has been increased by 8%, with an 8% error added in quadrature, as inferred from observations of the check source J1127+5650 (see Section 3).
An important result of this work is the VLBI identification of a number of compact radio sources with high brightness temperatures, embedded within Source A and in Source D. Table 7 gives the brightness temperatures of these milliarcsecond-scale components, measured in the highest sensitivity 8.4 GHz VLBI images from 2003 February. For the unresolved sources, size upper limits for each dimension are taken conservatively to be half the diameter of the half-power beamwidth. In addition to the brightness temperatures, powers relative to the galactic supernova remnant Cassiopeia A (Cas A) are listed, as are monochromatic radio powers at 8.4 GHz. Source D is assumed to be at the distance of Arp 299 (see Section 5.4); two values are given for this object, one when it was unresolved in 2003 February, and one when it was resolved in 2003 May.
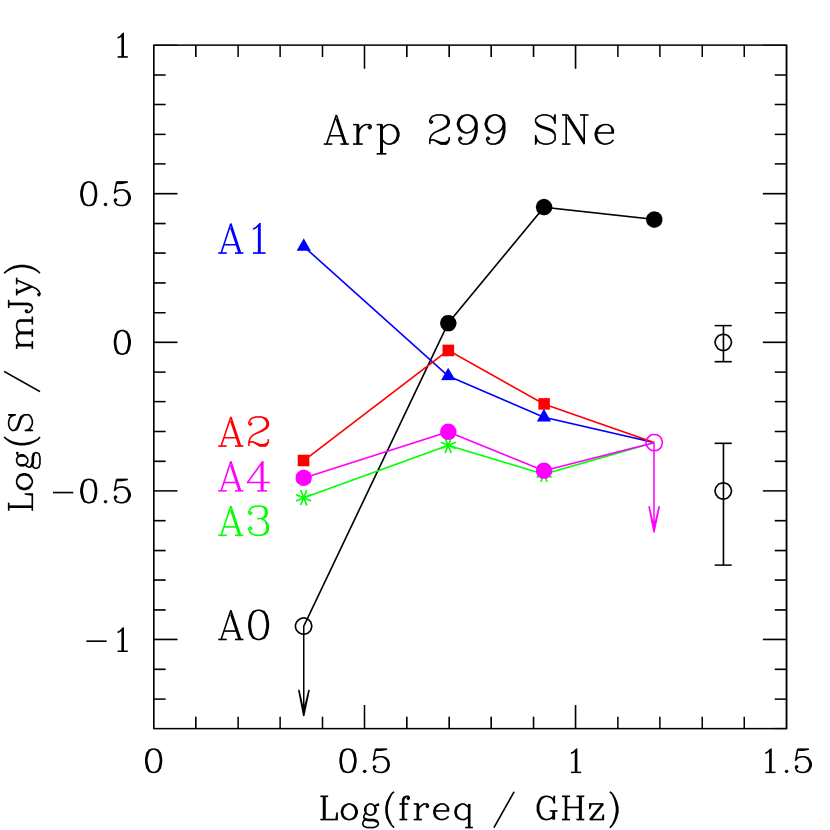
The VLBI-scale sources have very different spectra, as can be seen in Table 8 and in Figure 9, which show the individual source flux measurements at four frequencies in 2003 May. Source A0 has an extremely inverted spectrum: in May 2003 the 5.0 and 8.4 GHz flux densities implied a spectral index of . Comparison between the (non-contemporaneous) flux measurements of a upper limit of 0.11 mJy at 2.3 GHz in 2002 April, and the 8.4 GHz value of mJy in 2003 February, yields for Source A0, which declines more steeply at long wavelengths than is expected even for synchrotron self-absorption. Source A1 has a non-thermal spectrum, with between 2.3 and 8.4 GHz. Sources A2, A3, and A4 appear to have fairly flat spectra although the S/N in these (short) measurements is not impressive. However, if we assume no variability at 2.3 and 8.4 GHz between 2002 April and 2003 February, all three sources have flat or slightly inverted spectra. In May 2003, Source D had a relatively flat spectrum, rising somewhat at the higher frequencies. Although we do not know definitively what spectrum VLBI Source D had earlier, we do know that its 2.3 GHz flux density increased from 0.30 mJy in Feb 2002 to 2.04 mJy in May 2003 and that its 8.4 GHz flux density increased from 2.21 mJy to 3.36 mJy between Feb and May 2003, as it appeared to increase dramatically in size.
5 Discussion
5.1 Does Arp 299 host one or more AGNs?
Any AGNs in Sources A, B1, C, C′ or D are buried in many magnitudes of extinction at visible and IR wavelengths (Alonso-Herrero et al., 2000). Sources A and B1 are thought to be the nuclei of the two galaxies which are merging, and both are associated with hard X-ray point sources (Ballo et al., 2003; Zezas et al., 2003), so they seem to be likely AGN candidates. [Ballo et al. (2003) finds hard X-ray emission and Zezas et al. (2003) show that it is localized at A and B1.] VLBI observations on baselines of thousands of kilometers are able to detect even optically obscured AGNs, because VLBI isolates only high brightness temperature (– K) objects. In contrast, H II regions must have , and supernova remnants generally have low brightness temperatures as well. However, high brightness temperature is not an exclusive discriminator for AGNs, since some young radio SNe also are detected on milliarcsecond scales (e.g., Bietenholz, Bartel, & Rupen 2001; Perez-Torres et al. 2002; Bartel & Bietenholz 2003), implying brightness temperatures similar to some AGNs.
There have been a number of suggestions in the literature, based on observations in a variety of frequency bands, that source A may harbor an AGN (Lonsdale et al., 1992; Lai et al., 1999; Alonso-Herrero et al., 2000; Zezas et al., 2003). In fact, the total VLA-scale radio power of Source A is considerably higher than the cores of most low-luminosity AGNs (LLAGNs) and classical Seyfert galaxies (Ho & Ulvestad, 2001; Schmitt et al., 2001; Thean et al., 2001; Nagar et al., 2002). Even if an AGN is present, it is clear from the optical and infrared imaging that Source A contains a strong star-formation complex. The inferred supernova rate in this complex, derived from radio flux densities and the strength of near-infrared [Fe II] emission, is 0.6–0.7 yr-1 (Alonso-Herrero et al., 2000), while the VLA radio flux density implies a supernova rate as high as several per year (see Section 5.3). Strong CO emission (Sargent & Scoville, 1991; Casoli et al., 1999) and the lack of a strong optical nucleus (Alonso-Herrero et al., 2000) at the location of source A confirm that it is heavily enshrouded by dust.
Previous VLBI measurements by Lonsdale et al. (1992) detected Source A with a correlated flux density of 1.4 mJy at 1.6 GHz on a transatlantic VLBI baseline, implying a source size 1 pc with a radio power of 3 W Hz-1 and a brightness temperature 5 K. (Smith, Lonsdale, & Lonsdale, 1998) detected source A with correlated flux densities of 15 and 7 mJy at 1.6 GHz, on respective projected baselines of about 50 km and 100 km, implying that there is considerable structure on scales between 0.′′005 and 0.′′5. Therefore, any AGN that might be present is embedded in a larger region of star formation and probably does not make a significant contribution to the radio power of Source A. Other star-formation complexes on similar scales have been detected with VLBI observations: Arp 220 (Smith et al., 1998), which contains an AGN but not an energetically significant one, and Mrk 231 (Taylor et al., 1999), which contains a strong AGN.
Our detection of five compact radio sources with K in Source A makes it unlikely that all the milliarcsecond-scale radio emission is AGN-powered, since it is highly unlikely that there are five AGNs within Source A. However, there could be a single AGN present, as inferred from the hard X-rays (Ballo et al., 2003; Zezas et al., 2003). In this regard, it is notable that source A1 is the only milliarcsecond (1 pc) compact object with an optically thin synchrotron spectrum; if there is an AGN present, it mostly likely is Source A1. If Source A1 were an AGN, it would be intriguing to have an apparent young supernova (A0) only 2.6 pc away from the AGN.
The X-ray point source associated with Source A has a 0.1–10 keV luminosity of ergs s-1 (Zezas et al., 2003). If the X-ray emission from Source A were assumed to be associated with a single one of its milliarcsecond radio sources, such as Source A1, we could estimate the radio to X-ray ratio for that source. For Source A1, would be , consistent with values found for several other LLAGNs imaged on milliarcsecond scales (Ulvestad & Ho, 2001b) and also consistent with the values found for the nucleui in the merger system NGC 3256 (Neff et al., 2003). Source B1 has hard X-ray emission suggestive of an AGN (Ballo et al., 2003; Zezas et al., 2003), somewhat weaker than A, but no compact AGN is detected at radio wavelengths. Still, the radio to X-ray ratio for the milliarcsecond source in B1 is consistent with the range of values found for LLAGNs. Sources C, C′, and D have much softer X-ray spectra (Zezas et al., 2003), as well as no high brightness radio emission, suggesting that they harbor no AGNs. Although the radio observations alone do not determine whether there are AGNs in Arp 299, we are able to say that any AGN present are unlikely to play an important role in the merger’s overall energy balance.
5.2 Young Supernovae Within Source A - A Supernova Factory
Source A is particularly strong; its VLA 8.4 GHz radio power of 1.8 W Hz-1 is more than 50 times the strongest non-thermal source in NGC 4038/9 (Neff & Ulvestad, 2000) and 27,500 times the power of Cas A at the same wavelength. Source a contains at least three distinct near-infrared sources, possibly young star clusters, in its central 0.86 arcseconds (Alonso-Herrero et al., 2000). The present VLBI imaging reveals at least five compact radio emitters within Source A. Four of these five have flat or inverted radio spectra between 2.3 and 8.4 GHz, a property that is characteristic of young Type II supernovae near their peaks (Weiler et al., 2002). Although such spectra also may be indicative of thermal gas associated with young star clusters, such clusters would have brightness temperatures K, and would not be detected by VLBI observations.
Source A0 has an extremely inverted spectrum (with , Figure 9). Such an inverted spectrum is characteristic of very young supernovae in the early days after their explosion, when the supernova blast has not yet completely penetrated the circumstellar mass-loss shell, which remains optically thick to lower frequency radio emission for months in “normal” SN environments, and for years in very dense surroundings (Chevalier, 1982; Weiler et al., 2002). The spectra of Sources A2, A3, and A4 are typical of young SNe and Source A1 has a spectrum suggesting an older SN remnant which has become optically thin down to frequencies of 1.4 GHz.
If we assume that all five VLBI sources within A are young supernovae, they are spread over a total extent of 90 pc (440 mas). The three sources A0, A1, and A2 are much more tightly clustered, with projected separations of only 2.6 pc (13 mas) between A0 and A1, and 10.4 pc (52 mas) between A0 and A2. Assuming that these sources all are young supernovae, it is quite possible that A0 and A1, and perhaps even A2, are found within the same cluster of young stars. Super star clusters seen optically in other merging galaxies have canonical radii of pc, but may be as large as tens of parsecs (e.g., Whitmore et al. 1999). Alonso-Herrero et al. (2000) infer that Source A had the peak of its starburst 6–8 Myr ago. This corresponds to the main-sequence lifetime of O stars of 25–30 (Schaller et al., 1992; Schaerer et al., 1993). Massive stars formed in that burst should just now be ending their lives on the main sequence, and the radio sources that we see now probably result from the interactions of these explosions with their surroundings. We should therefore expect to see frequent supernova explosions from this “supernova factory.”
The five identified VLBI sources account for only 6% of the total VLA 8.4 GHz flux density of 87 mJy in Source A, which has an optically thin synchrotron spectrum on a scale of hundreds of milliarcseconds (cf. Table 3). It is likely that most of the radio emission not detected on milliarcsecond scales results from earlier supernovae that have now expanded and faded beyond the detection range of VLBI and merged into the smoother interstellar medium. The expansion to size scales larger than pc typically takes a hundred years or so in a “normal” interstellar medium, while the general merging into that interstellar medium may take yr (Condon, 1992). However, these time scales are quite uncertain in the denser environment of Arp 299.
If Source A does contain five young supernovae, why are none detected in sources B1, C, or C′? Alonso-Herrero et al. (2000) use infrared fluxes to infer supernova rates 0.6–0.7 yr-1 for Source A, but find supernova rates for B1, C, and C′ that are factors of 5–20 below that for Source A. We derive similar rates based on the VLA-scale radio emission (see Section 5.3). It seems reasonable that the number of detectable radio supernovae in B, C, and C′ should therefore be no more than 5%–20% of the number in Source A, or fewer than one per region for our most sensitive VLBI observations. If the supernovae in A tend to be stronger radio emitters due to a denser interstellar environment, as we expect, the number of supernovae detectable in the other sources would be even smaller. Sources B1, C, and C′ are also thought to be younger starbursts (Alonso-Herrero et al., 2000), so they may be just beginning significant supernova activity.
Another alternative for the compact radio sources in source A is that they are X-ray binaries or microquasars. However, X-ray binaries typically have radio to X-ray ratios (Fender & Kuulkers, 2001). Therefore, we would expect ergs s-1 in X-rays from Source A if the compact radio sources were X-ray binaries, compared to a measured value of ergs s-1 (Zezas et al., 2003). This appears to rule out active binaries as the origin of the milliarcsecond radio sources.
Future long-term VLBI monitoring of Arp 299 should enable us to test the idea that Source A contains a cluster of young SNe. First, new supernova explosions could be discovered as they occur, providing a direct measure of the radio supernova rate and indicating whether or not all supernovae in Source A are likely to be radio loud. If the detected radio supernova rate were one per decade rather than one per year or so, much less than the total estimate of yr-1 (Alonso-Herrero et al., 2000), then this result would indicate strongly that only a fraction of the Arp 299 supernovae are radio loud, at least above the VLBA detection threshold. Second, the fading of the young supernovae could be measured, for comparison with observations of young supernovae in less dense environments; this would provide useful constraints on the properties of the star-forming regions, as well as enabling an estimate of the age of the young radio supernovae already detected in Source A. Third, we should be able to verify the nature of Source A1: it should fade monotonically or rise and fall coherently if it is a supernova, while more stochastic flux variations would suggest that it is an AGN.
5.3 The Supernova Rate for VLA Sources A, B1, C and C′
Radio sources with “normal” nonthermal spectral slopes (i.e., ) are likely to be complexes of older supernova remnants, with the radio emission dominated by optically thin synchrotron emission. Inspection of Tables 4 and 5, where the resolutions at all wavelengths have been matched to the 1.4 GHz beam, shows that sources A, B1, C, and C′ all have such spectra on arcsecond scales. The spectral indices of to are consistent with typical galactic supernova remnants (Weiler et al., 2002), allowing us to use the observed flux and the spectral index to derive the supernova rate in each of these arcsecond-scale (100200 pc) sources.
There has been considerable discussion about the supernova rate corresponding to a given radio flux density, with estimates varying by a factor of 10 or so. In studying NGC 4038/9, Neff & Ulvestad (2000) pointed out that very different supernova rates will be derived, depending on whether the global radio emission of the merger, or only the emission identifiable with compact radio sources, was considered. This is because the bulk of the total radio emission of a starburst galaxy is caused by synchrotron-emitting electrons that have escaped the vicinity of the supernova remnants that accelerated them, and diffused throughout the galaxy. In NGC 4038 Neff & Ulvestad (2000) obtained the same supernova rates using the approach in Ulvestad (1982) and using the technique described by Condon (1992), as long as the latter approach was applied to the radio emission from the entire galaxy. In Arp 299, as in NGC 4038/9 (Neff & Ulvestad, 2000), we consider only radio emission that is compact (arcsecond scale or smaller), and therefore derive the supernova rate for the VLA-scale sources using Equation (7) from Ulvestad (1982) (equation 2, below).
For Sources A, B1, C and C′, we derive the supernova rate by assuming supernova blast wave energies of ergs and ambient densities of 1 cm-3. In this case, the supernova rate is given by:
| (2) |
Here, is the fraction of the radio flux density that can still be associated with individual supernova remnants on parsec scales. For the 4.9 GHz flux densities, we use the value measured in the matched angular resolution images (Table 4). For the spectral index between 408 MHz and 4.9 GHz, we use the measured value between 4.9 GHz and 8.4 GHz (Table 5), thus assuming that an ensemble of supernova remnants unresolved by the VLA has a net spectrum that is straight between 408 MHz and 8.4 GHz. The resulting estimates of the supernova rates required to produce the observed radio flux densities for sources A, B, C, and C′, are given in Table 5.
The total radio emission from source A, which corresponds to a power times that of Cas A, requires a supernova rate of yr-1. The nonthermal sources in B1, C, and C′ are considerably less powerful, with their supernova rates estimated at – yr-1. As stated in Section 5.2, the five identified VLBI sources account for only 6% of the total flux density at 8.4 GHz, so a lower limit for is for Source A. Since there may be other emission on scales of several parsecs that is too big to be seen in the milliarcsecond VLBI imaging, a reasonable value for may be 0.1–0.2, which then would provide a calibration similar to those advocated by Condon (1992) and Huang et al. (1994). This would imply a supernova rate of 0.5-1.0 yr-1 for Source A, in good agreement with the result found by Alonso-Herrero et al. (2000).
5.4 What is Source D?
Radio source D does not appear to be in the main interaction region of Arp 299 (see Fig. 1 or 2). Therefore, it is worth considering the possibility that Source D actually is not associated with the galaxy, but is a background source instead, as suggested previously (Zhao et al., 1997). Using the VLA in 1980, Condon et al. (1982) reported a continuum radio source in the vicinity of source D at 1.4 GHz, with a flux density of 4 mJy in a 2 beam. This flux density is much higher than the 1 mJy upper limit in 1989 (Huang et al., 1990) the 0.8 mJy flux density that we derive from 1991 archival data (Figure 5, Tables 3 and 4) the 0.5 mJy measured in a snapshot observation on 2003 April 29, or the VLBI upper limit from this work. Source D might be variable at 1.4 GHz, but we consider it more likely that the measurement by Condon et al. (1982) may have included more diffuse emission surrounding the source - we note that the VLA was in an early, hybrid, array at the time of these observations.
It is possible to use the many individual observations to investigate the possible variability of Source D; comparisons to the other compact sources can be used to infer the reality of any apparent variability. Therefore, we have measured the flux densities of sources A, B1, C, C′ and D in independent data sets observed between 1989 and 2003; results are shown in Table 9 and in Fig. 10 555 Huang et al. (1990) reported a flux density of 1.8 mJy from the source at 8.44 GHz on 1990 March 1; this actually is a composite of two data sets a few days before and after that date, which we have reprocessed individually. Zhao et al. (1997) detected the source at 8.2 GHz in March 1993 (B array) with a flux density of 2.20.1 mJy; this data is in good agreement with nearby data we did use. . We conservatively use only data from the high-resolution A and B configurations at 4.9 and 8.4 GHz, where we expect diffuse radio emission to be resolved out; this approach insures that measurements of the relatively isolated source D are not contaminated by more diffuse emission. Images were made with matched restoring beams for each array/frequency combination used, to assure that measurements were made with the same resolution. Sources A, B1, C, and C′ were all found to be extended, and were fitted with single Gaussian sources which were consistent in size and orientation in all observations made with a particular array. Source D was found to be unresolved in all individual observations, and was measured as a point source. Flux density errors were determined as discussed in section 4.1, and are approximately the size of the points shown in Figure 10.
In a fixed configuration, sources A and B1 do not vary significantly at 4.9 GHz and 8.4 GHz during the 13 years of observations. Sources C and C′ appear to vary, but they are very well resolved; we attribute their apparent variation to differing resolutions and aperture plane coverages in (mostly) short observations. Source D clearly has changed in flux density at 4.9 and 8.4 GHz (Fig. 10); the measured flux densities in 1990 and 1991 are consistent with one another, but the more recent measurements show significantly higher flux densities. This trend is completey different from Sources A and B1, leading us to infer that the variability of Source D is real and is not a data-reduction artifact.
On VLBI scales, Source D underwent a dramatic flux-density increase at 2.3 GHz between 2002 and 2003, as well as becoming significantly resolved and increasing in flux at 8.4 GHz in the three-month interval between 2003 February 9 and 2003 May 1 (see Figure 7). One can imagine several possible explanations for this change. If Source D is located within Arp 299, it may well have had a new supernova explosion in early 2003, or a supernova explosion that suddenly has broken through the circumstellar shell to become visible at the lowest VLBI frequency. If it is a background quasar, it may have ejected a new “jet” component in a radio flare. However, one might expect such a flare to give rise to a much stronger variation at the higher frequencies, rather than increasing in flux by more than 600% at 2.3 GHz. Further, the apparent source size has increased by mas in three months. Even at a modest assumed redshift of , this would correspond to a large (but not unprecedented) expansion speed of .
Our tentative conclusion is that Source D is located within Arp 299, probably within a very compact young star cluster. Supernova explosions in Source D would then account for the apparent flux-density variability seen in the multi-epoch VLA data, as well as for the rapid “expansion” and 2.3-GHz flux density increase in 2003. In support of this conclusiton, we note that in 2001 July, Source D had a soft X-ray spectrum consistent with being a radio supernova (Zezas et al., 2003). This conclusion can be validated by future VLBI imaging of Source D. If the source is a relativistic jet, its size should continue to expand, whereas a newly emerging supernova will stay in the same apparent location, yielding a relatively constant size as a function of time.
6 Summary
In this paper, we have discussed the five brightest radio sources in Arp 299. Four of the five brightest sources, A, B1, C, and C′, have VLA spectra characteristic of complexes of supernova remnants, with inferred supernova rates ranging from a few tenths to a few supernovae per year. VLBI imaging reveals five compact radio sources within A, most of which have flat or inverted radio spectra. Based on the sizes and spectra, we identify these as probable young supernovae or supernova remnants in a “supernova factory,” with individual powers of hundreds to a thousand times that of Cas A. One compact source (A0) has an extremely inverted radio spectrum, with or greater between 2.3 and 8.4 GHz. Three of the compact VLBI sources are located within a region with a projected size of 10 pc and may well be within the same super star cluster or cluster complex. An interesting alternative possibility is that the one steep-spectrum source (A1) is a low-luminosity AGN, occurring at a separation of only 2.6 pc (projected) from a very young supernova (A0). The VLBI sources include less than 10% of the total VLA flux density, implying that much of the radio power in Source A comes from older supernova remnants that have expanded and merged into the surrounding ISM. We do not know which (if any) of the separate VLBI sources in Source A produce the observed X-ray emission. If we attribute the bulk of the X-ray emission to one or more of the VLBI sources within Source A, the radio/X-ray ratio is far too high for all the compact objects to be beamed or unbeamed “normal” X-ray binaries or microquasars. Instead, the total radio/X-ray ratio is consistent with a mix of young supernovae, supernova remnants, and perhaps an AGN.
Radio source D, located at a projected distance of 2 kpc from source A, is quite compact on VLBI scales, with the VLBI source apparently containing all of the flux detected in the highest resolution VLA images. Its VLA 8.4 GHz and 4.9 GHz flux densities have both varied by factors of over the last 13 years. On VLBI scales, the Source D flux density at 2.3 GHz increased by a factor of between 2002 April and 2003 May, and its 8.4 GHz flux density increased by a factor of 1.6 in three months in early 2003; during early 2003, Source D also increased in size by at least a factor of 2 at 8.4 GHz. Although Source D could be a background quasar undergoing superluminal expansion, the observed properties fit more closely to a star-formation complex. VLBI monitoring should allow us to verify the SN hypothesis (or not) for Source D, and a high-resolution mid-infrared image of Source D would help confirm its identity as a young cluster in Arp 299.
References
- Aalto et al. (1997) Aalto, S., Radford, S. J. E., Scoville, N. Z., & Sargent, A. I. 1997, ApJ, 475, L107
- Alonso-Herrero et al. (2000) Alonso-Herrero, A., Rieke, G. H., Rieke, M. J. & Scoville, N. Z. 2000, ApJ, 532, 845
- Baars et al. (1977) Baars, J. W. M., Genzel, R., Pauliny-Toth, I. I. K., & Witzel, A. 1977, A&A, 61, 99
- Ballo et al. (2003) Ballo, L., Braito, V., Della Ceca, R., Maraschi, L., Tavecchio, F., & Dadina, M. 2003, astro-ph/0306436
- Bartel & Bietenholz (2003) Bartel, N., & Bietenholz, M. F. 2003, ApJ, 591, 301
- Beasley & Conway (1995) Beasley, A. J., & Conway, J. E. 1995, in ASP Conf. Ser. 82, Very Long Baseline Interferometry and the VLBA, Ed. J. A. Zensus, P. J. Diamond, & P. J. Napier (San Francisco: ASP), 327
- Bietenholz, Bartel, & Rupen (2001) Bietenholz, M. F., Bartel, N., & Rupen, M. P. 2001, ApJ, 557, 770
- Bridle & Schwab (1998) Bridle, A. H., & Schwab, F. R. 1998, in ASP Conf. Ser. 180, Synthesis Imaging in Radio Astronomy II, Ed. G. B. Taylor, C. L. Carilli, & R. A. Perley (San Francisco: ASP), 371
- Briggs (1995) Briggs, D. S. 1995, Ph. D. thesis, New Mexico Institute of Mining and Technology
- Briggs, Schwab, & Sramek (1998) Briggs, D. S., Schwab, F. R., & Sramek, R. A. 1998, in ASP Conf. Ser. 180, Synthesis Imaging in Radio Astronomy II, Ed. G. B. Taylor, C. L. Carilli, & R. A. Perley (San Francisco: ASP), 127
- Casoli et al. (1999) Casoli, F., Willaime, M. C., Viallefond, F., & Gerin, M. 1999, A&A, 346, 663
- Chevalier (1982) Chevalier, R. 1982, ApJ, 259, 302
- Condon (1992) Condon, J. J. 1992, ARA&A, 20, 575
- Condon et al. (1982) Condon, J. J., Condon, M. A., Gisler, G., & Puschell, J. J. 1982, ApJ, 252, 102
- Falcke et al. (1996) Falcke, H., Patnaik, A. R., & Sherwood, W. 1996, ApJ, 473, L13
- Fender & Kuulkers (2001) Fender, R. P., & Kuulkers, E. 2001, MNRAS, 324, 923
- Forti (1993) Forti, G. 1993, IAU Circ. 5719
- Gehrz et al. (1983) Gehrz, R. D., Sramek, R. A., & Weedman, D. W. 1983, ApJ, 267, 551
- Hibbard (1997) Hibbard, J. E. 1997, in Star Formation Near and Far, ed. S. S. Holt. & L. G. Mundy (Woodbury, NY: AIP Press), 259
- Ho & Ulvestad (2001) Ho, L. C., & Ulvestad, J. S. 2001, ApJS, 133, 77
- Huang et al. (1990) Huang, Z.P., Condon, J. J., Yin, Q.F., & Thuan, T. X. 1990, IAU Circ. 4988
- Huang et al. (1994) Huang, Z.P., Thuan, T. X., Chevalier, R. A., Condon, J. J., & Yin, Q.F. 1994, ApJ, 424, 114
- Keel & Wu (1995) Keel, W. C., & Wu, W. 1995, AJ, 110, 129
- Lai et al. (1999) Lai, O., Rouan, D., Rigaut, F., Doyon, R., & Lacombe, F. A&A, 1999, 351, 834
- Li, Li, & Wan (1998) Li, W.-d., Li, C., & Wan, Z. 1998, IAU Circ. 6830
- Lonsdale et al. (1992) Lonsdale, C. J., Lonsdale, C. J., & Smith, H. E. 1992, ApJ, 391, 629
- Meurer et al. (1995) Meurer, G. R., Heckman, T. M., Letherer C., Kinney, A., Robert, C., & Garnett, D. R., 1995, AJ, 110, 2665
- Nagar et al. (2002) Nagar, N. M., Falcke, H., Wilson, A. S., & Ulvestad, J. S. 2002, A&A, 392, 53
- Napier et al. (1993) Napier, P. J., Bagri, D. S., Clark, B. G., Rogers, A. E. E., Romney, J. D., Thompson, A. R., & Walker, R. C. 1993, Proc IEEE, 82, 658
- Neff et al. (2003) Neff, S. G., Ulvestad, J. S., & Campion, S. 2003, ApJ, 599, 1043
- Neff & Ulvestad (2000) Neff, S. G. & Ulvestad, J. S. 2000, AJ, 120, 670
- Perez-Torres et al. (2002) Perez-Torres, M. A., Alberdi, A., Marcaide, J. M., Guirado, J. C., Lara, L., Mantovani, F., Ros, E., & Weiler, K. W. 2002, MNRAS, 335, L23
- Qiu, Qiao, & Hu (1999) Qiu, Y. L., Qiao, Q. Y., & Hu, J. Y. 1999, IAU Circ. 7088
- Read & Ponman (1998) Read, A. M., & Ponman, T. J. 1998, MNRAS, 297, 143
- Reed et al. (1995) Reed, J. E., Hester, J. J., Fabian, A. C., & Winkler, P. F. 1995, ApJ, 440, 706
- Sargent & Scoville (1991) Sargent, A. I., & Scoville, N. Z. 1991, ApJ, 366, L1
- Schaerer et al. (1993) Schaerer, D., Meynet, G., Maeder, A., & Schaller, G. 1993, A&AS, 98, 523
- Schaller et al. (1992) Schaller, G., Schaerer, D., Meynet, G., & Maeder, A. 1992, A&AS, 96, 269
- Schmitt et al. (2001) Schmitt, H. R., Ulvestad, J. S., Antonucci, R. R. J., & Kinney, A. L. 2001, ApJS, 132, 199
- Smith, Lonsdale, & Lonsdale (1998) Smith, H. E., Lonsdale, C. J., & Lonsdale, C. J. 1998a, ApJ, 492, 137
- Smith et al. (1998) Smith, H. E., Lonsdale, C. J., Lonsdale, C. J., & Diamond, P. J. 1998b, ApJ, 493, L17
- Taylor et al. (1999) Taylor, G. B., Silver, C. S., Ulvestad, J. S., & Carilli, C. L. 1999, ApJ, 519, 185
- Thean et al. (2001) Thean, A., Pedlar, A., Kukula, M. J., Baum, S. A., & O’Dea, C. P. 2001, MNRAS, 325, 737
- Thompson et al. (1980) Thompson, A. R., Clark, B. G., Wade, C M., & Napier, P. J. 1980, ApJS, 44, 151
- Tully (1988) Tully, R. B. 1988, Nearby Galaxies Catalog (Cambridge:Cambridge Univ. Press)
- Ulvestad (1982) Ulvestad, J. S. 1982, ApJ, 259, 96
- Ulvestad & Ho (2001b) Ulvestad, J. S., & Ho, L. C. 2001, ApJ, 562, L133
- Van Buren et al. (1994) Van Buren, D., Jarrett, T., Tereby, S., Beichman, C., Shure, M., & Kaminski, C. 1995, IAU Circ. 5960
- Van Dyk et al. (1993) Van Dyk, S. D., Weiler, K. W., Sramek, R. A., & Panagia, N. 1993, ApJ, 419, L69
- van Moorsel, Kemball, & Greisen (1996) van Moorsel, G., Kemball, A., & Greisen, E. 1996, ASP Confi. Ser. 101, Astronomical Data Analysis Software and Systems V, ed. G. H. Jacoby, & J. Barnes (San Francisco:ASP), 37
- Weiler et al. (2002) Weiler, K. W., Panagia, N., Montes, M. J., & Sramek, R.A. 2002, ARA&A, 40, 387
- Weiler et al. (1990) Weiler, K. W., Panagia, N., & Sramek, R. A. 1990, ApJ, 364, 611
- Whitmore et al. (1999) Whitmore, B. C., Zhang, Q. Leitherer, C., Fall, S. M., Schweizer, F., & Miller, B. W. 1999, AJ, 118, 1551
- Yamaoka et al. (1998) Yamaoka, H., Kato, T., Filippenko, A. V., & Van Dyk, S. D. 1998, IAU Circ. 6859
- Zezas et al. (2003) Zezas, A., Ward, M. J., and Murray, S. S. 2003, ApJ, 594, L31
- Zhao et al. (1997) Zhao, J. H., Anantharamaiah, K. R., Goss, W. M., & Viallefond, F. 1997, ApJ, 482, 186
| Observing | Frequency | Array | Integration | Phase | Derived Flux of | Image rms |
|---|---|---|---|---|---|---|
| Date | Configuration | Time | Calibrator | Phase Calibrator | at Robust=0 aaRobust = 0 indicates that data weighting intermediate between pure natural weighting (highest sensitivity) and pure uniform weighting (highest resolution) was used in producing the image (Briggs, 1995; Briggs, Schwab, & Sramek, 1998). | |
| (GHz) | (min) | (J2000) | (Jy) | (Jy beam-1) | ||
| 1.4 GHz (20 cm) observations | ||||||
| 1991 Aug 3 | 1.46 | A | 143 | J1219+4829 | 0.57 | 57 |
| 4.9 GHz (6 cm) observations | ||||||
| 2000 Oct 24 | 4.86 | A | 177 | J1128+5925 | 0.46 | 20.1 |
| 1994 May 16 | 4.86 | BnA | 5 | J1146+5356 | 0.37 | 97.9 |
| 1993 Dec 19 | 4.86 | D | 14 | J1219+4829 | 0.62 | 50.1 |
| 1993 Jun 11 | 4.86 | CnB | 19 | J1219+4829 | 0.60 | 61.7 |
| 1993 May 7 | 4.86 | B | 15 | J1219+4829 | 0.62 | 54.3 |
| 1993 Mar 13 | 4.86 | B | 25 | J1219+4829 | 0.62bbThe flux of this phase calibrator was estimated from those derived from the other archived data sets taken near the time of this observation. The original observation lacked an amplitude calibrator. | 46.4 |
| 1993 Jan 28 | 4.86 | BnA | 26 | J1219+4829 | 0.61 | 75.3 |
| 1992 Aug 28 | 4.86 | D | 145 | J1146+5848 | 0.37 | 28.3 |
| 1992 Apr 3 | 4.86 | C | 170 | J1146+5848 | 0.37 | 23.4 |
| 1991 Jul 5 | 4.86 | A | 35 | J1219+4829 | 0.49 | 38.2 |
| 1990 May 9 | 4.86 | A | 25 | J1219+4829 | 0.62 | 55.6 |
| 1989 Jan 14 | 4.86 | A | 7 | J1146+5848 | 0.44 | 73.2 |
| 8.4 GHz (3.6 cm) observations | ||||||
| 2001 Mar 19 | 8.46 | B | 171 | J1128+5925 | 0.28 | 17.3 |
| 1999 Apr 7 | 8.46 | D | 31 | J1219+4829 | 0.61 | 44.3 |
| 1999 Jan 21 | 8.46 | C | 32 | J1219+4829 | 0.68 | 33.7 |
| 1994 May 16 | 8.44 | BnA | 15 | J1146+5356 | 0.34 | 29.7 |
| 1994 Feb 18 | 8.44 | D A | 51 | J1219+4829 | 0.66 | 26.4 |
| 1993 Dec 19 | 8.44 | D | 13 | J1219+4829 | 0.65 | 29.3 |
| 1993 Jun 11 | 8.41 | CnB | 19 | J1219+4829 | 0.63 | 46.7 |
| 1993 May 7 | 8.44 | B | 15 | J1219+4829 | 0.64 | 31.2 |
| 1993 Mar 13 | 8.41 | B | 25 | J1219+4829 | 0.66 | 37.1 |
| 1993 Jan 28 | 8.44 | BnA | 21 | J1219+4829 | 0.63 | 25.5 |
| 1991 Jul 5 | 8.44 | A | 32 | J1219+4829 | 0.51 | 34.2 |
| 1991 Jun 22 | 8.42 | A | 50 | J0958+6533 | 1.13 | 37.5 |
| 1990 May 9 | 8.44 | A | 42 | J1219+4829 | 0.62 | 37.1 |
| 1990 Mar 4 | 8.44 | A | 15 | J1217+5835 | 0.45 | 50.1 |
| 1990 Feb 24 | 8.44 | A | 15 | J1217+5835 | 0.47 | 30.5 |
| Observing | Frequency | Array | Data | Integration | Image rms | Beam Size |
|---|---|---|---|---|---|---|
| Date | Configuration | Rate | Time | at Robust=5aaRobust = 5 indicates that pure natural weighting of the data was used in producing the images (Briggs, 1995; Briggs, Schwab, & Sramek, 1998). | at Robust=5aaRobust = 5 indicates that pure natural weighting of the data was used in producing the images (Briggs, 1995; Briggs, Schwab, & Sramek, 1998). | |
| (GHz) | (Mbit s-1) | (min) | (Jy beam-1) | (mas) | ||
| 2002 Apr 29 | 2.27 | VLBA+GBT | 256 | 330 | 35 | |
| 2003 Feb 09 | 8.41 | VLBA | 256 | 438 | 51 | |
| 2003 May 01 | 2.27 | VLBA | 128 | 58 | 162 | |
| 2003 May 01 | 4.98 | VLBA | 128 | 53 | 129 | |
| 2003 May 01 | 8.41 | VLBA | 128 | 53 | 137 | |
| 2003 May 01 | 15.36 | VLBA | 128 | 167 | 152 |
| Source | RA | Dec | Major AxisbbMeasured at 8.4 GHz | Minor AxisbbMeasured at 8.4 GHz | P.A.bbMeasured at 8.4 GHz | |||
|---|---|---|---|---|---|---|---|---|
| (J2000) | (J2000) | (mJy) | (mJy) | (mJy) | (arcsec) | (arcsec) | (deg) | |
| A | 11 28 33.63 | 58 33 46.67 | 163.38.2 | 101.15.0 | 77.23.9 | 0.38 | 0.30 | 127 |
| B1 | 11 28 30.99 | 58 33 40.78 | 41.62.1 | 11.10.6 | 9.10.5 | 0.27 | 0.25 | 100 |
| C | 11 28 30.65 | 58 33 49.29 | 21.81.1 | 6.90.4 | 5.90.3 | 0.83 | 0.74 | 32 |
| C′ | 11 28 31.33 | 58 33 50.02 | 12.20.3 | 4.70.3 | 4.10.2 | 0.49 | 0.36 | 28 |
| DbbMeasured at 8.4 GHz | 11 28 33.01 | 58 33 36.55 | 0.910.08 | 1.940.10 | 2.430.12 | 0.17 | 0.11 | 168 |
| Image Properties | ||||||||
| 1.4 GHz | 4.9 GHz | 8.4 GHz | ||||||
| Restoring Beam | 1.′′210.′′88 | 0.′′380.′′31 | 0 .′′380.′′31 | |||||
| Beam P. A. | -38∘ | 17∘ | 17∘ | |||||
| rms (Jy beam-1) | 67 | 17 | 13 | |||||
| Source | |||
|---|---|---|---|
| (mJy) | (mJy) | (mJy) | |
| A | 163.38.2 | 115.05.8 | 87.14.4 |
| B1 | 41.62.1 | 20.11.0 | 14.50.7 |
| C | 21.81.1 | 11.00.6 | 7.70.4 |
| C′ | 12.20.6 | 6.70.3 | 5.10.3 |
| D | 0.910.08 | 1.730.09 | 2.450.32 |
Note. — All measurements made from images with 1.21 0.88 beam, Position Angle -38 degrees E of N.
| Source | (8.4 GHz) | (8.4 GHz) | SN Rate | ||
|---|---|---|---|---|---|
| ( K) | (W Hz-1) | (yr-1) | |||
| A | 17.1 | 27,500 | 0.5–1.0 | ||
| B1 | 3.4 | 4580 | 0.1–0.2 | ||
| C | 0.2 | 2430 | 0.05–0.1 | ||
| C′ | 0.6 | 1610 | 0.03–0.06 | ||
| D | 3.3 | 770 |
Note. — Spectral indices, total radio powers, and supernova rates are measured from the matched-resolution data given in Table 4. Peak brightness temperatures are measured from the highest resolution data, given in Table 3. Supernova rates are derived using Equation (2) in Section 5.3, witn =0.1–0.2. No supernova rate is estimated for Source D because its spectrum does not fit the assumptions made in deriving Equation 2.
| Source | RA | Dec | aaExcept as noted, 2.3 GHz measurements are from 2002 April 29 and 8.4 GHz measurements are from 2003 February 9 | aaExcept as noted, 2.3 GHz measurements are from 2002 April 29 and 8.4 GHz measurements are from 2003 February 9 | Major Axis | Minor Axis | P.A. |
|---|---|---|---|---|---|---|---|
| Designation | (J2000) | (J2000) | (mJy) | (mJy) | (mas) | (mas) | (deg) |
| A0 | 11 28 33.6212 | 58 33 46.707 | |||||
| A1 | 11 28 33.6199 | 58 33 46.699 | |||||
| A2 | 11 28 33.6218 | 58 33 46.655 | |||||
| A3 | 11 28 33.5931 | 58 33 46.560 | |||||
| A4 | 11 28 33.6502 | 58 33 46.538 | |||||
| D (2002 Apr 29) | 11 28 33.0108 | 58 33 36.549 | |||||
| D (2003 Feb 9) | 11 28 33.0108 | 58 33 36.549 | |||||
| D (2003 May 1) | 11 28 33.0107 | 58 33 36.549 | 1.8 | 1.1 | 141 |
| Source | aaSpectral indices between 2.3 and 8.4 GHz for all components within Source A are computed using the lowest noise data from 2002 April (2.2 GHz) and 2003 February (8.4 GHz), since there is no evidence of variability in these components. Source D appears to have varied, so only the simultaneous data from 2003 May 1 were used for computing its spectrum. | bbBrightness temperatures for A1, A2, A3, and A4 are based on 8.4 GHz measurements from 2003 February; two values are given for Source D, for two epochs. | (8.4 GHz) | |
|---|---|---|---|---|
| (K) | (W Hz-1) | |||
| A0 | 990 | |||
| A1 | 180 | |||
| A2 | 200 | |||
| A3 | 120 | |||
| A4 | 120 | |||
| D (2003 Feb 9) | 680 | |||
| D (2003 May 1) | 1040 |
| Source | ||||
|---|---|---|---|---|
| (mJy) | (mJy) | (mJy) | (mJy) | |
| A0 | ||||
| A1 | ||||
| A2 | ||||
| A3 | ||||
| A4 | ||||
| D |
| Date | Config. | A | B1 | C | C′ | D |
|---|---|---|---|---|---|---|
| (mJy) | (mJy) | (mJy) | (mJy) | (mJy) | ||
| 4.9 GHz | ||||||
| 2003 May 01 | VLBA | |||||
| 2002 Apr 29 | A | |||||
| 2000 Oct 24 | A | |||||
| 1994 May 16 | BnA | |||||
| 1993 May 07 | B | |||||
| 1993 Mar 13 | B | |||||
| 1993 Jan 28 | BnA | |||||
| 1991 Jul 05 | A | |||||
| 1990 May 09 | A | |||||
| 1989 Jan 14 | A | |||||
| 8.4 GHz | ||||||
| 2003 May 01 | VLBA | |||||
| 2003 Feb 09 | VLBA | |||||
| 2002 Apr 29 | A | |||||
| 2001 Mar 19 | B | |||||
| 1999 Oct 28 | B | |||||
| 1994 May 16 | BnA | |||||
| 1994 Feb 18 | A | |||||
| 1993 May 07 | B | |||||
| 1993 Mar 13 | B | |||||
| 1993 Jan 28 | BnA | |||||
| 1991 Jul 05 | A | |||||
| 1991 Jun 22 | A | |||||
| 1990 May 09 | A | |||||
| 1990 Mar 04 | A | |||||
| 1990 Feb 24 | A | |||||