THE PURPLE HAZE OF ETA CARINAE: BINARY-INDUCED VARIABILITY?11affiliation: Based on observations made with the NASA/ESA Hubble Space Telescope, obtained at the Space Telescope Science Institute, which is operated by the Association of Universities for Research in Astronomy, Inc., under NASA contract NAS5-26555.
Abstract
Asymmetric variability in ultraviolet images of the Homunculus obtained with the Advanced Camera for Surveys/High Resolution Camera on the Hubble Space Telescope suggests that Carinae is indeed a binary system. Images obtained before, during, and after the recent “spectroscopic event” in 2003.5 show alternating patterns of bright spots and shadows on opposite sides of the star before and after the event, providing a strong geometric argument for an azimuthally-evolving, asymmetric UV radiation field as one might predict in some binary models. The simplest interpretation of these UV images, where excess UV escapes from the secondary star in the direction away from the primary, places the major axis of the eccentric orbit roughly perpendicular to our line of sight, sharing the same equatorial plane as the Homunculus, and with apastron for the hot secondary star oriented toward the southwest of the primary. However, other orbital orientations may be allowed with more complicated geometries. Selective UV illumination of the wind and ejecta may be partly responsible for line profile variations seen in spectra. The brightness asymmetries cannot be explained plausibly with delays due to light travel time alone, so a single-star model would require a seriously asymmetric shell ejection.
1 INTRODUCTION
Since Carinae is potentially the most massive, most luminous, and most unstable star known, it would be valuable to know if it is indeed an interacting binary system. A debate concerning the possibility that Car may be a binary (or more specifically, what role a companion star plays) has been ongoing since a 5.5 yr period was discovered by Damineli (1996; see also Corcoran et al. 2001; Damineli et al. 1997, 2000; Davidson 1999; Davidson et al. 2000; Duncan & White 2003; Duncan et al. 1997; Ishibashi et al. 1999; Whitelock et al. 2004; as well as contributions in Morse et al. 1999). Part of the reason for the ongoing debate is that spectroscopic changes seem to be explained equally-well with either a binary system or a shell ejection (Zanella et al. 1984; Davidson 1999; Smith et al. 2003a). Furthermore, spectroscopy of the central star with the Hubble Space Telescope (HST) by Davidson et al. (2000) did not confirm Doppler shifts measured in ground-based data that were interpreted as orbital reflex motion (Damineli et al. 1997). However, continued monitoring in X-rays and the near-infrared (IR) has established a period of 2023 days (Damineli et al. 2000; Whitelock et al. 2004), and the very hard X-ray spectrum is difficult to explain without a colliding-wind binary (Corcoran et al. 2000, 2001; Ishibashi 2001; Ishibashi et al. 1999; Pittard & Corcoran 2002). If Car is a binary, the most plausible scenario involves a very massive primary with a dense wind, and a less massive (30 M⊙) hot O-type secondary with a 2,000–3,000 km s-1 wind in a highly-eccentric orbit (Corcoran et al. 2001; Ishibashi 2001; Pittard & Corcoran 2002; Morse et al. 1999).
Yet, this hypothetical companion star continues to evade direct detection as its emission is dwarfed at most wavelengths by the primary. Since the primary star’s dense wind extinguishes much of its own far-UV luminosity (Hillier et al. 2001), and because the hypothetical companion star is probably an O-type star, we may have the best hope of detecting the companion’s radiation in the UV.
The “Purple Haze” is a diffuse blueish/purple glow within a few arcseconds of the central star in HST images of the Homunculus (Morse et al. 1998; Smith et al. 2000, 2004). This emission is seen in excess of violet starlight scattered by dust, and the strength of the excess increases into the far UV (Smith et al. 2004; hereafter Paper I). This increasing excess is UV emission arising in the outer parts of Car’s stellar wind, even if it is a single star (Paper I; Hillier et al. in prep.). In Paper I we argued that the UV excess emission originates near the equatorial plane, confined by a dust torus seen at thermal-IR wavelengths (Smith et al. 1998, 2002, 2003b; Morris et al. 1999), although there may also be a contribution from the Little Homunculus nebula (Ishibashi et al. 2003). This equatorial UV emission probably results from a latitude-dependent radiation field, as UV escapes more easily from lower-density equatorial zones in the bipolar wind of Car (Smith et al. 2003a). Note that the wind of Car is latitude dependent, regardless of whether that wind structure is caused by a rotating primary, induced by a companion star, or both (Smith et al. 2003a).
If a hot companion star contributes to this UV excess, then observations of the “Purple Haze” may offer a critical geometric test of the binary hypothesis. Specifically, if Car has a hot companion, its UV radiation should escape preferentially in directions away from the primary, with a UV “shadow” cast on the opposite side of the primary near periastron, when the primary’s dense wind would obstruct the secondary’s far-UV light over a substantial and time-varying solid angle. This assumption provides a simple but strong qualitative prediction, and here we present evidence that this binary scenario is applicable to Car.
2 OBSERVATIONS
To study potential changes in the Purple Haze, we used UV and visual-wavelength images of Car from the Advanced Camera for Surveys/High Resolution Camera (ACS/HRC) on HST using the F220W, F250W, F330W, and F550M filters obtained as part of the Car Treasury program (P.I.: Davidson). The various contributions of continuum and emission lines in each filter have been described in Paper I. All four filters were employed on several occasions before, during, and after the mid-2003 spectroscopic event, as summarized in Table 1. After the initial observations in 2002 October, we designed the remaining observations so that the two field stars located 30 northwest of the central star would always be included in the HRC field of view, in order to facilitate accurate spatial alignment of the various epochs. Because of limited space here, we refer the reader to more detailed discussions of our data reduction procedures (including careful corrections for geometric distortion) described in Paper I, Morse et al. (1998, 2001), and Smith et al. (2000).
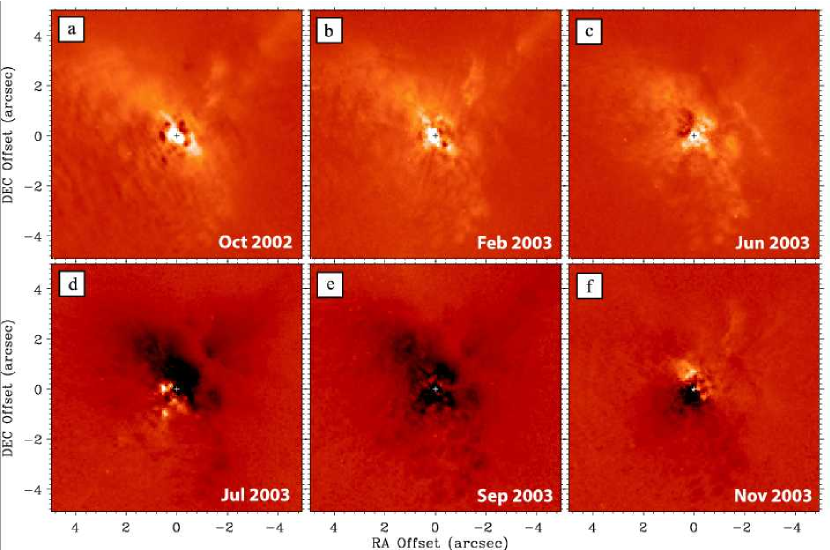
The multi-epoch images showed subtle intensity changes from one epoch to the next, which are, however, difficult to convey on the printed page. To reveal this flux variability as a function of position in the nebula, Figure 1 shows difference images — i.e. each frame of Figure 1 shows the result of the original image at the indicated date with the average of all epochs subtracted. Thus, bright knots in Figure 1 are brighter than the 1 yr average, and dark regions are fainter than average. The intensity range in Figure 1 is 10-12 ergs s-1 cm-2 Å-1 arcsec-2, which is very roughly 25% of the average flux at about 05 from the central star where the most pronounced variability is seen, and is roughly a factor of 103 larger than the 1 subtraction residuals near the edges of the images. Figure 1 shows results for the F220W filter, where the variability is the most dramatic. The F250W and F330W filters show identical qualitative changes (confirming that these are not artifacts due to errors in spatial alignment, polarization losses, or other effects), but the variability is less pronounced at longer wavelengths as the Purple Haze diminishes (compared to F220W, the excess is roughly 80% and 30% as strong in the F250W and F330W filters, respectively; Paper I).
Table 1 also lists the phase of each observation in the 5.5 yr cycle. These were calculated assuming that =0 is JD=2452840.3, defined by the minimum of the K-band light curve reported by Whitelock et al. (2004), and adopting their period of 2023 days. However, for extended features there is an effective phase delay due to light travel time. Most of the variability we describe below is typically at 05–1 from the star. Delay times are a couple of weeks to a month, requiring a correction as large as =–0.01 to –0.02. With that correction, the 2003 Sep image is closest to the actual event as seen by circumstellar ejecta, and the 2003 Jul image traces ejecta that see the pre-event radiation field. Another effect near periastron, simlar to a time delay, is that UV radiation from the secondary star will escape the primary’s wind through a “cavity” created by its own less dense stellar wind which trails behind the secondary in its orbit.
3 DISCUSSION
3.1 Variability of the Purple Haze
The UV variability in Figure 1 is a relatively small perturbation on the observed brightness distribution of the Homunculus. It represents roughly 25% of the average total flux at a given position, and only about 1/3 of the excess UV emission at 05 from the star in the 2002 Oct F220W image (see Paper I). Thus, the UV excess is still dominated by the intrinsic UV radiation-field geometry of the primary star, which is expected to have a strong 2200 Å excess at large radii in the wind (Paper I). In other words, the 2200 Å morphology at all epochs during the event looks basically the same as described in Paper I. 111Caveat: this comment refers to the distribution of UV flux at 2200 Å, which is not the same as the distribution of Lyman continuum radiation.
Nevertheless, Figure 1 reveals important activity near the star around the time of Car’s most recent spectroscopic event. In particular, the bottom row of images in Figure 1 (panels , , and ) shows pronounced asymmetry that changes with time. In 2003 Jul (before the event because of light travel time), we see excess UV emission toward the SE, and a shadow toward the NW. Then in 2003 Sep (Fig. 1), there is a UV deficit everywhere (as the ejecta are now seeing the event itself, when the hot companon is presumably buried in the primary’s optically-thick wind and the far-UV emission is thermalized). Later in 2003 Nov, the UV brightness distribution is the opposite of that just before the event in 2003 Jul – i.e., now it is bright toward the NW and shadowed toward the SE. These distinct and systematic changes in the observed asymmetry suggest strongly that Car is indeed a binary system, including a hot companion and a primary with a very dense wind that blocks UV radiation at scales larger than the orbital radius at periastron.
Pre-event images in the top row of Figure 1 show little variability, except for some fading toward the NE of the star in 2003 Jun. This is consistent with any model of the event – in a single star model the shell ejection has not yet occurred, and in a binary model the companion is still far enough away from the primary (about 8 AU; Damineli et al. 1997) that its UV radiation is able to escape across a wide sold angle.
Figure 1 is the first demonstration of severe geometric asymmetry that changes rapidly around the time of an event, but it is not the first sign of variable UV flux reaching the ejecta during the 5.5 yr cycle. HST/WFPC2 images also showed changes in extended structure on longer timescales during the 5.5 yr cycle (Smith et al. 2000), continued monitoring at radio wavelengths has shown dramatic structural changes in the ejecta (Duncan et al. 1995, 1997; Duncan & White 2003), and near-IR images showed structural changes similar to those seen in the radio (Smith & Gehrz 2000). Variability in the radio and IR traces free-free emission from ionized gas, and hence, the Lyman continuum radiation field, whereas the F220W filter images trace longer UV wavelengths riddled with Fe ii absorption in the wind. Additionally, van Genderen et al. (1999) noted changes in the near-UV photometry associated with events. All these types of variability have been interpreted as arising in equatorial gas, and in Paper I we argued that the UV excess itself is primarily equatorial. This emission does not signify a true disk (i.e. a strong equatorial density enhancement), but rather, it probably arises because UV radiation is able to escape Car’s dense wind more easily at low-latitudes where the optical depth is usually lower (Smith et al. 2003a). Our results reported here modify this idea in the sense that a hot companion also seems to contribute some of the equatorial UV excess. A hot companion contributing a fraction of the observed UV flux is consistent with the composite nature of Car’s far-UV spectrum (Ebbets et al. 1997). If a hot secondary star contributes substantially to the observed UV flux, then only the shadow knows the uncontaminated spectrum of the primary star.
3.2 Selective Illumination
Damineli et al. (1997, 2000) reported Doppler shifts of broad lines (especially He i) in ground-based spectra that change systematically with the 5.5 yr cycle. Damineli et al. interpreted these shifts as orbital reflex motion in an eccentric binary system with the major axis of the orbit almost along our line of sight. However, these velocity shifts around the event were not observed in high spatial resolution spectra obtained with HST (Davidson et al. 2000), raising doubts about the orbit solution and the binary hypothesis.
From our images, it is clear that UV radiation escapes to large radii outside the wind in preferred directions that vary during the event. It is plausible, then, that this selective UV illumination of the ejecta may affect observed line profiles seen in ground-based data. Directional UV illumination would also operate within the more compact stellar wind enveloping the binary system, but the effect on the resulting emission-line profiles may be non-intuitive. This scenario might help explain why different emission lines show different Doppler-shift patterns (Davidson et al. 2000), since various lines arise from different radii in the wind. This would not be as easily explained if the observed line profile shifts were due to orbital reflex motion. In summary, we think the observed “Doppler shifts” do not trace the motion of either star in a hypothetical binary system, but instead represent the selective illumination of certain portions of the outflowing stellar wind and ejecta indicated by the observed geometry in our UV images.
3.3 Qualitative Constraints on the Orbit
If we abandon the idea that observed line profile variations of broad lines are caused by orbital reflex motion, following the discussion in the previous section, then we are free to investigate possible alternative orientations for the orbit. The observed UV variability gives vital clues to the orientation of the putative orbit if we assume that UV radiation from the companion star escapes more easily in the direction away from the primary star. Analysis of X-ray emission indicates that the orbit is likely to be highly eccentric, with 0.8 to 0.9 (Corcoran et al. 2001; Ishibashi et al. 1999; Ishibashi 2001).
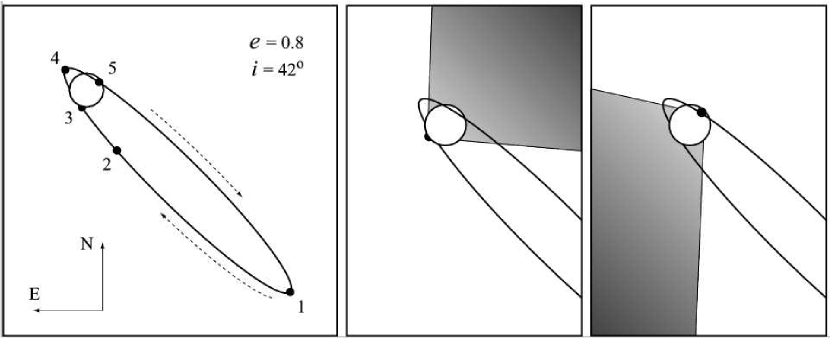
From our data, the tightest constraints on the geometry come from the illumination of the ejecta just before and after the event — 2003 Jul and 2003 Nov if we account for light travel time. Since the secondary’s UV radiation escapes preferentially toward the SE before the event, and since the illuminated wind and ejecta are primarily equatorial, this implies that the hot companion star is on the far side of the primary before the event. Similarly, the hot companion would be on the near side of the primary after the event when UV escapes toward the NW. This is also supported by the variability of some faint filaments in the blueshifted “Fan” region more than 1 NW of the star (see Paper I), which appear after the event. The projected directions of “shadows” and excess UV emission suggest that the major axis of the highly-eccentric orbit is not oriented along our line of sight, but is instead roughly perpendicular to it, as sketched in Figure 2. Shadows may be caused by the dense wind of the primary star absorbing UV radiation from the secondary; thus, the shadows are seen in the direction opposite that of the secondary’s escaping UV.222Of course, this does not preclude a more complicated scenario where close passage of a companion at periastron induces a latitude-dependent shell ejection (Smith et al. 2003a). This scenario allows us to constrain the orientation of the orbit based on the required relative positions of the primary and secondary (Fig. 2). This is obviously a qualitative conclusion, but follows from a simple geometric rationale.
Using our images to deduce the direction of apastron is less straightforward, but the location of the hot secondary during the high-excitation phase between events is probably toward the SW of the primary star (at position 1 in Fig. 2). This is because shortly before the event in 2003 Jun (between positions 2 and 3 in Fig. 2), when the hot companion is approaching very close to the primary, the UV excess is stronger toward the SW (even at large distances from the star not shown in Fig. 1), and we see a shadow developing toward the NE of the star at this epoch. This orbital geometry has many potential consequences for various structures in the extensive nebula around Car — especially the NN “jet” and the S Condensation (Smith & Morse 2004; Walborn 1976).
When combined with constraints from X-ray observations, these geometric clues from the UV variability will hopefully be useful to help predict line profile shapes and other types of observable changes. It is relevant to note that an orientation of the major axis roughly perpendicular to our line of sight is consistent with some interpretations of the X-ray light curve (Ishibashi 2001; Corcoran et al. 2001). To our knowledge, Ishibashi (2001) first showed that an orientation perpendicular to our line of sight provided the best fit to the asymmetry in the X-ray emission before and after the event; at the time, this suggestion seemed to contradict the favored binary model with the major axis pointed toward us (Damineli et al. 1997, 2000).
Our observations suggest that Car is in fact a binary system consistent with interpretations of several other datasets, although combining all data to formulate a consistent model for the events remains a formidable task. A single star would need to perform impressive contortions to account for the observed asymmetry in UV images.
References
- (1)
- (2) Corcoran, M.F., Fredericks, A.C., Petre, R., Swank, J.H., & Drake, S.A. 2000, ApJ, 545, 420
- (3)
- (4) Corcoran, M.F., Ishibashi, K., Swank, J.H., & Petre, R. 2001, ApJ, 547, 1034
- (5)
- (6) Damineli, A. 1996, ApJ, 460, L49
- (7)
- (8) Damineli, A., Conti, P.S., & Lopes, D.F. 1997, NewA, 2, 107
- (9)
- (10) Damineli, A., Stahl, O., Kaufer, A., Wolf, B., Quast, G., & Lopes, D.F. 2000, A&AS, 133, 299
- (11)
- (12) Davidson, K. 1999, in ASP Conf. Ser. 179, Eta Carinae at the Millenium, ed. J.A. Morse, R.M. Humphreys, & A. Damineli (San Francisco: ASP), 304
- (13)
- (14) Davidson, K., Ishibashi, K., ull, T.R., Humphreys, R.M., & Smith, N. 2000, ApJ, 530, L107
- (15)
- (16) Duncan, R.A., & White, S.M. 2003, MNRAS, 338, 425
- (17)
- (18) Duncan, R.A., White, S.M., Nelson, G.J., Drake, S.A., & Kundu, M.R. 1995, ApJ, 441, L73
- (19)
- (20) Duncan, R.A., White, S.M., & Lim, J. 1997, MNRAS, 290, 680
- (21)
- (22) Ebbets, D.C., Walborn, N.R., & Parker, J.W. 1997, ApJ, 489, L161
- (23)
- (24) Hillier, D.J., Davidson, K., Ishibashi, K., & Gull, T.R. 2001, ApJ, 553, 837
- (25)
- (26) Ishibashi, K. 2001, in ASP Conf. Ser. 242, Eta Carinae and Other Mysterious Stars, ed. T.R. Gull, S. Johansson, & K. Davidson (San Francisco: ASP), 53
- (27)
- (28) Ishibashi, K., Corcoran, M.F., Davidson, K., Swank, J.H., Petre, R., Drake, S.A., Damineli, A., & White, S. 1999, ApJ, 524, 983
- (29)
- (30) Ishibashi, K., et al. 2003, AJ, 125, 3222
- (31)
- (32) Morris, P.W., et al. 1999, Nature, 402, 502
- (33)
- (34) Morse, J.A., Davidson, K., Bally, J., Ebbets, D., Balick, B., & Frank, A. 1998, AJ, 116, 2443
- (35)
- (36) Morse, J.A., Humphreys, R.M., & Damineli, A. (eds.) 1999, ASP Conf. Ser. 179, Eta Carinae at the Millenium, (San Francisco: ASP)
- (37)
- (38) Morse, J.A., Kellogg, J.R., Bally, J., Davidson, K., Balick, B., & Ebbets, D 2001, ApJ, 548, L207
- (39)
- (40) Pittard, J.M., & Corcoran, M.F. 2002, A&A, 383, 636
- (41)
- (42) Smith, N., & Gehrz, R.D. 2000, ApJ, 529, L99
- (43)
- (44) Smith, N., Gehrz, R.D., & Krautter, J. 1998, AJ, 116, 1332
- (45)
- (46) Smith, N., & Morse, J.A. 2004, ApJ, 605, 854
- (47)
- (48) Smith, N., Morse, J.A., Davidson, K., & Humphreys, R.M. 2000, AJ, 120, 920
- (49)
- (50) Smith, N., Davidson, K., Gull, T.R., Ishibashi, K., & Hillier, D.J. 2003a, ApJ, 586, 432
- (51)
- (52) Smith, N., Gehrz, R.D., Hinz, P.M., Hoffmann, W.F., Mamajek, E.E., Meyer, M.R., & Hora, J.L. 2002, ApJ, 567, L77
- (53)
- (54) Smith, N., Gehrz, R.D., Hinz, P.M., Hoffmann, W.F., Hora, J.L., Mamajek, E.E., & Meyer, M.R. 2003b, AJ, 125, 1458
- (55)
- (56) Smith, N., et al. 2004, ApJ, 605, 405
- (57)
- (58) van Genderen, A.M., Sterken, C., de Groot, M., & Burki, G. 1999, A&A, 343, 847
- (59)
- (60) Walborn, N.R. 1976, ApJ, 204, L17
- (61)
- (62) Whitelock, P.M., et al. 2004, MNRAS, in press
- (63)
- (64) Zanella, R., Wolf, B., & Stahl, O. 1984, A&A, 137, 79
- (65)
| Date | MJD | Phase | |
|---|---|---|---|
| a | 2002 Oct 14 | 52561.1 | 0.906 |
| b | 2003 Feb 12 | 52682.6 | 0.922 |
| c | 2003 Jun 13 | 52803.1 | 0.982 |
| d | 2003 Jul 20 | 52840.2 | 0.000 |
| e | 2003 Sep 13 | 52896.0 | 0.028 |
| f | 2003 Nov 14 | 52957.8 | 0.058 |