Spatial Distribution of Warm Dust in Early-Type Galaxies.
Abstract
Images taken with the IRAC instrument on the Spitzer Space Telescope show that the spatial distribution of warm dust emission in lenticular galaxies is often organized into dynamically-stable structures strongly resembling spiral arms. These galaxies have bulge-to-disk-ratios and colors for their stellar content appropriate for their morphological classification. Two of the three galaxies with warm dust detected at 8.0 µm also show far-IR emission expected from that dust. More importantly, the color of the dust emission matches the colors found for late-type, star-forming galaxies, as well as theoretical predictions for PAH emission from dust grains. The spatially resolved dust structures may be powerful indicators of the evolutionary history of the lenticular class of galaxies, either as a tracer of on-going quiescent star formation or as a fossil record of a previous episode of more active star formation.
Spitzer Space Telescope special issue
1 Introduction
While late-type spiral galaxies have long been known to contain an interstellar medium in cold, warm, and hot phases, only during the last several decades was the same demonstrated for at least some early-type galaxies. Many early-type galaxies, for example, have significant quantities of cold gas in H I (Knapp et al. 1985; van Gorkom & Schiminovich 1997) and hot gas seen at X-ray wavelengths (Kim et al. 1992).
The warm gas phase was detected in early-type galaxies via its dust emission at far-IR wavelengths with IRAS (Jura et al., 1987; Knapp et al., 1989) and at optical wavelengths from atomic gas emission (Caldwell, 1984; Phillips et al., 1986). Later, ISO detected polycyclic aromatic hydrocarbon (PAH) lines in the mid-IR (Lu et al., 2003; Xilouris et al., 2004). Of order half or more early-type galaxies exhibit either far-IR dust or optical ionized gas emission, although the detection rate in the infrared could be lower if the effects of an AGN are removed (Bregman et al., 1998). While ionized gas regions are typically extended structures (Pogge & Eskridge, 1993; Goudfrooij et al., 1994), obscuration at optical wavelengths implies dust masses that are a small fraction of those implied by the infrared emission. Ionized gas may be an incomplete tracer of the warm ISM because it will only appear in regions where there is sufficient massive star formation to produce ionizing photons. Current knowledge of the distribution of warm dust emission within early-type galaxies indicates that it mostly follows the light distributions (e.g., Athey et al. 2002) and hence is thought to arise from processes other than star formation such as AGN mass loss. The exceptions to this statement are a few galaxies with somewhat extended structures in µm ISO images that have been interpreted as dust lanes (e.g., Xilouris et al., 2004).
This paper presents observations at µm taken with the new Spitzer Space Telescope. The mid-IR imaging capability of the Spitzer improves the spatial resolution over previous missions by a factor of a few and the sensitivity by more than an order of magnitude. These new images show that several early-type galaxies have substantial structure in the distribution of their warm dust as traced by PAH emission bands at – µm.
2 Sample
The six galaxies presented here are the first early-type galaxies observed from a total sample of galaxies that will be observed with the Spitzer Space Telescope. This 100 galaxy sample is, in turn, drawn from a “parent” sample of Ho, Filippenko, & Sargent (1997), which includes nearly 500 northern galaxies brighter than mag. Some details are given in a companion paper Pahre et al. (2004). We consider the 100 galaxy sample to be “representative” of the magnitude-limited parent sample, as the former was drawn to represent the full range of morphological types and luminosities found in the latter.
3 Observations
The data were taken with the InfraRed Array Camera (IRAC; Fazio et al., 2004) on the Spitzer Space Telescope Werner et al. (2004) during the first four IRAC campaigns of normal operations (2003 December – 2004 March). Six galaxies were imaged, each using five exposures of either 12 or 30 seconds each on the source in all four detectors (3.6, 4.5, 5.8, and 8.0 µm). The standard pipeline BCD (Basic Calibrated Data, versions 8.9 through 9.5) products were used in the reductions. The first 5.8 µm image taken for each galaxy had an additional “first-frame delta skydark” subtracted from it, which was based on an independent dataset. This additional dark image subtraction step corrects an instrumental artifact that is not removed using the current pipeline processing library of sky dark images. The bias level for the 5.8 µm images was significantly variable such that the median value of the background plus bias (which was iteratively determined via a sigma-clipping algorithm) had to be subtracted from each individual frame before mosaicing.
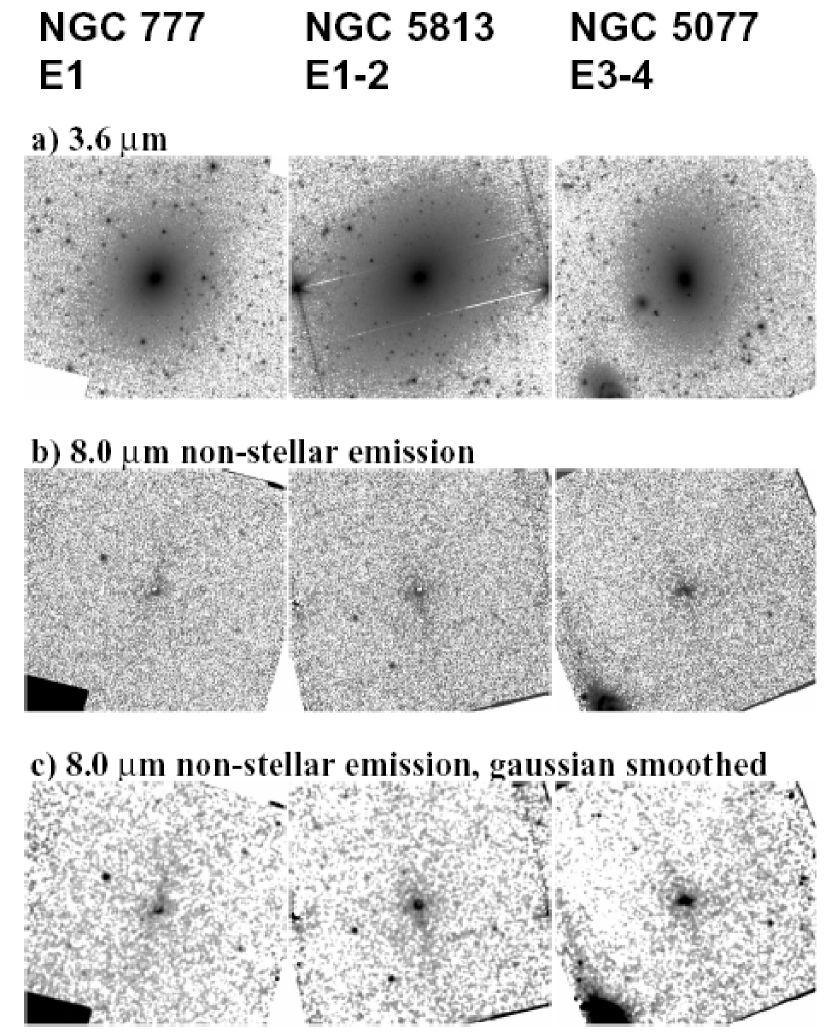
A mosaic of each target in each bandpass was made using custom software operating under the iraf environment and using the wcstools package Mink (2002). Optical distortion was removed in the process, and the images were subpixellated to arcsec, which is a linear reduction by a factor of in each dimension. A first iteration mosaic was constructed using a median combination of the individual frames. Each separate BCD frame was then compared with the mosaic, and differences much larger than the amount expected from the known noise were assumed to be cosmic rays or other artifacts. Pixels affected were flagged as invalid, and the resulting cleaned frames were then combined into the final mosaic. There are some residual instrumental artifacts remaining in the images, such as banding and muxbleed111See http://ssc.spitzer.caltech.edu/irac/dh/ ., but these are masked out for the surface photometry described below. The resulting 3.6 µm images are shown in Figures 1 and 2.
Quantitative data in this paper are given in instrumental magnitudes relative to Vega. The existing calibration of IRAC data is based on point source observations (Fazio et al., 2004). Extended sources will have aperture corrections different from those for point sources, and the correct values are still unknown. For this work, we base aperture corrections on the elliptical galaxy NGC 777 (catalog ads/sa.spitzer#0004431104), which shows the least evidence for any dust emission.222We assume a pure stellar spectrum matching that of an M0 III star. Similar results would be obtained if the assumption were made for galaxies NGC 5077 (catalog ads/sa.spitzer#0004478976) or NGC 5813 (catalog ads/sa.spitzer#0004490496). Since the near-infrared colors of old stellar populations match M giants Frogel et al. (1978), we have chosen to assume an M giant SED for the purpose of calibrating the mid-IR aperture corrections. The resulting corrections, representing the ratio of point source flux in a 12.2 arcsec aperture to that in an infinite aperture, are mag for wavelengths µm.333An independent estimate of the extended source aperture correction was derived from the wings of the PSF from an observation of the bright star Fomalhaut. The results from NGC 777 derived here agree within mag with preliminary estimates based on the flux at arcsec from the Fomalhaut observations—except for 5.8 µm, where the galaxy magnitudes implied by the Fomalhaut data are mag fainter. None of our main conclusions depends on the uncertain 5.8 µm aperture correction. If NGC 777 does have dust emission after all, then the other galaxies will have correspondingly larger amounts of dust emission than derived here. The absolute calibration is based on Vega flux densities of Jy at effective wavelengths of (3.55, 4.49, 5.66, and 7.84 µm in the four IRAC bands.
4 Analysis
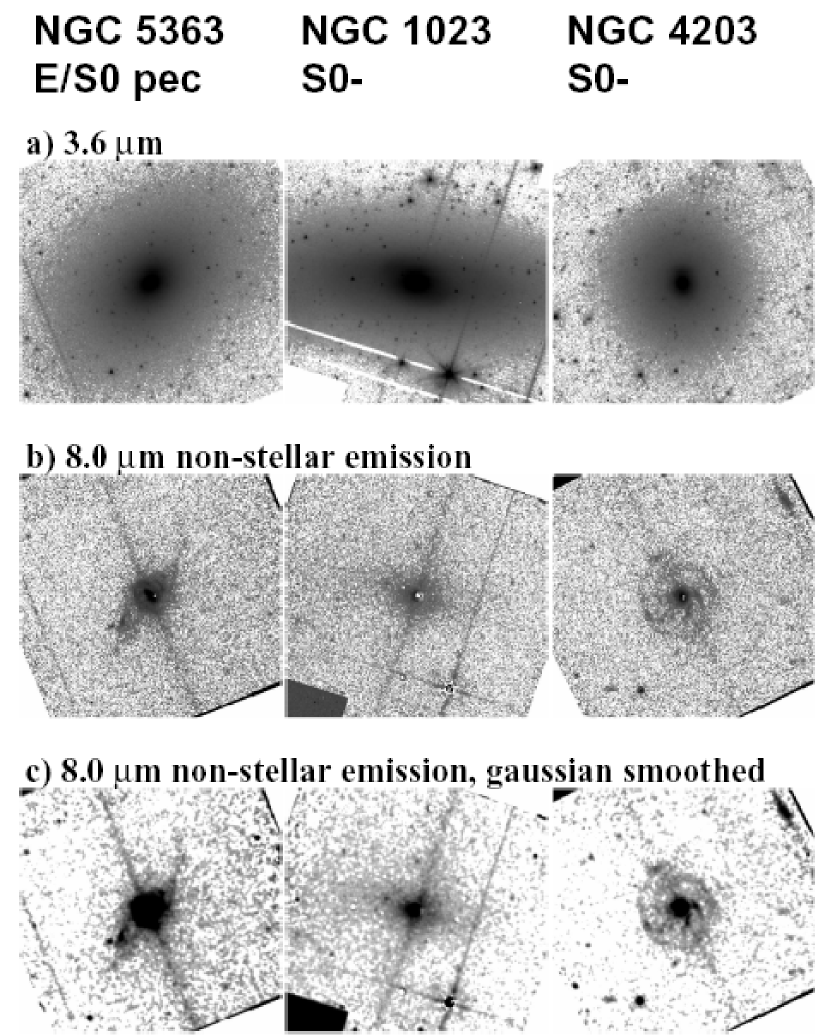
For each galaxy, the color is nearly constant with radius and is consistent with stellar photosphere emission. Dust emission is likely to be important at longer wavelengths. The stellar emission was subtracted from the and µm images using the average of the and µm images, each suitably scaled to match the theoretical colors of M0 III stars: mag (M. Cohen and T. Megeath, private comm.).444The blue color is most likely due to CO absorption in the 4.5 µm bandpass for the cool giant stars that dominate the light at these wavelengths (M. Cohen, private comm.). For example, the 3.6 µm image (in units of MJy/sr) would be multiplied by a factor of in order to model the 5.8 µm image flux, where the first term accounts for the assumed stellar color (Vega-relative), the second term has the aperture corrections for the two wavelengths, and the third term is the ratio of the flux of Vega in the two bandpasses. The residual 8.0 µm images are referred to as “non-stellar” emission555Some authors in the literature refer to images such as these as “dust images,” but we choose to use the term “non-stellar images” to reinforce the point that AGN emission could be present. and are shown in Figures 1 and 2. These non-stellar emission images were also smoothed using a gaussian kernal of pixel ( arcsec) in order to highlight any faint, extended emission features. The smoothed images are also shown in Figures 1 and 2.
Surface photometry was measured on the galaxies using the IRAF task ELLIPSE, following the methodology of Pahre (1999). Point sources were identified and masked using the 2MASS point source catalog (PSC) while excluding the source at the galaxy’s location; additional, fainter point sources were identified and masked by eye in the µm image. The surface photometry was first measured on the µm image, then the flux at each isophote was measured for the other wavelengths using the isophotal shapes defined from the µm image. This ensures that the colors are measured for identical regions of the galaxy in all images. Two surface brightness profiles were calculated for each galaxy: one allowing ellipticity to vary with radius, and another using circular apertures. Corrections for flux lost due to the PSF were applied to the surface brightness and aperture magnitude profiles in the manner described by Pahre (1999); while this approach is only strictly accurate for bulge-like light distributions, the profiles are sampled and fitted at such large radii relative to the PSF that the corrections themselves are very small.
One-dimensional models of bulge plus exponential disk were fit to the isophotal surface brightness profiles and the circular aperture magnitude curves of growth. The results of the two methods were averaged, and half of the difference taken as the uncertainty. Results are tabulated in Pahre et al. (2004). The images and profiles were inspected to determine robust outer fitting radii; the value of times the 2MASS isophotal radius was found to offer a good compromise of sampling most of the galaxy light and providing for robust results independent of outer fitting radius while at the same time minimizing the effects of sky subtraction.
5 Spatially Resolved Dust Emission in Early-Type Galaxies
The three galaxies classified as E/S0 or S0 (NGC 1023, 4203, and 5363) show substantial residual, non-stellar emission in the µm band (Fig. 2c), while the three classified as E do not (Fig. 1c). The dust exhibits different morphologies in each galaxy.
In the case of S0- galaxy NGC 4203 (catalog ads/sa.spitzer#0004457216), the warm dust emission appears to be organized into several spiral arms emanating out from the nuclear region. Some evidence of nuclear dust obscuration has been found for NGC 4203 using optical colors on HST Erwin & Sparke (2003), but the optical images do not show the wealth of spiral arm structures at larger radii in the µm image.
In the E/S0 galaxy NGC 5363 (catalog ads/sa.spitzer#0004484352), the emission appears as a compact disk with arms and a possible bar-like structure projected against the disk. The galaxy shows additional, fainter, arm-like emission that extends farther out roughly along the major axis of galaxy. This galaxy has been known for some time to exhibit dust obscuration Gallagher (1986). Mid-IR images taken with ISO showed dust emission, slightly elongated along the galaxy’s minor axis (Xilouris et al. 2004), but their resolution and sensitivity were insufficient to see the detailed distribution of the dust shown in Figure 2c.
For S0- galaxy NGC 1023 (catalog ads/sa.spitzer#0004432640), the dust emission is faint and smoothly distributed in a direction that roughly corresponds to the major axis for the inner part of the galaxy.
Two of the three lenticular galaxies (NGC 4203 and NGC 5363), as well as E3-4 galaxy NGC 5077 (catalog ads/sa.spitzer#0004478976), show evidence for redder nuclear colors than their inner bulges, which is the mid-IR signature of the presence of an AGN. All three have been argued to have LINER nuclei, while NGC 5077 may instead harbor a Sy nucleus (Ho et al. 1997).
While dust emission in early-type galaxies has been known from previous IR space missions, Figure 2 provides the first evidence that its spatial distribution often resembles spiral arms—a hallmark of star formation in a quiescent disk. Some dwarf elliptical galaxies have recently been shown also to exhibit structures like these at optical wavelengths (Barazza et al. 2002; Graham et al. 2003).
Mis-classification is not likely to explain the three S0 galaxies containing warm dust. Galaxy bulge-to-disk ratio correlates well with morphological type van den Bergh (1976). The three galaxies NGC 1023, 4203, and 5363 have and , respectively, measured at µm Pahre et al. (2004). Not only are these all reasonable values of for the lenticular class Simien & de Vaucouleurs (1986), they are actually somewhat higher than the value of found for optical wavelengths, since the bulge light is generally redder than the disk. The µm surface brightness profile and its bulge plus disk fit are plotted in Figure 3 for the worst fit in the sample (NGC 4203). By comparison, the ratios for the elliptical galaxies NGC 777, 5077, and 5813 are and , respectively. This demonstrates that the first two are confidently fit by de Vaucouleurs-type light distributions, while the latter might be better classified as a lenticular.
Variations in stellar content cannot explain the observed µm emission. The color profile in Figure 3 shows that color is between and mag throughout the extent of the disk. This color is too red to be consistent with any stellar type or population, and there is no reason to believe that there are many magnitudes of visual extinction internal to any of these three galaxies. In fact, the color profile in matches the colors of late K or M giant throughout all the galaxies, as is shown in Figure 3 for NGC 4203, except in regions close to the active nuclei.
The inferred colors of the non-stellar emission match what is found in galaxies that show star formation. Figure 3 shows that the inner region of NGC 4203 at arcsec has a non-stellar emission color of mag, in good agreement with the value of mag found for M 81 Willner et al. (2004). A similar value of the non-stellar color is found for the dust emission region of NGC 1023, while NGC 5363 shows a larger color mag. There is approximately to mag systematic uncertainty in the µm aperture correction from pixel to , which would act in the direction to make more positive. The PAH emission models of Li & Draine (2001) predict that the IRAC color should be mag for a large range of five orders of magnitude in incident UV radiation. Thus, the color of the dust emission found in these early-type galaxies, star-forming M 81, and a theoretical model of aromatic features from dust grains, all have broadly consistent mid-IR SEDs. We caution against interpreting the dust colors in themselves as strong evidence for star formation in these early-type galaxies, however, because the model of Li & Draine shows that such flux ratios occur independent of the properties of the UV radiation field. On the other hand, the emission is inconsistent with the µm emission from AGB mass loss seen in some nearby elliptical galaxies (Athey et al. 2002)—which would enter at the long wavelength end of the 8.0 µm filter bandpass—because the same warm dust emission features are seen at 5.8 µm, albeit at lower S/N.
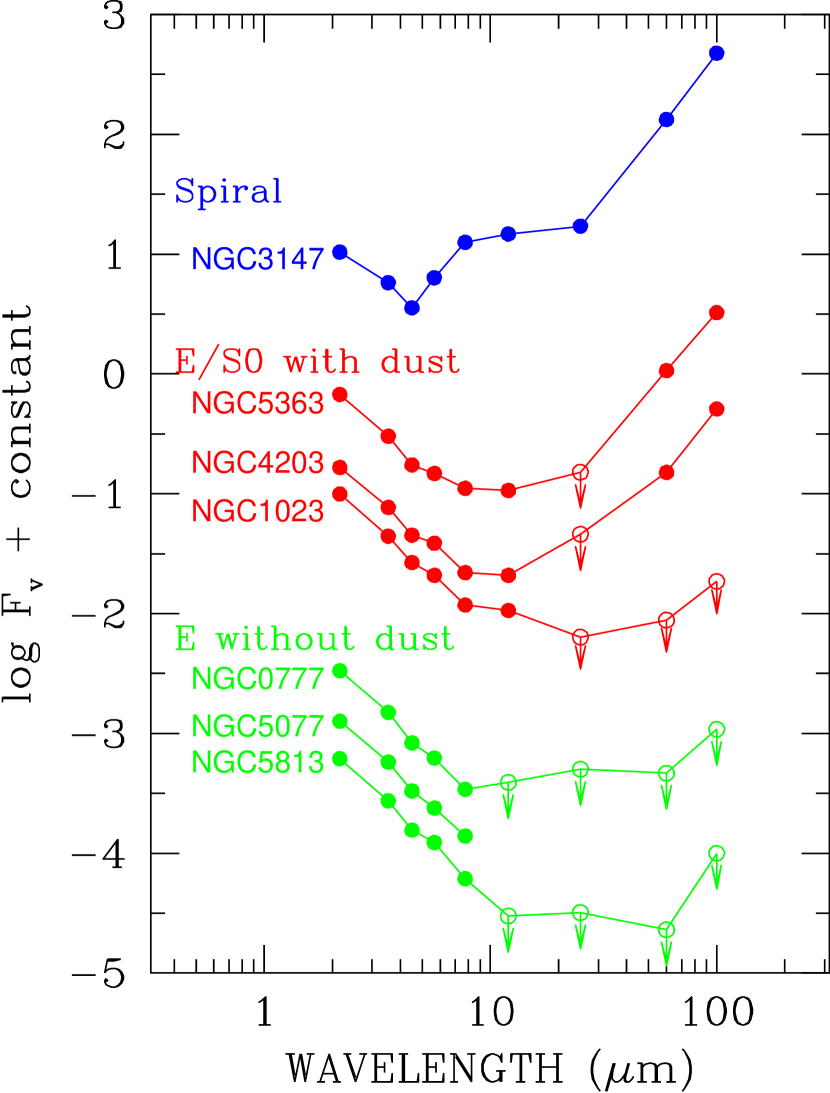
Galaxies with optical brightness similar to these have been studied with IRAS in order to detect (or place strong limits on) the presence of warm dust. A reasonable prediction would be that the three early-type galaxies with dust emission at µm should also exhibit far-IR emission from that dust, while those without µm dust emission would show only upper limits in the far-IR. The spectral energy distributions (SEDs) for the galaxies for µm are plotted in Figure 4. All but one of the six early-type galaxies follow the expectations. The exception is NGC 1023, whose stringent limits in the far-IR seem to contradict the presence of extended µm warm dust emission. This result for NGC 1023 cannot be explained by different detection limits (in Jy); in fact, a far-IR SED shape similar to NGC 4203 or 5363 can be ruled out for NGC 1023, as is apparent in Figure 4.
The nature of the infrared dust emission from early-type galaxies remains controversial. On the one hand, Devereux & Young (1990) and Devereux & Hameed (1997) argue that young stars are producing virtually all of the far-IR emission, and hence the far-IR emission is a direct tracer of the star formation rate. On the other hand, Kennicutt (1998) points out that many early-type galaxies show no independent evidence for the presence of star formation other than the far-IR emission, thereby suggesting that it may be an emission more similar to cool Galactic cirrus clouds. While the present data do not discriminate between these two origins for the infrared emission, a multi-wavelength approach combining observations of ionized gas, warm dust, and UV continuum emission could address it. We defer this to a future contribution.
6 Summary
Images at µm taken with the IRAC instrument on Spitzer Space Telescope demonstrate:
-
1.
Three of six early-type galaxies observed exhibit dust emission that is organized into spiral arm or inner disk-like structures,
-
2.
The bulge-to-disk ratios of the galaxies support their classification as early-types,
-
3.
The color of the dust emission matches that for dust in actively star-forming galaxies and theoretical models of PAH emission, and
-
4.
Two out of three galaxies that show µm dust emission also show far-IR emission.
References
- Athey et al. (2002) Athey, A., Bregman, Bregman, J., Temi, P., & Sauvage, M. 2002, ApJ, 571, 272
- van den Bergh (1976) van den Bergh, S. 1976, ApJ, 206, 883
- Barazza, Binggeli, & Jerjen (2002) Barazza, F. D., Binggeli, B., & Jerjen, H. 2002, A&A, 391, 823
- Bregman et al. (1998) Bregman, J. N., Snider, B. A., Grego, L., & Cox, C. V. 1998, ApJ, 499, 670
- Caldwell (1984) Caldwell, N. 1984, PASP, 96, 287
- Devereux & Young (1990) Devereux, N. A. & Young, J. S. 1990, ApJ, 350, L25
- Devereux & Hameed (1997) Devereux, N. A. & Hameed, S. 1997, AJ, 113, 599
- Erwin & Sparke (2003) Erwin, P. & Sparke, L. S. 2003, ApJS, 146, 299
- Fazio et al. (2004) Fazio, G. G., et al. 2004, ApJS, this issue
- Frogel et al. (1978) Frogel, J. A., Persson, S. E., Matthews, K., & Aaronson, M. 1978, ApJ, 220, 75
- Gallagher (1986) Gallagher, J. S. 1986, PASP, 98, 81
- van Gorkom & Schiminovich (1997) van Gorkom, J. & Schiminovich, D. 1997, ASP Conf. Ser. 116: The Nature of Elliptical Galaxies; 2nd Stromlo Symposium, 310
- Goudfrooij et al. (1994) Goudfrooij, P., Hansen, L., Jorgensen, H. E., & Norgaard-Nielsen, H. U. 1994, A&AS, 105, 341
- Graham, Jerjen, & Guzmán (2003) Graham, A. W., Jerjen, H., & Guzmán, R. 2003, AJ, 126, 1787
- Ho, Filippenko, & Sargent (1997) Ho, L. C., Filippenko, A. V., & Sargent, W. L. W. 1997, ApJS, 112, 315
- Jura et al. (1987) Jura, M., Kim, D. W., Knapp, G. R., & Guhathakurta, P. 1987, ApJ, 312, L11
- Kennicutt (1998) Kennicutt, R. C. 1998, ARA&A, 36, 189
- Kim, Fabbiano, & Trinchieri (1992) Kim, D.-W., Fabbiano, G., & Trinchieri, G. 1992, ApJ, 393, 134
- Knapp et al. (1989) Knapp, G. R., Guhathakurta, P., Kim, D., & Jura, M. A. 1989, ApJS, 70, 329
- Knapp, Turner, & Cunniffe (1985) Knapp, G. R., Turner, E. L., & Cunniffe, P. E. 1985, AJ, 90, 454
- Knapp (1994) Knapp, J. 1994, priv. comm. (corrected file of data from 1989, ApJS, 70, 329)
- Li & Draine (2001) Li, A. & Draine, B. T. 2001, ApJ, 554, 778
- Lu et al. (2003) Lu, N., et al. 2003, ApJ, 588, 199
- Mink (2002) Mink, D. J. 2002, ASP Conf. Ser. 281: Astronomical Data Analysis Software and Systems XI, 11, 169
- Moshir et al. (1990) Moshir, M. & et al. 1990, IRAS Faint Source Catalogue, version 2.0 (1990)
- Pahre (1999) Pahre, M. A. 1999, ApJS, 124, 127
- Pahre et al. (2004) Pahre, M. A., Ashby, M. L. N., Fazio, G. G., & Willner, S. P. 2004, ApJS, this issue
- Phillips et al. (1986) Phillips, M. M., Jenkins, C. R., Dopita, M. A., Sadler, E. M., & Binette, L. 1986, AJ, 91, 1062
- Pogge & Eskridge (1993) Pogge, R. W. & Eskridge, P. B. 1993, AJ, 106, 1405
- Simien & de Vaucouleurs (1986) Simien, F. & de Vaucouleurs, G. 1986, ApJ, 302, 564
- Soifer et al. (1989) Soifer, B. T., Boehmer, L., Neugebauer, G., & Sanders, D. B. 1989, AJ, 98, 766
- Werner et al. (2004) Werner, M. W., et al. 2004, ApJS, this issue
- Willner et al. (2004) Willner, S. P., et al. 2004, ApJS, this issue
- Xilouris et al. (2004) Xilouris, E. M., Madden, S. C., Galliano, F., Vigroux, L., & Sauvage, M. 2004, A&A, 416, 41