SPITZER Observations of the SCUBA/VLA Sources in the
Lockman Hole:
Star Formation History of Infrared-Luminous Galaxies
Abstract
We present Spitzer IRAC (3.6, 4.5, 5.8, 8.0 m) and MIPS (24m) observations of the SCUBA submillimeter sources and Jy VLA radio sources in a 5′5′ area in the Lockman Hole East region. Out of the 40 SCUBA/VLA sources in the field, Spitzer counterparts were detected for nearly all except for the few low-weight SCUBA detections. We show that the majority (80–90%) of the detected sources are cold (i.e., starburst-like) infrared-luminous galaxies ( L☉) at redshift , whose star-formation rate density (SFRD) is comparable to that of the optically-selected star-forming galaxies.
1 INTRODUCTION
A major scientific goal of the Spitzer Space Telescope is to probe the evolution of infrared-luminous galaxies ( L☉) at . Neither IRAS nor ISO provided enough sensitivity to detect a significant number of galaxies at , except for a small number of extreme objects. The much improved sensitivity and spatial resolution of Spitzer in the mid/far-infrared have improved the situation dramatically. With this goal in mind, we have imaged a 5′5′ area in the Lockman Hole East region with InfraRed Array Camera (IRAC; Fazio et al. 2004) and Multiband Imaging Photometer for Spitzer (MIPS; Rieke et al. 2004). The Lockman Hole was chosen because of the low infrared cirrus background as well as the wealth of ancillary data.
Up to now, infrared luminous galaxies have been probed mainly through submillimeter (e.g., Smail, Ivison, & Blain, 1997) or radio (e.g., Barger, Cowie, & Richards, 2000) observations. The former directly detects the emission by dust that is responsible for the infrared luminosity, while the latter detects the synchrotron emission (presumably from supernova remnants), which is known to correlate with the infrared luminosity (e.g., Helou, Soifer, & Rowan-Robinson, 1985). These two types of selection provide complementary views in that submillimeter selection is biased toward ultra-luminous (L☉) sources at high redshift (with a median redshift of 2.4 (Chapman et al., 2003)), while radio selection is biased toward less luminous sources at intermediate redshift ().
In this paper, we conduct the first analysis of SCUBA submillimeter and VLA radio sources based on the new Spitzer data. Companion papers also discuss stacking analysis of faint SCUBA sources (Serjeant et al., 2004), MAMBO millimeter sources (Ivison et al., 2004a), IRAC sources (Huang et al., 2004), X-ray sources (Alonso-Herrero et al., 2004), 24 m-selected sources (Le Floc’h et al., 2004), and extremely red objects (Wilson et al., 2004) in the same field.
Throughout the paper, H km s-1 Mpc-1, , and were assumed.
2 Data and Sample
2.1 Observations and Data Reduction
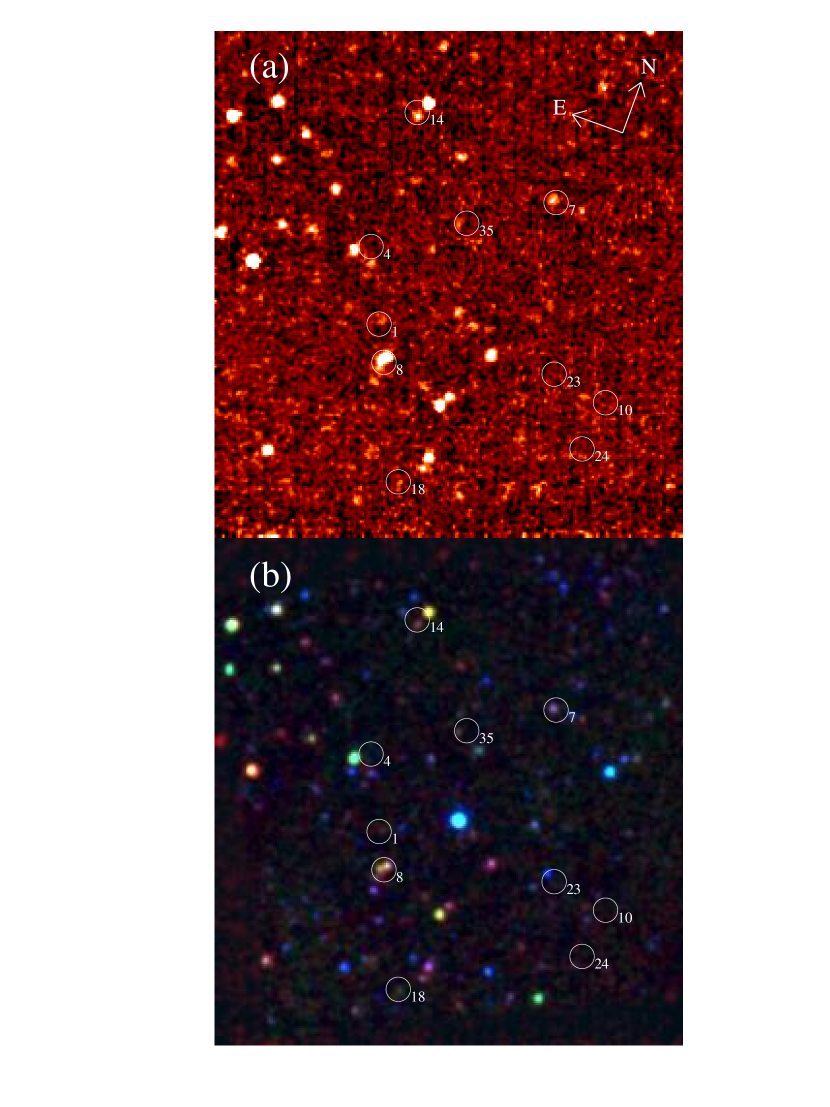
The details of the IRAC observations are presented by Huang et al. (2004), so only the MIPS observations are described here. The MIPS 24 m images of the Lockman Hole East region were taken on UT 2003 November 30 (Program ID: 1077; AOR ID: 6619904). The large-source photometry mode was used to minimize the dither step lengths and maximize the areal coverage overlap within the 54 54 MIPS 24 m field of view. The total integration time was 300 seconds per pixel. The 24 m imaging data were reduced and combined with the Data Analysis Tool (DAT) developed by the MIPS instrument team (Gordon et al., 2004). The final reduced 24 m image is shown in Figure 1a while the three-color image produced from the IRAC 3.6, 8, and MIPS 24 m is shown in Figure 1b. The 24 m sources were extracted from the image as described in Papovich et al. (2004). The detection limit in the 24 m image is 120 Jy (3 ). A preliminary IRAC/MIPS source catalog of this field will be released at http://mips.as.arizona.edu/cs/ero.
A variety of other imaging data were also assembled (Le Floc’h et al., 2004). This ancillary data set includes the F606W HST/WFPC2 images as well as the images obtained with a variety of ground-based telescopes. It also includes a deep (5 Jy/beam) high-resolution (14 FWHM) VLA map (Ivison et al., 2002) and a reprocessed SCUBA map (Mortier et al., 2004).
2.2 The SCUBA/VLA Sources in the Field
The field imaged by both IRAC and MIPS contains 10 SCUBA sources in the 850 m catalog of Scott et al. (2002), LE850.1/4/7/8/10/14/18/23/24/35111The source names are based on Ivison et al. (2002). The full names according to SIMBAD are of the form [SFD2002]LHE N. (Figure 1). The first seven sources are considered secure while the last three are regarded as marginal, the distinction being whether the signal-to-noise ratio is above or below 3.5. Among the seven secure sources, Ivison et al. (2002) detected radio counterparts for five (LE850.1/7/8/14/18) and possibly for one more (LE850.4) with a lower significance. Our re-examination of the VLA map shows that LE850.35 also has a VLA source within a radius of 8″, the region of 95 % positional confidence according to Ivison et al. (2002). We tentatively identify this VLA source as the counterpart for LE850.35 although we could not confirm the reality of this submillimeter source unambiguously even with the reprocessed SCUBA map. LE850.35 makes the total of radio-detected SCUBA sources seven out of ten. The field also contains a total of 38 VLA sources above 20 Jy (4 peak flux density) using the map of Ivison et al. (2002).
3 RESULTS and DISCUSSION
3.1 Identification of SCUBA Sources
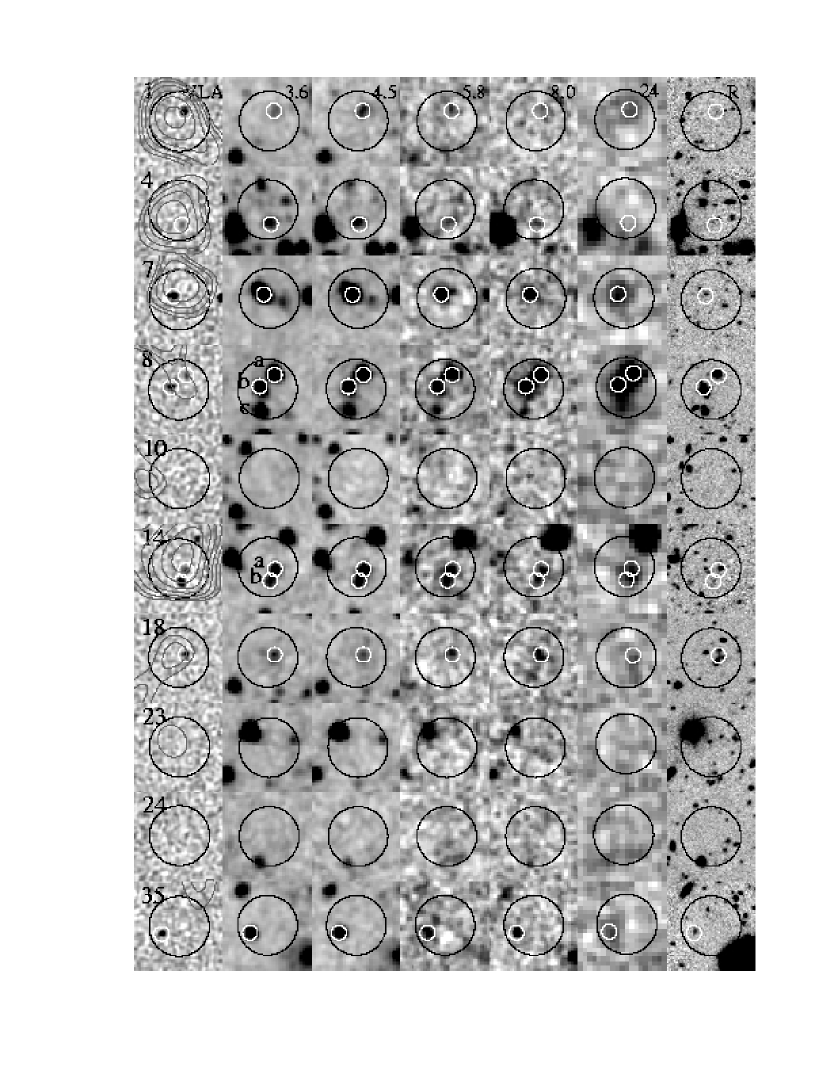
Figure 2 shows the Spitzer as well as VLA and archived Subaru/Suprime-Cam (Miyazaki et al., 2002) -band images of all ten SCUBA sources in the field. The seven sources with radio detections have all been detected by IRAC while six (excepting only LE850.4) have been detected by MIPS. The IRAC/MIPS flux densities of these sources are listed in Table 1 together with the previously published 850 m and 20cm flux densities. The following three sources have more than one IRAC source within a radius of 8″:
LE850.7 — The IRAC 3.6 and 4.5 m images show extended emission north-east from the radio position, which is seen to be a nearby source in the -band image. However, the longer-wavelength images do not show emission in the same direction, indicating that this neighboring source does not contribute significantly above 5 m.
LE850.8 — Three IRAC sources (8a/8b/8c) are seen within a radius of 8″. The 24 m signal is clearly extended in a way consistent with all three sources contributing. The strongest radio source corresponds to component 8b. There is also faint (3 ) radio emission at the position of component 8a, which is the brightest source at 24 m. Component 8a was thought to be the counterpart for the ROSAT X-ray source with a spectroscopic redshift of 0.974 (Lehmann et al., 2001), but the later XMM-Newton observation showed that the X-ray source is actually coincident with component 8b (Ivison et al., 2002). This leaves a possibility that some of the radio flux from component 8b may be of AGN origin. The -band image shows several sources at the position of component 8b.
LE850.14 — The two radio counterparts (14a/14b) have both been detected by IRAC. The 24 m emission is centered between the two IRAC sources. Considering the equally strong radio fluxes, both components are expected to contribute significantly in the submillimeter.
In summary, we have 7 secure SCUBA sources with a total of 9 radio components (LE850.1/4/7/8a/8b/14a/14b/18/35), all of which have Spitzer counterparts. Spitzer counterparts have been found only for the sources with radio detections. The three sources which are not detected by VLA and Spitzer (LE850.10/23/24) are all weak in the reprocessed 850 m map (Figure 2).
3.2 Spectral Energy Distribution and Redshifts
For the following statistical analysis, we restrict our discussion to the VLA 20 Jy sample, which contains 7 of the 9 SCUBA radio components (LE850.1/7/8b/14a/14b/18/35). There is one VLA source which is relatively bright in the radio (230 Jy) but undetected in most other bands including the IRAC 5.8 and 8.0 m (this is the only source which has not been detected in all four IRAC bands). We exclude this source; The VLA sample consists of 37 objects, of which all are detected in the four IRAC bands, and 29 are detected at 24 m.
The SEDs of the VLA sources can be classified into two types: those showing a clear near-infrared stellar continuum hump around 1.6 m (32 sources, 86%) and those showing a featureless power-law continuum (5 sources, 14%). Photometric redshifts can be derived for the former using the near-infrared hump (e.g., Sawicki, 2002; Le Floc’h et al., 2004); For the latter, the redshifts are mainly constrained by the submillimeter and radio points, but the estimates are significantly more uncertain.
Figure 3 shows the composite SEDs of these two types. The SED of the sources with a near-infrared continuum hump is similar to that of a “cold” ultra-luminous infrared galaxy (ULIRG) like Arp 220 while the SED of the power-law continuum sources resembles that of a “warm” ULIRG like Mrk 231. This cold/warm classification often used with ULIRGs roughly separates starburst-dominated galaxies (cold) and AGN-dominated ones (warm) by the appearance of the infrared SEDs. Among the 32 cold-type sources, there are 8 sources (22% of the 37 VLA sample) which were not detected at 24 m, but their restframe near-infrared SEDs are similar to those of the 24 m detected sources. Considering that these sources have expected 24 m fluxes (based on the Arp 220 SED) close to or below our detection limit, we include them in the cold category.
As Figure 3a shows, the cold-type sources show remarkably similar SEDs from the restframe visible to near-infrared that are well-fitted by the SED of Arp 220. Such uniformity is in contrast to the diversity of the SEDs seen with the X-ray and 24 m selected sources (Alonso-Herrero et al., 2004; Le Floc’h et al., 2004). Among the SCUBA sources, LE850.1/7/14a/14b/35 have this type of SEDs. (LE850.4 is also of this type, but it is not formally in the radio-selected sample.) With the SCUBA sources, the good fit to the Arp 220 SED extends to submillimeter and radio while most of the VLA-only sources have significantly lower radio fluxes, which reflects the fact that they are not as infrared-luminous as Arp 220. Figure 3a also shows that higher redshift sources (i.e., those with radio points at shorter wavelengths) have radio SED points closer to that of Arp 220.
The small SED dispersion with the cold-type sources demonstrates not only the similarity of the SEDs but also the accuracy of the photometric redshifts based on the near-infrared continuum hump. Table 1 shows that the redshifts derived this way for the SCUBA sources are consistent with those based on the submm/radio flux ratio (Aretxaga et al., 2003). LE850.14a and 14b show very similar SEDs, which indicates that their redshifts are both . In the case of LE850.14a, this was confirmed by the spectroscopic redshift of 2.38 (Ivison et al., 2004b). This suggests a possibility that these two sources are physically associated.
If we regard the warm sources as AGN galaxies, the AGN fraction of the 20 Jy radio sample is 14% (5 out of 37). Among the 9 radio components associated with the SCUBA sources, the AGN fraction is 30% (3 out of 9) as shown in Table 1. A comparison with the 150 ksec XMM data (Alonso-Herrero et al., 2004) shows that only 2 out of the 5 power-law continuum sources are detected, and that there are three cold sources detected in the X-ray.
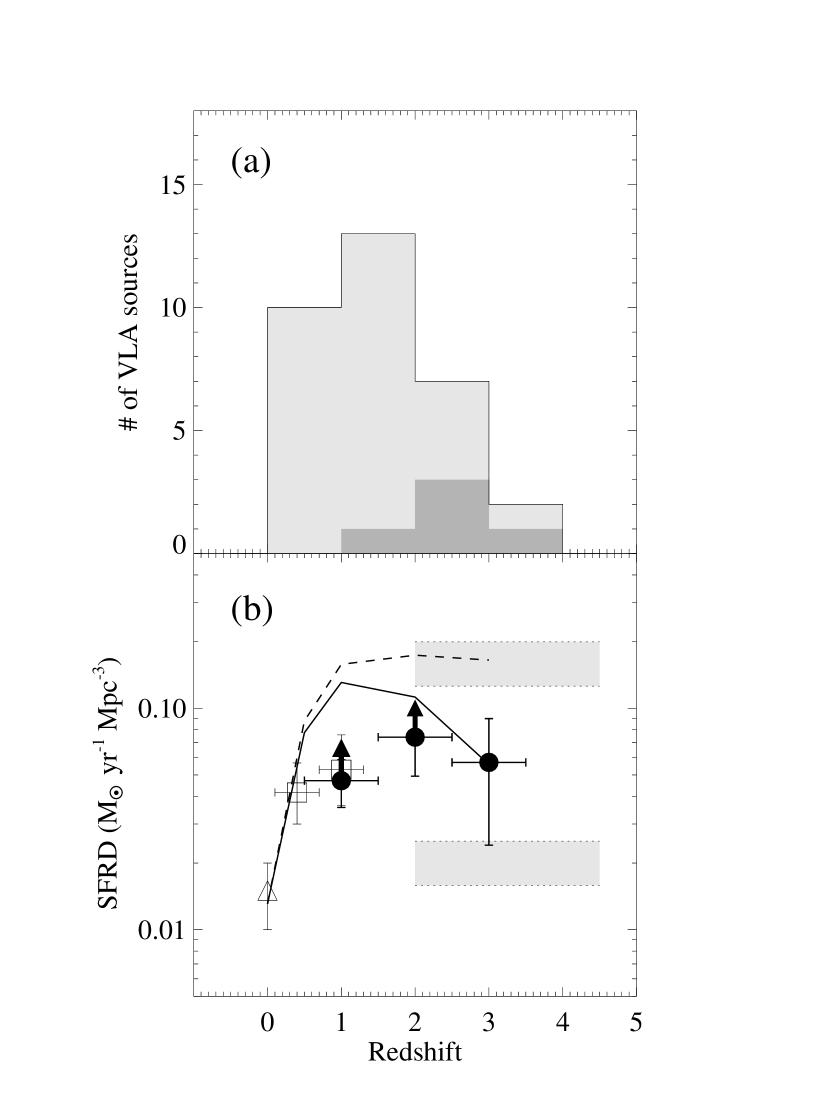
Figure 4a shows the redshift distribution of the 32 cold sources. Assuming that these are starburst-dominated, the figure can be regarded as the redshift distribution of infrared-luminous star-forming galaxies selected in the radio. The radio-infrared correlation suggests that the infrared luminosities range from to L☉, except for a few sources at , which are below L☉. The SCUBA sample constitutes only a small subset of the radio sample at high redshift. This is because (1) due to the relatively high detection limit ( L☉), the submillimeter observation misses lower luminosity sources which radio observation can detect at (e.g., Barger, Cowie, & Richards, 2000), and (2) because of the strong luminosity evolution of the infrared-luminous galaxies, large luminosity systems detectable above the submillimeter detection limit are more abundant at higher redshift (e.g., Smail, Ivison, & Blain, 1997).
3.3 Star Formation History
Using the derived redshift distribution and converting the 1.4 GHz radio luminosity into a star formation rate with the conversion factor of Yun, Reddy, & Condon (2001), we have calculated the star formation rate density (SFRD) as a function of redshift (Figure 4b). A K-correction was applied based on a spectrum. Our SFRD at is very close to the value derived by Barger, Cowie, & Richards (2000) with a sample of Jy VLA sources with spectroscopic redshifts.
The observed SFRD of the VLA sample shows a small peak at , but otherwise stays flat at above the observed SFRD of optically selected star-forming galaxies. When corrected for dust extinction, the latter exceeds the former by a factor of a few. However, the SFRD of the infrared-luminous sample includes only the most extreme high-luminosity objects at high redshift. A substantial completeness correction is still required, which has already been applied to the optical sample.
To estimate the size of the completeness correction, the observed SFRD was compared with a model prediction by Lagache et al. (2004). This model incorporates a variety of the latest observational constraints including the MIPS 24 m number counts (Papovich et al., 2004). However, the behavior of the model SFRD in Figure 4b is not unique to this model and is similar to what was derived previously (e.g., Franceschini et al., 2001). The observed points (solid circles) and the model-predicted SFRD adjusted for the 20 Jy radio detection limit (solid line) are seen to agree at , especially when we include the 24 m detected infrared-luminous galaxies which should have been in the radio sample (based on the 24 m IR radio luminosity conversion) but are not (e.g., sources larger than a few arcseconds would have been resolved away in the radio map). This suggests that if the completeness correction is applied, the total SFRD of this infrared-luminous galaxy population, which is considered to be distinct from the optically selected one (e.g., Franceschini et al., 2001), is flat at at a level comparable to the SFRD of the optically selected galaxies. At , however, the model overpredicts the observed SFRD by almost a factor of two. We will examine in the future papers whether this discrepancy is particular to this field (e.g., cosmic variance) or persistent even with a larger sample.
4 Summary
Except for the few low-weight SCUBA detections, nearly all the SCUBA and VLA Jy sources have been detected by Spitzer. The majority (86%) of the sources show remarkably similar SEDs well fitted by the SED of a cold ULIRG like Arp 220. This characteristic was exploited to derive the redshift distribution, which then enabled us to derive the star formation history of this galaxy population using the radio-infrared correlation. These submillimeter/radio selected galaxies are mostly star-forming (i.e., cold) infrared-luminous galaxies ( L☉) at , whose SFRD is probably comparable to that of the optically-selected star-forming galaxies.
References
- Alonso-Herrero et al. (2004) Alonso-Herrero, A., et al. 2004, this issue
- Aretxaga et al. (2003) Aretxaga, I., et al. 2003, MNRAS, 342, 759
- Barger, Cowie, & Richards (2000) Barger, A. J., Cowie, L. L., & Richards, E. A. 2000, AJ, 119, 2092
- Bouwens et al. (2004) Bouwens, R. J., et al. 2004, astro-ph/0403167
- Chapman et al. (2003) Chapman, S. C., Blain, A. W., Ivison, R. J., & Smail, I. R. 2003, Nature, 422, 695
- Chapman et al. (2004) Chapman, S. C. et al. 2004, in preparation
- Fazio et al. (2004) Fazio, G. G., et al. 2004, this issue
- Franceschini et al. (2001) Franceschini, A., Aussel, H., Cesarsky, C. J., Elbaz, D., & Fadda, D. 2001, A&A, 378, 1
- Gordon et al. (2004) Gordon, K. 2004, PASP, submitted
- Helou, Soifer, & Rowan-Robinson (1985) Helou, G., Soifer, B. T., & Rowan-Robinson, M. 1985, ApJ, 298, L7
- Huang et al. (2004) Huang, J.-S. et al. 2004, this issue
- Giavalisco et al. (2004) Giavalisco, M., et al. 2004, ApJ, 600, L103
- Ivison et al. (2002) Ivison, R. J., et al. 2002, MNRAS, 337, 1
- Ivison et al. (2004a) Ivison, R. J., et al. 2004a, this issue
- Ivison et al. (2004b) Ivison, R. J., et al. 2004b, in preparation
- Lagache et al. (2004) Lagache, G., et al. 2004, this issue
- Le Floc’h et al. (2004) Le Floc’h, E., et al. 2004, this issue
- Lehmann et al. (2001) Lehmann, I., et al. 2001, A&A, 371, 833
- Miyazaki et al. (2002) Miyazaki, S., et al. 2002, PASJ, 54, 833
- Mortier et al. (2004) Mortier, A., et al. 2004, in preparation
- Papovich et al. (2004) Papovich, C., et al. 2004, this issue
- Rieke et al. (2004) Rieke, G. H., et al. 2004, this issue
- Sawicki (2002) Sawicki, M. 2002, AJ, 124, 3050
- Scott et al. (2002) Scott, S. E., et al. 2002, MNRAS, 331, 817
- Serjeant et al. (2004) Serjeant, S., et al. 2004, this issue
- Silva et al. (1998) Silva, L., Granato, G. L., Bressan, A., & Danese, L. 1998, ApJ, 509, 103
- Smail, Ivison, & Blain (1997) Smail, I., Ivison, R. J., & Blain, A. W. 1997, ApJ, 490, L5
- Steidel et al. (1999) Steidel, C. C., Adelberger, K. L., Giavalisco, M., Dickinson, M., & Pettini, M. 1999, ApJ, 519, 1
- Wilson et al. (2004) Wilson, G., et al. 2004, this issue
- Yun, Reddy, & Condon (2001) Yun, M. S., Reddy, N. A., & Condon, J. J. 2001, ApJ, 554, 803

| Source | 3.6 m | 4.5 m | 5.8 m | 8.0 m | 24 m | 850 m | 20 cm | aaPhotometric redshifts (le2 type) from Aretxaga et al. (2003) | bbSpectroscopic redshifts for LE850.8a (Lehmann et al., 2001), LE850.14a (Ivison et al., 2004b), and LE850.18 (Chapman et al., 2004). | Type | |
|---|---|---|---|---|---|---|---|---|---|---|---|
| (LE850) | (Jy) | (Jy) | (Jy) | (Jy) | (Jy) | (mJy) | (Jy) | (submm/radio) | (this work) | ||
| 1 | 3.80.6 | 8.21.1 | 11.82.5 | 10.21.7 | 19333 | 10.51.6 | 7310 | 2.6 | 2.6 | cold | |
| 4 | 7.71.0 | 10.21.4 | 11.52.5 | 9.61.6 | 8.31.8 | 198 | 4.7 | 2.6 | cold | ||
| 7 | 65.96.9 | 77.08.1 | 60.17.8 | 52.45.9 | 31239 | 8.11.9 | 13513 | 3.6 | 1.8 | cold | |
| 8b | 17.12.0 | 22.32.6 | 37.25.3 | 89.59.6 | 28259 | 5.11.3 | 5812 | 3.7 | 3 | warm | |
| 8a | 72.07.5 | 72.67.6 | 79.09.7 | 112.011.9 | 534117 | 2211 | 0.974 | warm | |||
| 8c | 26.73.0 | 20.72.4 | 17.23.1 | 17.82.4 | 16147 | 0.9 | cold | ||||
| 14b | 9.81.3 | 14.71.8 | 22.23.7 | 18.52.5 | 166ccThe measured total flux densities of LE850.14 at 24 m (24939 Jy) and 850 m (9.52.8 mJy) were distributed based on the 20cm flux density ratio. | 6.3ccThe measured total flux densities of LE850.14 at 24 m (24939 Jy) and 850 m (9.52.8 mJy) were distributed based on the 20cm flux density ratio. | 7212 | 2.4 | 2.5 | cold | |
| 14a | 15.21.9 | 20.22.4 | 27.64.3 | 18.62.5 | 83ccThe measured total flux densities of LE850.14 at 24 m (24939 Jy) and 850 m (9.52.8 mJy) were distributed based on the 20cm flux density ratio. | 3.2ccThe measured total flux densities of LE850.14 at 24 m (24939 Jy) and 850 m (9.52.8 mJy) were distributed based on the 20cm flux density ratio. | 3612 | 2.38 | 2.5 | cold | |
| 18 | 6.10.9 | 5.80.9 | 19.93.4 | 26.43.3 | 12533 | 4.51.3 | 4710 | 3.0 | 2.69 | 3 | warm |
| 35 | 23.52.7 | 25.92.9 | 26.34.1 | 34.84.2 | 15531 | 6.72.3 | 5610 | 3.0 | cold |