The Nuclear Gas Dynamics and Star Formation of Markarian 231111The near infrared data presented herein were obtained at the W.M. Keck Observatory, which is operated as a scientific partnership among the California Institute of Technology, the University of California and the National Aeronautics and Space Administration. The Observatory was made possible by the generous financial support of the W.M. Keck Foundation.
Abstract
We report adaptive optics H- and K-band spectroscopy of the inner few arcseconds of the luminous merger/ULIRG/QSO Mkn 231, at spatial resolutions as small as 0.085″. For the first time we have been able to resolve the active star forming region close to the AGN using stellar absorption features, finding that its luminosity profile is well represented by an exponential function with a disk scale length 0.18–0.24″ (150–200 pc), and implying that the stars exist in a disk rather than a spheroid. The stars in this region are also young (10–100 Myr), and it therefore seems likely that they have formed in situ in the gas disk, which itself resulted from the merger. The value of the stellar velocity dispersion ( km s-1 rather than the usual few times 10 km s-1 in large scale disks) is a result of the large mass surface density of the disk. The stars in this region have a combined mass of at least M⊙, and account for 25–40% of the bolometric luminosity of the entire galaxy. At our spatial resolution the stellar light in the core is diluted by more than a factor of 10 even in the H-band by continuum emission from hot dust around the AGN. We have detected the 2.12µm 1-0 S(1) H2 and 1.64µm [Feii] lines out to radii exceeding 0.5″. The kinematics for the two lines are very similar to each other as well as to the stellar kinematics, and broadly consistent with the nearly face-on rotating disk reported in the literature and based on interferometric CO 1-0 and CO 2-1 measurements of the cold gas. However, they suggest a more complex situation in which the inner 0.2–0.3″ (200 pc) is warped out of its original disk plane. Such a scenario is supported by the projected shape of the nuclear stellar disk, the major axis of which is significantly offset from the nominal direction; and by the pronounced shift on very small scales in the direction of the radio jet axis which has been reported in the literature.
1 Introduction
The ultraluminous infrared galaxy Mkn 231 (UGC 8058, VII Zw 490) has the highest luminosity ( for a distance of 170 Mpc) of the original ULIRG sample of Sanders et al. (1988) from the Bright Galaxy Survey. That this galaxy hosts a powerful AGN is beyond doubt, as evidenced by the wealth of observations: for example, a compact nuclear radio continuum source with jets (Neff & Ulvestad, 1988; Ulvestad et al., 1999a, b; Taylor et al., 1999), broad absorption lines (Smith et al., 1995), and a compact source of variable hard X-ray emission (Gallagher et al., 2002; Braito et al., 2003). Because Mkn 231 has an absolute blue magnitude close to the cutoff of for QSOs (Schmidt & Green, 1983), it is often classified as one of these. However, it is also sometimes classed as a Seyfert 1, particularly because it has become clear that the AGN is responsible for only a part of the luminosity, and that a significant fraction (1/3 to 2/3) infact originates in star formation (Krabbe et al., 1997; Downes & Solomon, 1998; Tacconi et al., 2002). It is exactly this quality – the co-existence in the nucleus of both the star forming and AGN phenomena with massive luminosities – combined with its relative proximity that make Mkn 231 a key object for investigations of whether, as a class, ULIRGs do (e.g. Sanders et al., 1988; Veilleux et al., 2002) or do not (e.g. Tacconi et al., 2002) evolve into QSOs.
The asymmetrical optical morphology and large scale tidal tales (Hutchings & Neff, 1987; Sanders et al., 1987; Canalizo & Stockton, 2000) of Mkn 231 are typical of the remnants predicted by models of merger events between equal mass gas rich spiral galaxies (e.g. Barnes & Hernquist, 1992; Mihos, 1999). Such models indicate that Mkn 231 is most likely to be such a late stage merger. The structural and kinematic properties of a sample of similar late stage ULIRG mergers have been studied by Genzel et al. (2001) to investigate whether they might evolve later into (intermediate mass, ) ellipticals; and by Tacconi et al. (2002) to test whether, once rid of their gas and dust shells, they might be the progenitors of QSOs. The total sample consists of 18 ULIRGs, of which 8 contain QSO nuclei. Mkn 231 presents a puzzle since its stellar velocity dispersion of 120 km s-1 is the smallest of the sample (measured in 0.6″ slits). A remnant of a merger between massive gas rich spirals is expected to have a higher velocity dispersion, and indeed the ULIRG sample as a whole had a (logarithmic) average of 185 km s-1. On the other hand, Mkn 231 appears to be similar to the rest of the sample in having a relaxed stellar population, with and an luminosity profile. However, again the effective radius of the extended H and K band light in MKn 231 of 300 pc is the smallest of the sample, which had a (logarithmic) average of 2 kpc. Under the assumption that the stellar distribution is spheroidal, Tacconi et al. (2002) calculated the mass within the effective radius (300 pc) to be M⊙. From the relation between velocity dispersion and black hole mass, they also estimated M⊙, which would imply an Eddington efficiency of 6. The rather uncomfortable result of a super-Eddington black hole luminosity led them to consider whether the stars might actually lie in a nearly face-on regularly rotating inner disk, as exhibited by the cold molecular gas (Bryant & Scoville, 1996; Downes & Solomon, 1998), since this could also lead to a low value for . To address this question in detail and shed light on the nucleus of Mkn 231, we have undertaken near infrared spectroscopy using adaptive optics. The aim is to investigate its stellar luminosity profile, mass, and geometry, and to probe its nuclear dynamics at high angular resolution in the central arcsecond.
The paper is arranged as follows. After summarising the observations in § 2, we consider the shape and extent of the continuum emission in § 3. The radial profile, luminosity, and mass of the nuclear star forming region is discussed in detail in § 4. In § 5 we turn to the kinematics of the gas and stars, and construct a simple planar disk model which can reproduce their characteristics. Bringing these results together suggests that the starburst in the nucleus of Mkn 231 is very young, and so in § 6 we appraise other evidence from the literature that this is the case. Finally, we conclude in § 7.
2 Observations and Data Reduction
The data were obtained on the night of 28 May 2002 using NIRC-2, in a partially commissioned shared risk basis, behind the adaptive optics (AO) system (Wizinowich et al., 2000) on the Keck II telescope. NIRC-2 is designed to take full advantage of the adaptive optics system and has a Aladdin-3 InSb array, with a number of grisms and slits for the spectroscopic mode. It is unusual in that, in order to select the required wavelength range, the slit and science target are shifted in the AO system’s focal plane rather than tilting the grism.
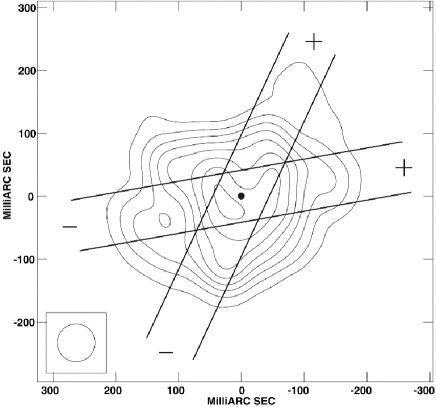
Spectra were obtained in the H- and K-bands with the camera in widefield mode (40 mas pixels) through a 80 mas slit with the medium resolution grism, resulting in nominal spectral resolutions of and 2090 respectively. The wavelength coverage is sufficient to include each band entirely in a single setting. Two position angles (PA) were used: (close to the kinematic major axis) and (reasonably close to the minor axis, but bisecting the extended 1-0 S(1) emission seen by Krabbe et al. 1997). The two positions of the slit are depicted in Fig. 1. Individual exposures of 600 sec in the H-band and 300 sec in the K-band were used, nodding the slit after each exposure. Total integration times were 40 mins and 80 mins. Standard calibrations were performed, including atmospheric standard stars (using the type G2 V star HD 117845 in the H-band, and the F2 star HD 110105 in the K-band), arcs, flatfields, and dark frames. The data were reduced using PC-IRAF 2.11.3 using standard techniques.
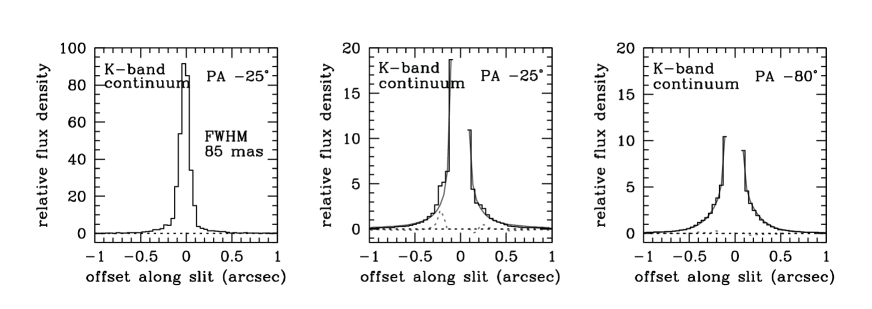
The spatial resolution depended on the adaptive optics performance, the reference for which was Mkn 231 itself. Because the seeing was reasonably good and stable, the wavefront sensor was able to run at a frame rate of 55 Hz with up to 60 counts per pixel. For the K-band this resulted in a spatial resolution limited only by the coarse pixel sampling. The FWHM measured on the nucleus of Mkn 231 was 85 mas (close to the 80 mas expected for Nyquist sampling). For the H-band, both the spatial and temporal scales of the atmospheric turbulence are smaller, and hence the AO performance is not so good. The resulting FWHMs measured on the galaxy nucleus were 0.192″ and 0.160″ for the two position angles ( and respectively). In Section 4 we show that the resolved stellar continuum contributes relatively little to this, and hence we can take it as a reasonable estimate of the spatial resolution.
The resulting FWHM spectral resolution measured from the arc lamp lines is 120 km s-1 at 2.2µm, and 164 km s-1 at 1.6µm. The K-band resolution is rather better than the nominal value because of the AO correction which resulted in a PSF which had an intrinsic FWHM rather less than 2 pixels across. Hence the spectral resolution is limited by the PSF rather than simply the slit width.
Flux calibration for the H-band data could not be performed using a standard star. Instead we use the H-band point source magnitude for Mkn 231 of H=10.09 from 2MASS. Extrapolating the continuum profile, assuming azimuthal symmetry, over a filled circular aperture with a diameter of 2″ (which contains effectively all the flux we have detected; see Fig. 2) indicates that the flux falling into the slit is a factor of 5.1 less than would be in such an aperture. Therefore we assign a magnitude of 11.86 to the flux detected in the central 2″ along the slit. Similarly, the magnitude for a 1″ circular aperture is H=10.19.
3 Imaging & Continuum Profile
A short sequence of images, totalling 20 sec, were taken in the K-band to assess the size of the nucleus of Mkn 231 during adaptive optics wavefront correction. This was measured to be 85 mas FWHM, including loss of resolution from undersampling and sub-pixel shifting to align the frames. A similar sequence of images taken on the standard star, while the AO system was running with the same control parameters (although with 200 counts rather than 60, even after dimming the star with a neutral density filter), led to the same measurement of the FWHM and an estimate of the Strehl ratio to be % in the K-band. Thus, although the final images are not diffraction limited, this is purely a result of the data acquisition procedure, and the nucleus of Mkn 231 is not resolved in the K-band on this spatial scale.
A second source about 0.19″ to the north has been reported by Lai et al. (1998) who claimed to have seen the same source in deconvolved J-, H-, and K-band images. In the K-band it had a relative intensity of a few percent. The adaptive optics PSF for the Keck telescope is very complex, and because of pupil rotation it was not possible to perform a satisfactory deconvolution of Mkn 231 for our data. The feature is not included in the spectroscopic data because the slit orientations were such that neither overlapped with the position where it should be. We are therefore unable to comment on this feature.
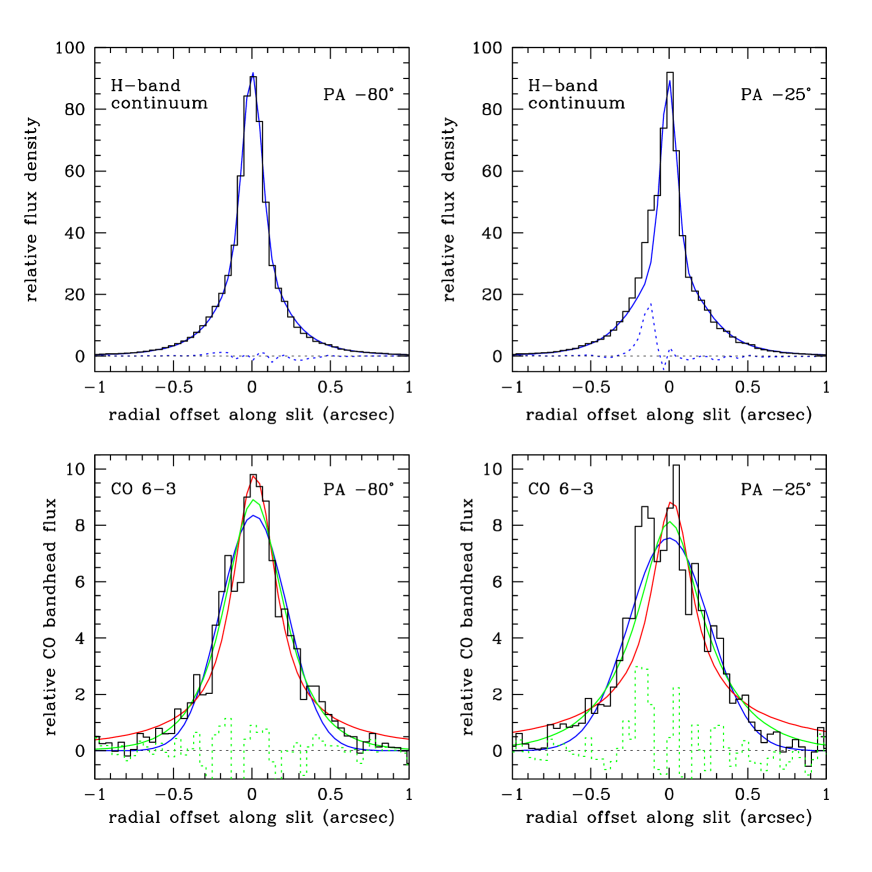
The H-band continuum profiles along the slit are shown in the top panels of Fig. 2. At both position angles these have been fitted with a combination of a Gaussian and a Moffat function. This provides an excellent match to the spatial profile because the Gaussian represents both the core of the adaptive optics PSF and the bright unresolved point source of the continuum related to hot dust around the AGN; while the Moffat represents jointly the halo of the PSF and the faint extended continuum component, which has wide shallow wings – at a radial offset of 1″, the continuum is 0.5% of its peak intensity. At PA , the fit is remarkably good and has an overall FWHM of 0.192″. The Moffat profile has a FWHM 0.41″ consistent with both the expected size of the halo for the ambient seeing and the effective radius of the de Vaucouleurs fit to imaging data (Tacconi et al., 2002). It is similar to the broad component at the other position angle and also those measured in the continuum of the K-band spectra. The Gaussian component, representing the core of the PSF, has a FWHM 0.14″. At a PA the Gaussian component has a slightly smaller width giving an overall FWHM of 0.160″, consistent with a better AO correction while these data were taken. However, there is a residual at an offset of ″ which has a peak intensity 18% of the nucleus. We return to this in the discussion about the CO absorption in the next section.
It is perhaps surprising that such a feature was not seen in the Pueo images of Lai et al. (1998). However, in the K-band where much of their spatial analysis was performed, the relative strength of this feature would certainly be much less. Assuming the AGN component of the continuum emission is hot dust at 1000 K (consistent with the slopes of the H- and K-band continua) and that the feature has a spectrum typical of late type stars, its strength in the K-band relative to the peak would be reduced to only 3–4%. In Fig. 3 we do in fact see a residual at on offset of about ″ in spatial profile of the K-band spectrum at PA with about this relative strength; but without the much clearer H-band data it would not be considered significant. Such a weak feature is not expected to be detected so close to the nucleus in K-band imaging data without prior knowledge or very careful deconvolution techniques.
4 Nuclear Star Formation
Under the assumption that the mean stellar type dominating the H-band stellar continuum is the same across the entire region where stellar absorption features can be seen, the absorption flux (in contrast to the equivalent width) of the absorption features traces the spatial extent of the stellar cluster. We have measured this using the 1.62µm CO 6-3 bandhead absorption (by comparing the absorption in the range 1.617–1.623µm with the continuum in the range 1.623–1.629µm). If there were no hot dust emission associated with the AGN, one would expect it to be similar to the continuum profile. However, Fig 2 shows that the profile is indeed substantially different to that of the continuum – primarily in not having a strong narrow peak in the core. This results in a sharp reduction in the equivalent width of the CO bandhead to Å at radii smaller than 0.1″; at radii in the range 0.1–0.5″ (beyond which the signal to noise becomes too weak to continue), Å is approximately constant.
4.1 Luminosity and Mass of the Nuclear Star Formation
In late type giant and supergiant template stars (Meyer et al., 1998), we find that typically Å, as shown in Table 1. Once such stars appear in a cluster, they will dominate the near infrared stellar light: in the H-band, a K2 I star is about 10 times brighter than a O9 I star. Hence, our value for implies that dilution due to hot dust is a factor of at least 13 in the core (on scales of 0.1″) and still a factor 5–6 around it (out to ″). Since a partially corrected adaptive optics PSF has strong extended emission on scales similar to the seeing, much of the dilution on these scales may be due to the halo of the PSF and hence attributable to the AGN rather than being associated with the underlying and surrounding stellar population. If this is the case, then in a 2″ length of the slit (which includes essentially all the near-infrared flux, and for which Å), only 1/8 of the H-band light originates in star formation. Extrapolating to a filled circular 2″ aperture, we estimate that approximately 20–25% of the H-band light is stellar. Although the total H-band magnitude in this aperture is 10.09, the stellar contribution is therefore 11.72 mag. A distance modulus of 36.15 gives an absolute magnitude for the stellar light of M.
We have applied no extinction correction to this value, because all estimates of the extinction suggest that it is low: optical and near infrared hydrogen recombination line ratios suggest it is in the range –6 mag (Boksenberg et al., 1977; Krabbe et al., 1997), consistent with conclusions that the inner disk of Mkn 231 is close to face-on and hence relatively unobscured (Downes & Solomon, 1998; Carilli et al., 1998). Instead we note that in the following discussion, applying any extinction correction would increase the H-band luminosity, with the result that both the mass and the bolometric luminosity of the star forming region would increase and hence the upper limit of the permissible age range would decrease.
Whether the stellar light is dominated by active star formation or an old population of stars can be determined from its mass to light ratio. Using population synthesis models for MV and V-H from Starburst99 (Leitherer et al., 1999), one can calculate the mass of stars for a given age for both instantaneous and continuous star forming scenarios (we assume solar metallicity and a Salpeter IMF). Given that the stellar ‘cluster’ (note: for convenience we use the word ‘cluster’ for the nuclear star forming region even though it is not known whether the stars are distributed continuously, or if they actually exist in many compact clusters) is extended over about 0.40″ (see below), equivalent to 330 pc, it seems unlikely that all the stars were formed in a single instantaneous burst. We therefore consider only continuous star forming scenarios. The minimum possible mass of the stellar cluster occurs when late type supergiants dominate the H-band continuum, at an age of about 10 Myr. Fig. 4 shows that to reach M at this age requires a star formation rate of M⊙ yr-1, yielding a total mass is M⊙ and a light/mass ratio of 830 / M⊙. The absolute upper limit to the age is set by the fact that the stellar mass cannot exceed the dynamical mass in the same region. As shown in Table 2, the stellar mass is unlikely to exceed M⊙. Hence, from Fig. 4, the stellar cluster must be less than 120 Myr old, over which timescale the average star formation rate would have to be M⊙ yr-1, and have a lower light/mass ratio 125 / M⊙.
Carilli et al. (1998) detected 1.4 GHz radio continuum from a mas disk with a flux density of 130 mJy (see Fig. 1). Further analysis of this and other 5–22 GHz radio continuum data at various resolutions were presented by Taylor et al. (1999). Following Condon (1992), these two sets of authors estimate the associated star formation rate for stars with masses M⊙ to be –115 M⊙ yr-1 (adjusted to our adopted distance for Mkn 231). Extending the initial mass function down to 1 M⊙ will increase the star formation rate by about a factor of two. Alternatively, one can use Starburst 99 models to derive the star formation rate from the supernova rate , which the radio continuum yields directly since the flux at 1.4 GHz is likely to be dominated by non-thermal emission (indeed the thermal continuum related to ionization by young stars would be only about 10% of that measured for the star formation rate above). Using the Galactic relation between the non-thermal radio luminosity and (Condon, 1992) yields yr-1 and hence a star formation rate of order 200 M⊙ yr-1. These estimates agree well with those above based on the near infrared CO absorption and H-band luminosity.
One important question for Mkn 231, which has repeatedly been addressed through the literature, concerns the respective fractions of the bolometric luminosity due to nuclear star formation and the AGN. Previously indirect estimates suggest that about 1/3 of the far infrared luminosity originates in nuclear star formation: Krabbe et al. (1997) used the 1-0 S(1) and an analogy to the circumnuclear ring in NGC 7469 for which the bolometric luminosity due to stars is known (Genzel et al., 1995); Tacconi et al. (2002) assumed that the stars are in a disk and used the stellar velocity dispersion and point source subtracted K-band image to derive a mass to light ratio and hence a bolometric luminosity. An alternative, albeit empirical, method is to use the far infrared radio correlation with the radio continuum measurement from Carilli et al. (1998). These authors used the correlation to determine whether star formation is a reasonable explanation for the radio continuum, and derived the ratio between the far infrared and radio fluxes to be . The median value is at 1.4 GHz (Helou et al., 1985), which would imply . This is about 70% of the observed far infrared (40–120µm) luminosity of Mkn 231, and about 25% of the 8–1000µm luminosity.
We are able to use a more direct method, based on the CO 6-3 absorption which arises in the stars themselves. The limits on the star formation rate and age we have discussed above constrain the bolometric luminosity of the cluster to be –12.11 (the lower luminosity corresponding to the greater age). The bolometric luminosity of Mkn 231 (taken as the luminosity in the range 8-1000µm) is (Lípari et al., 1994; Tacconi et al., 2002)). Hence the star formation within 300 pc of the AGN is responsible for 25–40% of the galaxy’s luminosity. The range would reduce considerably if the mass of the stars could be constrained more tightly. For this calculation we have assumed that the star formation is continuous. Once it ceases, the bolometric luminosity will fall very fast, and the cluster will fade by an order of magnitude over a timescale of up to a few 100 Myr. Repeating the same calculation for smaller apertures shows that within 0.5″ (165 pc, similar to the FWHM of the stellar cluster) of the AGN, stars are still responsible for 15–30% of ; while within a radius of 0.25″ the fraction drops to 10–15% because many of the stars are then excluded.
4.2 Spatial Distribution of the Nuclear Star Formation
We have fitted three analytical functions to the CO absorption profiles out to radii of 1.5″ in order to assess how the luminosity (and hence density) of the stellar cluster changes with radius. At PA , a small section around the residual peak seen in the continuum was omitted in order to avoid biassing the fit. The simplest profile is a Gaussian (blue curves in lower panels of Fig. 2). However, the best fits with FWHM 0.50″ and 0.60″, at PAs and respectively, underestimate both the core and the wings of the measured profiles and do not yield good matches. It shows definitively that the spatial profile of the stellar cluster has a sharper cusp and broad shallow wings. We therefore consider two further profiles which have a physical meaning when applied to stellar distributions.
The de Vaucouleurs profile provides an empirical match to the luminosity profile in elliptical galaxies and other spheroids. The functional form has been convolved (in 2 dimensions) with a Gaussian which represents our best estimate of the beam smearing (FWHM 0.192″ and 0.160″ as described in Section 3). These provide acceptable fits to the inner part of the profiles, but tend to overestimate the wings at radii beyond 0.5″ (red curves in Fig. 2). The derived effective radii are also surprisingly large, ″ and 4.32″ (1.4 and 3.5 kpc).
The final function is an exponential profile typical of galaxy disks, which has the form (note that the effective radius, inside of which half the total luminosity is emitted, is a factor 1.68 times the disk scale length ). This was also convolved with a Guassian representing the beam smearing, and provides acceptable fits (green lines in the same figure) over the whole CO profile at both position angles. The resulting disk scale lengths are 0.18″ and 0.24″ (150 and 200 pc), consistent with the size scales over which we have data.
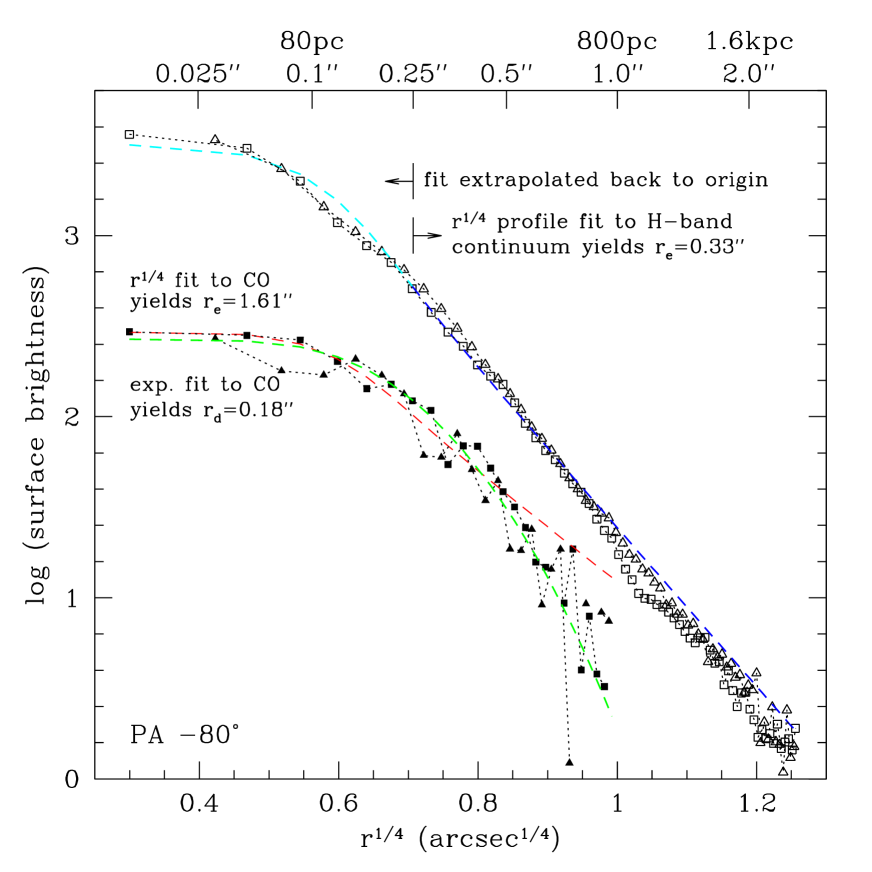
Which of these two profiles best represents the data has important implications on our understanding of the geometry of the nuclear star forming region: in essence, whether it is spheroidal or a disk. However, it is not immediately clear which is correct. Previous measurements of the radial profile of the H- and K-band continua (after subtracting a nuclear point source) yield very clear signatures of an law, but with small effective radius ″ and ″ (400 and 200 pc) respectively (Tacconi et al., 2002; Lai et al., 1998). In order to reconcile this result with our fits above, we consider also the H-band continuum profile from our spectroscopic data, which is shown in Fig. 5. To avoid contamination by the AGN component we have fit the profile at radii 0.25–2.5″, in which region it clearly follows the de Vaucouleurs function (dark blue line). The effective radius we derive is ″ (270 pc), consistent with the 0.5″ (400 pc) found by Tacconi et al. (2002). However, if we extrapolate this profile back in towards the nucleus (convolved with our estimate of the PSF as earlier), we find that it accounts for all of the continuum (cyan line) – although with some small differences to the observed profile. Yet since we know that most of the nuclear continuum is associated with the AGN rather than stars (e.g. from ), this indicates that an profile with this cannot extend all the way in to the nucleus.
The same figure also shows the profile of the CO absorption flux to radii of 1″ together with the fit (red line) and the exponential fit (green line) from above. It can be seen that the large ″ for the former is needed to match the broad shape of the profile. But such a large is inconsistent with that derived for the continuum (which at large radii ″ is certainly dominated by stellar light), since it would imply that increases rapidly and continuously with radius – and hence would require a strong gradient in the stellar population. Additionally, at radii greater than about 0.5″, the fit appears to begin diverging from the data, although this is close to the noise limit. Accordingly, we are led to exclude the fit to the CO data. On the other hand, the exponential fit matches the CO data well, and does not contradict the continuum profile.
Our conclusion here is therefore that at radii greater than 1″ the continuum traces the luminosity profile of the stellar population, which follows a profile. Fig. 5 hints that there may be a small break in the slope of the profile, and that at radii larger than 0.8″ (600-700 pc) is slightly larger than the value we found above. The result of this would be that at smaller radii, the profile no longer dominates the continuum. Instead, as shown by the CO data, the stellar light here is dominated by a bright nuclear population no more than 10–100 Myr old, which is present in a disk and hence has an exponential profile. At very small radii, the continuum traces the unresolved hot dust emission associated with the AGN. The fact that the continuum appears to follow a single law at all radii less than 2.5″ is an unfortunate coincidence, since it hides the true stellar luminosity profile at small radii. A similar configuration is seen in NGC 1068 (Thatte et al. 1997, Davies et al. in prep.), but in that case the break between the profile and the nuclear exponential star forming region occurs at a radius of 70 pc, and is much clearer.
4.3 An Extranuclear Star Cluster
At PA , a strong residual is apparent at an offset of ″ with a peak intensity of 32% of the central point. The position is similar to the residual seen in the continuum. However, this cannot be a peculiarity of the adaptive optics correction for two reasons: (1) the equivalent width of the CO is more than a factor 2 higher than that at the nucleus; (2) the residual is much narrower than the main profile; if a scaled replica of the main profile were to be added instead, the residual would be far less distinct and apparent only as an asymmetry. We conclude that this is indeed a real feature, and propose that it may be an unresolved circumnuclear star cluster residing 120–140 pc from the AGN. In fact, Fig. 1 shows that the 1.4 GHz radio continuum (Carilli et al., 1998) also has a subsidiary peak at about this position, providing additional evidence that it is a real feature.
We estimate that about 1% of the CO absorption in the nuclear star forming region originates in this feature. If the star formation here has the same history as discussed above, the mass would be of order M⊙. While this is a large mass for a single star cluster, it is only a factor of a few greater than the most massive clusters seen in the Antennae (Mengel et al., 2003) and Henize 2-10 (Vacca et al., 2002), and is entirely consistent with the larger cluster masses found in NGC 6745 (de Grijs et al., 2003), Arp 220 (Shaya et al., 1994), and NGC 7252 (Maraston et al., 2001).
5 Kinematics and Mass
Mkn 231 appears to be a later stage merger between gas rich spiral galaxies. In a study of 18 late stage ULIRG mergers, Genzel et al. (2001) and Tacconi et al. (2002) showed characteristics of relaxed stellar populations with luminosity profiles and stellar dynamics dominated by dispersion rather than rotation. Tacconi et al. showed that although Mkn 231 itself is unusual in having a lower than average velocity dispersion (only 115 km s-1), it still has a luminosity profile and a low value of . The spheroidal mass enclosed within the effective radius of 300 pc would then be M⊙. And correlations of with the black hole mass would yield M⊙, which leads to a super-Eddington AGN luminosity. This result led these authors to consider whether the stars are confined to the same disk that the molecular gas occupies. In Section 4 we have shown that the nuclear stellar population is very young and has an exponential profile. Both of these results tend to support the conclusion that the stars are in a disk. However, before we continue in this vein, we need to consider whether this is consistent with the stellar dynamics. The disk properties determined by Downes & Solomon (1998) are an inclination , a rotation velocity of at a radius of 0.6″ (500 pc), a dynamical mass of M⊙ within the same radius, and a scale height (FWHM) of 23 pc. The actual rotation velocity at 500 pc is then 345 km s-1. Using the usual equation for calculating the velocity dispersion perpendicular to the disk plane where is the mass surface density of the disk and is the exponential scale height (for which we approximate FWHM), we find a mean value of km s-1. Hence, , typical of rotationally supported systems. That is rather larger than one might expect for typical galactic disks, for which is a few times 10 to about 100 km s-1 (Bottema, 1993), is simply due to the large surface density of the disk, on average M⊙ pc-2. It seems therefore that it may be possible to reproduce a high dispersion and low rotation velocity from a disk. To test this more thoroughly we have made a model of an exponential disk having ″ and other characteristics consistent with those above. We have convolved it with seeing of 0.6″ and extracted line profiles from a 0.6″ slit oriented at . Integrating from ″ to ″ yields a line width of km s-1; and the range 0.3–0.7″ yields . Thus we find an apparent , consistent with the measurements of Tacconi et al. (2002) and showing that a nearly face-on stellar disk can masquerade as a spheroid if it is sufficiently dense and the details are blurred by seeing. The caveat is that in this case, the correlation between and , which is derived for dynamically hot systems, does not apply since most of the motion is in rotation.
5.1 Gas and Stellar Kinematics
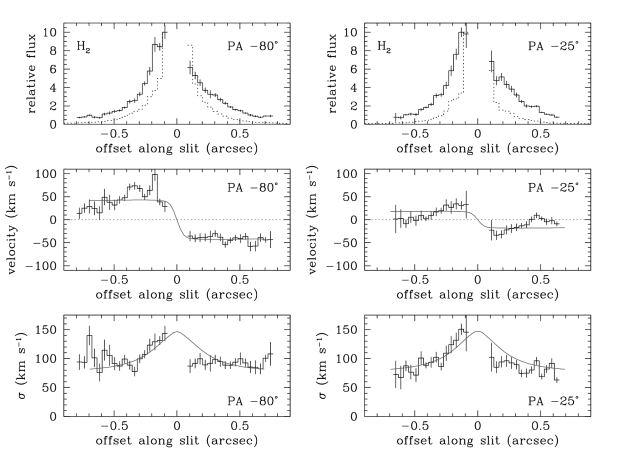
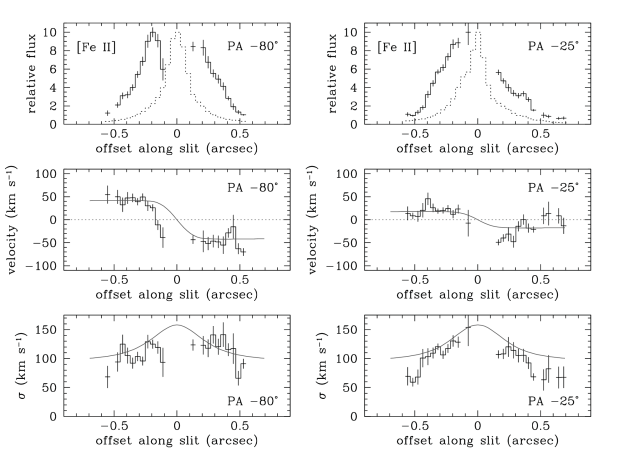
The gas dynamics were determined using the 2.12µm H2 1-0 S(1) and the 1.64µm [Feii] emission lines. The long exposures needed to detect the more extended (i.e. out to radii of 0.5″ or more) line emission resulted in the central few rows of the K-band spectrum being saturated; due to the sub-pixel shifting associated with straightening the spectral traces, it is not possible to use the central 6 rows. In the H-band, the errors in the line flux and velocity across the central few rows of the spectrum are too large for these data to be useful. We are therefore unable to measure the shape of the rotation curve closer than 0.12″ (100 pc) to the nucleus. We have also measured the stellar dynamics using the H-band absorption features. However, while these are consistent with the gas dynamics, the error bars are too large to draw any independent conclusions.
The H2 and [Feii] emission line velocity profiles are shown in Figs. 6 and 7 respectively (centre panels), together with the flux distribution (top) and the velocity dispersion (bottom). These parameters were all measured by fitting a Gaussian to the emission line profile in each row of the spectrum. The velocity zero points were calculated as the weighted mean velocity, giving a value close to 12680 km s-1 in each line and position angle. Uncertainties were calculated simultaneously for all 3 parameters by constructing an 11 pixel segment, which had the same statistical noise as the original spectrum (after subtracting the fitted Gaussian), and back to which the fitted Gaussian profile was added. A new Gaussian profile was then fitted to the segment, producing slightly different parameters. The procedure was repeated 1000 times, yielding the errorbars shown in the figure.
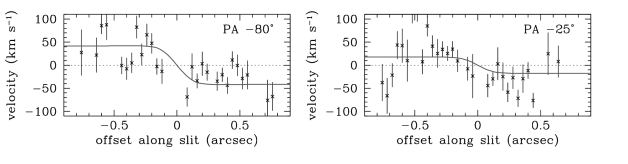
The stellar velocities were measured by cross-correlating spectra in the range 1.57–1.64µm (rest frame 1.506–1.574µm), extracted from each row of the dataset, with a K1.5 I template from Meyer et al. (1998); repeating the procedure with templates of different late stellar types gave the same results. A Gaussian was fitted to the cross-correlation peak. As for the emission lines, the errorbars were estimated by measuring the residual noise in the neighbouring 51 pixels, creating a segment with the same statistics to which the original Gaussian was added back, and refitting the result. While this method does not permit the velocity dispersion to be measured, it does avoid the necessity of decovolution which can be uncertain and adds significant noise. The velocities and their uncertainties are plotted in Fig. 8.
That the cold molecular gas lies in a thin rotating disk has been shown previously (Bryant & Scoville, 1996; Downes & Solomon, 1998; Carilli et al., 1998). Where we have been able to measure both the H2 and [Feii] emission lines, the velocities and dispersions are remarkably consistent and show a clear rotational signature which extends inwards to ″, as close to the nucleus as we can measure. Thus it appears that these lines also originate in the disk structure. The stellar velocities are consistent with the same rotation, which is to be expected if, as we have argued, the stars lie in the same disk as the gas – a scenario that would be feasible if the stars were recently formed in the gas disk.
As a consistency check on our measurements of the emission lines, we have calculated an ‘effective’ velocity dispersion from our data in a similar aperture to that used by Tacconi et al. (2002) who, for Mkn 231, summed data at radii 0.3–0.7″ either side of the nucleus. We have first calculated the mean velocity difference from one side of the nucleus to the other, and then combined this in quadrature with the mean velocity dispersion in the same region. At PA (close to the kinematic major axis, see Section 5.2) we find and are both approximately 120 km s-1, consistent with the stellar velocity dispersion reported by Tacconi et al.. At PA (where the rotational signature is weaker) we find km s-1 and km s-1, both less than the value given by these authors. Although these results suggest that both the H2 and the [Feii] lines trace the kinematic characteristics of a rotationally supported disk in the nucleus of Mkn 231, we consider also whether they might be affected by shocks or outflows.
The nuclear radio continuum of Mkn 231 has been resolved into a triple structure oriented north-south and extended over a distance of 0.05″ (40 pc) (Neff & Ulvestad, 1988; Ulvestad et al., 1999a). An additional component 0.1″ (90 pc) south of the core was reported by Taylor et al. (1999). Because the ends of these structure are elongated perpendicular to the direction to the core, they have been interpreted as the working surfaces of jets from the AGN. The core itself has also been resolved on parsec scales, showing two or three components aligned with a more east-west orientation (Ulvestad et al., 1999a, b). By analogy with NGC 1068, one might expect these radio jets to be associated with strong [Feii] emission excited at the interface between the jet and the interstellar medium (Blietz et al., 1994). This may be the case, but it cannot related to the [Feii] emission we have observed, which lies at much greater distances (more than 100 pc) from the AGN. It therefore seems unlikely that the extended [Feii] has an origin in outflows. On the other hand, it is co-spatial with the nuclear star forming region, and therefore may instead originate in supernova remnants. A star formation origin for the extremely high optical Feii luminosity of Mkn 231 has already been proposed by Lípari et al. (1994).
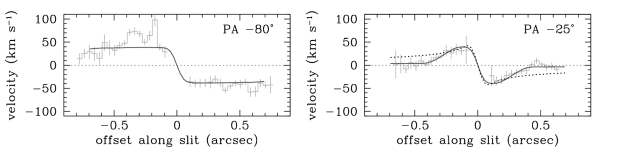
Our confidence in this conclusion is strengthened by the similarity of the kinematic signatures of the H2 and [Feii] lines which, again by analogy with NGC 1068, one would not necessarily expect to be the case if they were produced in outflows rather than stellar processes. There are in fact only two places where the emission line kinematics differ significantly. One of these is the difference in velocities for small negative offsets at PA . The excess in both line fluxes which is also seen at an offset of ″ along this position angle may be connected to this disparate kinematic behaviour. The second occurrence is the difference in dispersions at positive offsets along the same position angle. Here the errors in the dispersion for the [Feii] line are relatively large, and the difference from the H2 dispersions is therefore not highly significant. There is only one remaining unexpected aspect. At PA the velocities show a symmetrical decay at increasing radii from km s-1 to zero within 0.3–0.4″. This is reminiscent of Keplerian rotation about an unresolved mass. However, the decrease in velocity is steeper than , and we discuss it further in Section 5.3.
5.2 A Simple Dynamical Model
With only two slit positions, the inclination angle and kinematic major axis are unconstrained by our data. Instead, we fix them as input parameters to our model using estimates based on interferometric measurements from the literature of the millimetre CO emission line and radio continuum. For the kinematic major axis, we adopt the value from Downes & Solomon (1998), who used a 0.7″0.5″ synthesised beam to measure the properties of the CO 2-1 line (the highest resolution data available for CO emission). They found the kinematic line of nodes to be oriented at (i.e. east-west), similar to that determined by Bryant & Scoville (1996) in slightly lower resolution data. For the inclination angle, various estimates exist. Based on the morphology of the nuclear radio continuum, Carilli et al. (1998) estimated . However, we have argued in Section 4 that the elongation in their map is due to additional massive star clusters which are not intrinsically part of the nuclear disk. Excluding these makes the remaining emission much more symmetrical, suggesting a low inclination angle. Such a conclusion is supported by the K-band adaptive optics image in Lai et al. (1998) which has a circular appearance. Downes & Solomon (1998) reported for their CO 2-1 data that in order to reproduce the spectral profile and the symmetrical morphology, to avoid the gas mass exceeding the dynamical mass, and to be consistent with the lack CO absorption towards the nucleus, the inclination had to be less than 20∘ from face-on. Additionally, to avoid an excessively high rotation speed (i.e. rather higher than all other galaxies in their sample), the inclination could not be much more face-on than 10∘. Because of the dependence of mass on , this uncertainty equates to a factor of 4 in the dynamical mass. We therefore repeat our analysis using the two limiting values of 10∘ and 20∘.
To create a model of the mass distribution and kinematics, we have used a method outlined in Tacconi et al. (1994) that has also successfully been applied to NGC 7469 (Davies et al., 2004). We assume that the mass is distributed in a thin disk (see Bryant & Scoville 1996 and Downes & Solomon 1998 for H2, and Carilli et al. 1998 for Hi; Section 4.2 for the stars); that the galaxy is inclined by either 10∘ or 20∘ at a position angle of 90∘; and that the disk comprises 3 components: a nuclear stellar cluster with exponential luminosity and mass profile as derived in Section 4, a uniform gas disk as described by Downes & Solomon (1998) (note that these authors also describe a 3″ outer disk, but since we are only interested in radii ″, we do not include this explicitly), and a black hole. A typical rotation curve that results from optimising the masses is shown in Figs. 6 and 7. Given that the gas dynamics could be affected by non-gravitational motions, the model yields a reasonably good representation of the velocities and dispersions for both lines at both position angles.
For an inclination of our dynamical mass is only M⊙ within 0.6″. This inclination is clearly too high since it results in a mass which is barely the minimum we have estimated for the young stars alone based on their luminosity, and leaves no room for the gas mass. Including the gas mass of M⊙ of Downes & Solomon, would suggest a maximum inclination of from face-on. At , the inclination preferred by Downes & Solomon, we find the enclosed mass within a radius of 0.6″ is M⊙. That this is rather less than the mass determined by them is due to the different rotation velocities measured at this radius (but note that their beam size was ″). Our and their measurements differ by 20 km s-1, which, because Mkn 231 is close to face-on, corresponds to a factor of 1.5 in the rotation curve and hence a factor 2 in the derived dynamical mass. The measured velocity dispersions are reproduced by imposing a disk thickness of 15 pc (Gaussian FWHM), similar to that estimated by Downes & Solomon. The increase in velocity dispersion towards smaller radii is due to the rising mass surface density of the disk, which is on average 8000 M⊙ pc-2. If we repeat our earlier experiment of making the same measurements as Tacconi et al. (2002) (i.e. 0.6″ seeing, and extracting the velocity and dispersion over lengths of a 0.6″ slit), we find and km s-1. While the former is in good agreement with their rotation velocity, the dispersion is somewhat less, indicating there there remains some uncertainty about the disk thickness and perhaps also the mass. The black hole mass determined by the model for is M⊙, similar to the mass of stars and gas within a radius of 0.1″, indicating that this is approximately the ‘sphere of influence’ of the black hole (within which it dominates the dynamics). In our data this region is not well resolved, but if one could reach the 0.05″ diffraction limit of a large telescope by better sampling in the K-band or achieving better AO correction (e.g. with a laser guide star) in the H-band, one could impose a much stronger constraint on the black hole mass.
5.3 A warp in the inner disk of Mkn 231?
The velocity profile at PA shows a symmetrical decay at increasing radii from km s-1 to zero within 0.3–0.4″. This is reminiscent of Keplerian rotation about a compact mass. However, as the right panel in Fig. 9 indicates, the decay is in fact faster than r-2 and so cannot be explained by any mass distribution confined to a planar disk. Such a curve can in principle be produced by a warp in the inner disk of Mkn 231, which would have the effect of twisting the inner part of the disk to a different inclination and position angle. In Section 4.2 we have already encountered a hint that this may be the case: the effective radius we derive for the exponential profile is significantly larger at PA than at PA , opposite to that expected if the kinematic major axis lies at about 90∘. Although the angular scales are small, this can be easily seen in Fig. 2. It is not an effect of possible differences in the adaptive optics correction because the scale sizes and their difference are much larger than those of the PSFs (in fact, both results are independent of which PSF estimate we use). This suggests that, at least for the stellar disk and unless it is strongly asymmetrical, the major axis lies closer to than . While it may be difficult to warp a stellar disk once it has formed, we are proposing that the stars have formed very recently in the gas disk. As a result, it is certainly plausible that the warp occured in the gas disk before the stars formed.
Even combining the kinematic and spatial data, the geometry of a putative warp cannot be constrained. Here, therefore, we consider only an illustrative case, which demonstrates the feasibility of this hypothesis in explaining the observations. As the basic starting point, we have taken the same mass distribution as derived in the previous section, and set the inclination to be with the major axis at (slightly different to the previously adopted). We define the position angle of the warp in the disk plane as measured from an axis in that plane orthogonal to the major axis (i.e. if the disk major axis runs east-west then, if the disk is deprojected, the position angle of the warp is measured east of north). At a position angle of 30∘ and for radii ″, we tilt the disk out of its plane by 10∘. Beyond this, the tilt declines uniformly with increasing radius, until it reaches zero for radii ″. The observable effect this slight warping of a nearly face-on disk is in fact to shift the major axis of the inner part of the disk more towards without greatly altering the effective inclination. For this example, the inner part of the disk would have an effective inclination of but at a position angle of . Hence, as shown in the right hand panel of Fig. 9, at PA , the signature of rotation is seen at small radii but not at large radii. Comparison to Fig. 8 suggests that the stellar velocity curve might also match this model better, again a result which one might expect if the stars have formed recently in a disk which was already warped. Finally, our warp model is also able to reproduce approximately the velocity contours presented by Downes & Solomon (1998) with a 0.6″ beam.
We have provided an example of a weak warp which can explain the kinematics we have observed. However, measurements of both hydroxyl and the radio continuum provide evidence that there may be much stronger warping occuring in the nucleus of Mkn 231. The velocity field of the 1.6 GHz OH line emission, observed at a resolution of 30–40 mas over an extent of 100–150 mas by Klöckner et al. (2003), has been modelled in terms of a thick disk or torus inclined by 56∘ at a position angle of 35∘. This orientation, on scales of 100 pc, is rather different from that on scales of pc traced by the molecular gas, and is indicative of a warp completely consistent with – but more pronounced than – that described above. As we noted earlier, radio continuum data suggest that there is a very pronounced shift in the direction of the radio jet at radial scales between 1 and 20 pc (Ulvestad et al., 1999a, b). Unless the jets are viewed nearly end-on, this represents a substantial mislignment of the jet axis. Whether the misalignment is due to deflection of the jets as it strikes dense interstellar medium, or from a twisting of the axis of the central AGN, it could plausibly be related (whether causally or not) to the warping of the nuclear disk. Two such possibilities are that (1) the jet impinges on the disk and has caused it to warp, at the same time changing the direction of the jet; (2) the spin axis in the core has changed, perhaps during the later stages of the merger as clumps of gas thrown off in the early stages are accreted, and this is reflected in both the altered jet direction and the kinematics of the disk. The consequence of a warp is to make modelling of the small scale kinematics rather more complex. However, with the right data it may also make it easier to measure the dynamical effect of the black hole because for such a low inclination of the disk, small uncertainties in either the measured kinematics or the inclination itself propagate into very large uncertainties in the true rotation curve and hence enclosed mass estimate. A warp will almost inevitably lead to the inner region having a larger inclination, and hence reduce the sensitivity of the derived rotation curve to uncertainties in these parameters. With the current data we are unable to constrain the geometry of the warp and hence are unable to make detailed statements about the black hole mass. It is expected that with either integral field spectroscopy at adaptive optics scales, or higher resolution interferometric data at mm wavelengths will help to resolve the situation.
6 A Young Starburst in Mkn 231
In the previous Sections we have presented evidence that there is a massive (log ) young ( Myr) starburst occuring in the nucleus of Mkn 231. The stars involved in this burst are distributed in the same disk plane occupied by the gas, which is nearly face-on. This evidence suggests that the H and K band stellar light is not tracing stars from the progenitor galaxies which have relaxed into a spheroid during the merger, but instead is dominated by stars which have formed in situ in the gas disk – which itself has formed as a result of the merger – and still remain there.
It is important, therefore, to consider whether other observations are consistent with such a scenario. As we mentioned in Section 4.1, the radio continuum supports the existence of a young active starburst. Here we also look at the important characteristics observed with the Infrared Space Observatory, in particular the mid infrared emission lines reported in Genzel et al. (1998) and the polycyclic aromatic hydrocarbon (PAH) features in Rigopoulou et al. (1999).
Rigopoulou et al. (1999) presented measurements of the 7.7µm PAH feature for 62 ULIRGs, comparing them templates from 23 AGN and 15 starburst and normal galaxies. They showed that AGN and starbursts could be distinguished by the ratio of the PAH strength at 7.7µm to the continuum at 5.9µm (): AGN have , while starbursts have . Under this classification, Mkn 231 with , is clearly an AGN. However, this does not mean that there is no starburst. The spectrum in Fig. 2 of Rigopoulou et al. (1999) clearly shows a strong PAH feature – the low ratio arises simply because the continuum is also strong. Indeed, comparison with the other ‘starburst-like’ ULIRGs in this study shows that the absolute stength of the PAH feature is consistent with what one would expect from a massive starburst.
Genzel et al. (1998) did not detect 12.8µm [Neii], a line that arises in Hii regions and commonly seen in the mid infrared spectra of starburst and ULIRGs. Ne+ has an ionization potential of 21.6 eV, and so is a tracer of the hottest stars. The limit of W m-2 is a little lower than the flux that might be expected, but on the other hand, one cannot rule out that the true line flux lies within the range of typical values for massive young starbursts. A line that was detected is [Siii] at 34µm. The ionization potential for Si+ is only 8.2 eV and hence this line arises in Hii regions, at the interface between the ionized and molecular gas. The flux measured was W m-2, again similar to the other ULIRGs. All the ULIRGs in this sample had similar fluxes for the two lines; and the detection of [Siii] but non-detection of [Neii] at 1/3 the flux level is not an implausible result, particularly given the difficulty of detecting the lines as a result of the low line to continuum ratio. A re-analysis of the data by A. Verma (private communication) suggests that there is a possible detection of [Neii].
One final line of evidence about this is the near to far infrared spectral energy distribution (SED). This has been modelled in detail by Verma (1999), who found that a combination of nearly face-on torus model together with a zero age starburst was needed to match the 1-1000µm SED. Although the exact parameters are not uniquely constrained, this general conclusion was inescapable.
We conclude that the radio continuum, mid infrared diagnostics, and SED all support the view that there is vigorous young star formation occuring in the nucleus of Mkn 231. The superposition of this starburst and the AGN have made Mkn 231 look similar to a quasar, but at the same time means that it does not fit any of the standard correlations. Once the star formation ceases, and the starburst fades – on timescales of one to a few 100 Myr – the galaxy will probably look more like a typical Seyfert 1.
Evidence for the existence of young nuclear stellar disks in a number of spiral galaxies has been presented in the literature in terms of a drop in the stellar velocity dispersion on small spatial scales. Márquez et al. (2003) measured the 8600Å Caii triplet in 5 isolated Seyfert spiral galaxies and found a dip in the velocity dispersion across the central 1–3″ for 4 of them (and a hint of such in the fifth). The drop was accompained by a possible local increase in the equivalent width of the Caii triplet, indicating the presence of a younger stellar population. A similar effect has been previously reported for 3 barred galaxies by Emsellem et al. (2001) using the 2.29µm CO bandhead. This phenomenon has been modelled by Wozniak et al. (2003) using simulations which include stars, gas, and star formation. Their conclusion was that the drop in the line-of-sight stellar velocity dispersion is the kinematical signature of stars formed in a dynamically cold gas disk, which forms as gas is driven to the nucleus by the bar. Because these stars are young, they out-shine the old (dynamically hotter) population in the nucleus. And the effect is enhanced because the high gas density in the very centre leads to more efficient cooling, reducing further the velocity dispersion of the gas itself, and hence also the stars formed from this gas. Thus, although the frequency of such nuclear disks is unkown, it may be a relatively common phenomenon in galaxies where gas is driven to the nucleus – whether this be by a bar in a spiral galaxy as for the examples above, or due to a merger event as we have seen for Mkn 231.
7 Conclusions
We have presented adaptive optics spectroscopic data of the nearby ultraluminous infrared galaxy and QSO/Seyfert 1 Mkn 231 in the H- and K-bands at resolutions as small as 0.085″.
-
1.
We have resolved the region of active star formation in the nucleus of Mkn 231 through the 1.62µm CO absorption in late type stars. The region has a FWHM of 0.35–0.40″ (300 pc), and has a spatial profile significantly more cusped and with broader wings than a Gaussian. It is fit well by an exponential profile with disk scale length –0.24″. At larger radii the continuum luminosity profile is well represented by an law, as one might expect, since during a merger the stars relax into a spheroid; but that this also appears to continue inwards is an unfortunate coincidence. The nuclear star forming region would have a minimum mass of M⊙ if it is only Myr old (i.e. it has just reached the age when late type supergiants dominate the near infrared stellar continuum), implying a star formation rate of M⊙ yr-1. Constraints from the dynamical mass indicate that its age is unlikely to exceed 120 Myr. It is responsible for 25–40% of the galaxy’s entire bolometric luminosity, the higher fraction corresponding to the younger age limit. These results all point to the fact that the stars lie in a disky rather than spheroidal distribution, and that they are very young. Hence it is likely that they have formed recently in the nearly face-on molecular gas disk, which is itself a product of the merger that resulted in Mkn 231.
-
2.
There is an unresolved extranuclear star cluster ″ (120–140 pc) from the nucleus, with a mass of M⊙. This is more massive than ‘typical’ young star clusters in star forming galaxies, but is comparable with the most massive clusters seen in a few cases.
-
3.
The dynamics at radii 0.1–0.7″ have been traced using the 2.12µm 1-0 S(1) H2 and 1.64µm [Feii] emission lines, as well as the H-band stellar absorption features. The emission lines are extended over the same spatial scales as the stellar CO absorption, which is much greater than the scale of the radio jets, and are therefore likely to originate in stellar processes. Their kinematics are similar, and in general terms consistent with rotation of a nearly face-on disk. However, a simple dynamical model shows that there are distinct differences. The rotation curve at a position angle of shows a rapid decrease in velocity with radius, faster than . This can be explained if there is a warp in the inner 0.2–0.3″ (200 pc) of Mkn 231, a hypothesis which appears to be supported by the orientation of the major axis of the stellar disk, by the pronounced shift on small scales of the radio jet axis, and by the velocity field of the mas 1.6 GHz OH line emission. Integral field velocity maps at 0.1″ resolution will be needed to constrain the geometry and properties of such a warp.
References
- Barnes & Hernquist (1992) Barnes J., Hernquist L., 1992, ARA&A, 30, 705
- Blietz et al. (1994) Blietz M., Cameron M., Drapatz S., Genzel R., Krabbe A., van der Werf P., Sternberg A., Ward M., 1994, ApJ, 421, 92
- Boksenberg et al. (1977) Boksenberg A., Carswell R., Allen D., Fosbury R., Penston M., Sargent W., 1977, MNRAS, 178, 451
- Bottema (1993) Bottem A., 1993, A&A, 275, 16
- Braito et al. (2003) Braito V., et al., 2003, astroph/0307551
- Bryant & Scoville (1996) Bryant P., Scoville N., 1996, ApJ, 457, 678
- Canalizo & Stockton (2000) Canalizo G., Stockton A., 2000, AJ, 120, 1750
- Carilli et al. (1998) Carilli C., Wrobel J., Ulvestad J., 1998, AJ, 115, 928
- Condon (1992) Condon J., 1992, ARA&A, 30, 575
- Cox (2000) Cox A., 2000, editor, Allen’s Astrophysical Quantities, Springer (New York)
- Davies et al. (2004) Davies R., Tacconi L., Genzel R., 2004, ApJ, 602, 148
- de Grijs et al. (2003) de Grijs R., Anders P., Bastian N., Lynds R., Lamers H., O’Neil E., 2003, MNRAS, 343, 1285
- Downes & Solomon (1998) Downes D., Solomon P., 1998, ApJ, 507, 615
- Emsellem et al. (2001) Emsellem E., Greusard D., Combes F., Friedli D., Leon S., Pécontal E., Wozniak H., 2001, A&A, 368, 52
- Gallagher et al. (2002) Gallagher S., Brandt W., Chartas G., Garmire G., 2002, ApJ, 569, 655
- Genzel et al. (1995) Genzel R., Weitzel L., Tacconi-Garman L.E., Blietz M., Cameron M., Krabbe A., Lutz D., Sternberg A., 1995, ApJ, 444, 129
- Genzel et al. (1998) Genzel R., et al., 1998, ApJ, 498, 579
- Genzel et al. (2001) Genzel R., Tacconi L.J., Rigopoulou D., Lutz D., Tecza M., 2001 ApJ, 563, 527
- Helou et al. (1985) Helou G., Soifer B., Rowan-Robinson M., 1985, ApJ, 298, L7
- Hutchings & Neff (1987) Hutchings J., Neff S., 1987, AJ, 92, 14
- Klöckner et al. (2003) Klöckner H.-R., Baan W., Garrett M., 2003, Nature, 421, 821
- Krabbe et al. (1997) Krabbe A., Colina L., Thatte N., Kroker H., 1997, ApJ, 476, 98
- Lai et al. (1998) Lai O., Rouan D., Rigaut F., Arsenault R., Gendron E., 1998, A&A, 334, 783
- Leitherer et al. (1999) Leitherer C., et al., 1999, ApJS, 123, 3
- Lípari et al. (1994) Lípari S., Colina L., Macchetto F., 1994, ApJ, 427, 174
- Maraston et al. (2001) Maraston C., Kissler-Patig M., Brodie J., Barmby P., Huchra J., 2001, A&A, 370, 176
- Márquez et al. (2003) Márquez I., Masegosa J., Durret F., González Delgado R., Moles M., Maza J., Pérez E., Roth M., 2003, A&A, 459, 467
- Mengel et al. (2003) Mengel S., Lehnert M., Thatte N., Genzel R., 2003, A&A, 383, 137
- Meyer et al. (1998) Meyer M., Edwards S., Hinkle K., Strom S., 1998, ApJ, 508, 397
- Mihos (1999) Mihos C., 1999, Ap&SS, 266, 195
- Neff & Ulvestad (1988) Neff S., Ulvestad J., 1988, AJ, 96, 841
- Rigopoulou et al. (1999) Rigopoulou D., Spoon H., Genzel R., Lutz D., Moorwood A., Tran Q., 1999, AJ, 118, 2625
- Sanders et al. (1987) Sanders D., Young J., Scoville N., Soifer B., Danielson G., 1987, ApJ, 312, L5
- Sanders et al. (1988) Sanders D., Soifer B., Elias J., Madore B., Matthews K., Neugebauer G., Scoville N. 1988, ApJ, 325, 74
- Schmidt & Green (1983) Schmidt M., Green R., 1983, ApJ, 269, 352
- Shaya et al. (1994) Shaya E., Dowling D., Currie D., Faber S., Groth E., 1994, AJ, 107, 1675
- Smith et al. (1995) Smith P., Schmidt G., Allen R., Angel J., 1995, ApJ, 444, 146
- Tacconi et al. (1994) Tacconi L.J., Genzel R., Blietz M., Cameron M., Harris A., Madden S., 1994, ApJ, 426, L77
- Tacconi et al. (2002) Tacconi L.J., Genzel R., Lutz D., Rigopoulou D., Baker A.J., Iserlohe C., Tecza M., 2002, ApJ, 580, 73
- Taylor et al. (1999) Taylor G., Silver C., Ulvestad J., Carilli C., 1999, ApJ, 519, 185
- Thatte et al. (1997) Thatte N., Quirrenbach A., Genzel R., Maiolino R., Tecza M., 1997, ApJ, 490, 238
- Ulvestad et al. (1999a) Ulvestad J., Wrobel J., Carilli C., 1999a, ApJ, 516, 127
- Ulvestad et al. (1999b) Ulvestad J., Wrobel J., Roy A., Wilson A., Falcke H., Krichbaum T., 1999b, ApJ, 517, 81L
- Vacca et al. (2002) Vacca W., Johnson K., Conti P., 2002, AJ, 123, 772
- Veilleux et al. (2002) Veilleux S., Kim D.-C., Sanders D., 2002. ApJS, 143, 315
- Verma (1999) Verma A., 1999, PhD Thesis, Imperial College, London
- Wallace & Hinkle (1997) Wallace L., Hinkle K., 1997, ApJS, 111, 445
- Wizinowich et al. (2000) Wizinowich P., Acton S., Lai O., Gathright J., Lupton W., Stomski P., 2000 in Adaptive Optical Systems Technology, ed. Wizinowich P., Proc. SPIE, 4007, 2
- Wozniak et al. (2003) Wozniak H., Combes F., Emsellem E., Friedli D., 2003, A&A, 409, 469
| star | stellar | Mass | |||
|---|---|---|---|---|---|
| type | () | (Å) | |||
| HR 7479 | G4 I | 12 | 1.3 | ||
| HR 8465 | K1.5 I | 13 | 4.5 | ||
| HR 1155 | M2 I | 19 | 5.8 | ||
| HR 7328 | G9 III | 1.1 | 2.1 | ||
| HR 8317 | K1 III | 1.1 | 2.7 | ||
| HR 165 | K3 III | 1.2 | 3.3 | ||
| HR 4517 | M1 III | 1.2 | 4.2 |
| Description | Mass ( M⊙) | Comments |
|---|---|---|
| ″/500 pc | ||
| Young Stars | aa Stellar masses are 25% higher than given here if integrated out to ″ as used in Section 4.1. They are given here to ″ for consistency with other masses. | minimum mass possible for |
| Molecular Gas | from CO model of Downes & Solomon (1998) | |
| Dynamicalbb Derived in Section 5.2 from axisymmetric disk model of H2 and [Feii] rotation and velocity dispersion., | inconsistent with stellar and gas mass | |
| Dynamicalbb Derived in Section 5.2 from axisymmetric disk model of H2 and [Feii] rotation and velocity dispersion., | cc The dynamical mass derived by Downes & Solomon (1998) is a factor 2 higher due to their higher measured rotation velocity at 0.6″. | implies total (old+young) stellar mass M⊙aa Stellar masses are 25% higher than given here if integrated out to ″ as used in Section 4.1. They are given here to ″ for consistency with other masses. |