Mid-Infrared IRS Spectroscopy of NGC 7331: A First Look at the SINGS Legacy
Abstract
The nearby spiral galaxy NGC 7331 was spectrally mapped from 5–38 µm using all modules of Spitzer’s IRS spectrograph. A strong new dust emission feature, presumed due to PAHs, was discovered at 17.1 µm. The feature’s intensity is nearly half that of the ubiquitous 11.3 µm band. The 7–14 µm spectral maps revealed significant variation in the 7.7 and 11.3 µm PAH features between the stellar ring and nucleus. Weak [O iv] 25.9 µm line emission was found to be centrally concentrated in the nucleus, with an observed strength over 10% of the combined neon line flux, indicating an AGN or unusually active massive star photo-ionization. Two [S iii] lines fix the characteristic electron density in the H ii regions at cm-3. Three detected H2 rotational lines, tracing warm molecular gas, together with the observed IR continuum, are difficult to match with standard PDR models. Either additional PDR heating or shocks are required to simultaneously match lines and continuum.
Subject headings:
galaxies: individual (NGC 7331) – galaxies: ISM – dust, extinction – infrared: galaxies – techniques: spectroscopic – lines: identification1. Introduction
The mid-infrared (MIR) spectra of star-forming galaxies are characterized by fine structure and molecular hydrogen lines, and broad emission features usually attributed to the large molecular polycyclic aromatic hydrocarbon (PAH) species, set against a continuum transitioning from the direct photospheric emission of cool stars at short wavelengths to the rapidly rising contribution from very small grains and heated dust toward longer wavelengths. The Infrared Space Observatory (ISO) revolutionized the use of both line and band features in the MIR as diagnostics of star-formation and AGN activity in galaxies dominated by infrared emission, and found several key relationships between lines that trace excitation and the hardness of the ultraviolet radiation field (e.g. [Ne iii]/[Ne ii], Thornley et al., 2000), star-formation (e.g. 7.7 µm PAH, Genzel et al., 1998) and active nuclei (e.g. [Ne v] & [O iv], Sturm et al., 2002).
The Spitzer Space Telescope offers for the first time the sensitivity and spatial resolution necessary to apply the suite of infrared diagnostics to individual environments in galaxies which span a full range of interstellar medium (ISM) and IR emission properties. This is the focus of the Spitzer Infrared Nearby Galaxies Survey (SINGS — Kennicutt et al., 2003, hereafter K03), a Legacy program for which NGC 7331 is the first galaxy observed by Spitzer.
NGC 7331 has an IR luminosity typical of normal spiral galaxies with moderate star-formation activity, with an IR to optical ratio . By comparison, the extreme starburst M82 has , and ultra-luminous infrared galaxies range in IR activity up to 400 (Sanders & Mirabel, 1996). Kinematic and high-resolution studies in both the optical and radio have been unable to determine whether the galaxy harbors an AGN (e.g. Filho et al., 2002).
ISO imaging of NGC 7331 was obtained by Smith (1998), who found little variation in the coarse MIR spectral energy distribution traced in six broad bandpasses from 6–15 µm, three of which roughly match prominent PAH features. A surprising result from ISO was that the 2.5–11.6 µm spectral shape is relatively invariant among normal galaxies, with the appealing explanation that the PAH molecules whose features dominate this wavelength region are transiently heated by single photons, and thus produce an emission spectrum roughly independent of the heating environment (Helou et al., 2001). The spectral mapping capabilities of Spitzer make it possible to investigate variations in the PAH emission spectrum within individual galactic environments, and couple these variations using fine structure and molecular lines to the physical parameters of the ISM, H ii and photo-dissociation regions (PDRs).
2. Observations and Reduction
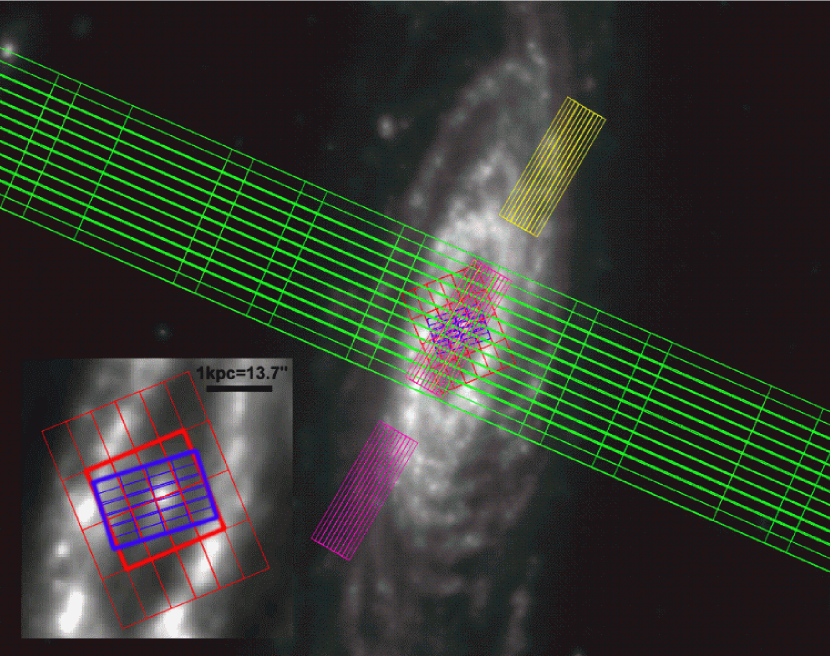
Spectra were obtained using all four modules of the Infrared Spectrograph (IRS, Houck et al., 2004) in Spectral Mapping Mode. In this mode, the spacecraft moves in a rectangular raster of discrete steps, settling at each position before the integrations begin. For all maps, half-slit step sizes were used. Since Spitzer cannot roll to alter the position angle of the slits, the mapping strategy was designed to provide the maximum useful overlap between modules. Figure 1 illustrates these areas overlaid on a SINGS 8 µm IRAC image (see Regan et al., 2004, in this volume), and indicates the high-resolution apertures used for computing line parameters.
Integration times ranged from 14–60s per pointing, with each position covered 2–4 times, matching the uniform SINGS observational strategy outlined in K03. The two IRS low-resolution modules, short-low (SL, 5–14 µm) and long-low (LL, 14–38 µm), provide R=50–100, while the two high-resolution modules, short-high (SH, 10–20 µm) and long-high (LH, 19–38 µm), deliver R600.
The individual low-res spectra from each map were assembled into spectral cubes by Cubism (see K03, §6.2), which was also used to produce maps and extract spectra. The pipeline and calibration products used were version S9.5.0. Low-resolution spectra were flux-calibrated using the standard IRS FLUXCON tables (see Spitzer Observer’s Manual111http://ssc.spitzer.caltech.edu/documents/som/, Chap. 7), which provide unbiased fluxes only for point sources. We derived extended source flux intensities by applying three corrections: 1) an empirically determined aperture loss correction function which accounts for the pipeline’s narrowing, point-source specific extraction aperture, 2) an estimate of the slit loss correction function which results from the point-spread function over-filling the IRS slits, and 3) an estimate of the integrated cross-slit beam profile. The LL background was subtracted in situ using the extended off-source map wings, and the SL background was fit and removed using two off-source spectra. High-resolution spectra were extracted directly from pre-flatfield data and flux calibrated using stellar standards via an empirically derived relative spectral response function. This resulted in an absolute calibration accuracy of 25%.
3. Results
3.1. The Spatially Varying PAH Spectrum and a Broad 17 µm Feature
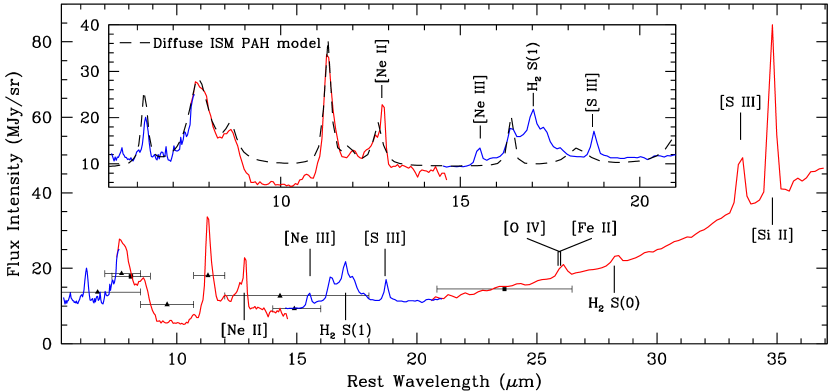
The entire 5–38 µm low-resolution spectrum extracted from a 58″17″ region, covering both the nucleus and a portion of the ring, is shown in Fig. 2. Most of the fine structure and H2 lines are detected in the low-resolution spectrum. The complete PAH spectrum from 5–20 µm is inset, with an untailored diffuse ISM PAH + graphite + silicate model of Li & Draine (2001) overlaid. The model matches the four main PAH bands, at 6.2, 7.7, 8.6, and 11.3 µm, reasonably well. The feature at 12.7 µm is contaminated by [Ne ii] 12.8 µm, but is also in good agreement with the model when the [Ne ii] line flux is considered. Broad 10 µm silicate absorption is likely present, as the continuum between 7.7 µm and 11.3 µm features lies below that inferred from bracketing band-free regions, most easily seen in the strong departure from the scaled model in this region.
Of particular interest is the bright, broad complex at 17 µm, blended with H2 S(1). The PAH model reproduces the narrow peak on the blue wing of the feature, but does not predict the large width observed, which is approximately equal to that of the 7.7 µm PAH band. Further peaks modeled at 18 and 21 µm are not evident in the spectra. Deuterated PAHs are expected to have C-D out-of-plane bending modes which emit in the 14–16 µm region, but the observed 17 µm feature falls longward of these and is much stronger. It may be due to PAH C-C-C bending modes (e.g. Allamandola & Hudgins, 2003).
Moutou et al. (2000) found a strong, narrow but resolved emission feature at 16.4 µm in ISO SWS spectra of the bright reflection nebula NGC 7023, the Orion bar, and on the surface of a Galactic molecular cloud. Their spectra showed no other features between 15.2 and 17.2 µm. IRS spectra of NGC 7023 reveal a series of blended peaks at 16.4, 17.4, and 17.8 µm which vary strongly across the nebula (see Werner et al., 2004, in this volume). NGC 7331 is the first extragalactic source in which this feature has been discovered.
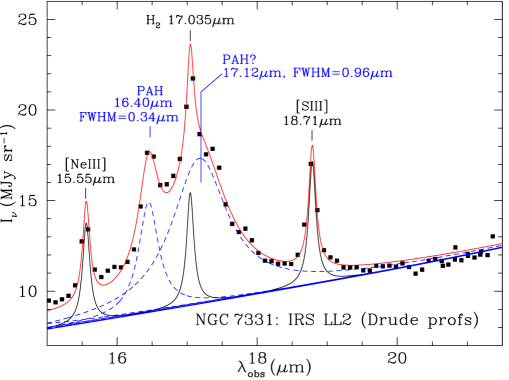
In Fig. 3, we fit the blended 17 µm feature as a combination of three unresolved lines matching SH identifications, and two PAH bands — one as previously reported at 16.4 µm, and a new, much stronger feature at 17.1 µm. Removing the line contaminants, the combined 16.4 + 17.1 µm feature strength is W m-2 sr-1, fully 49% of the 11.3 µm feature strength, making it a potentially important contributor to the total MIR luminosity, and a necessary consideration in the interpretation of photometric redshift and luminosity distributions based on 24 µm MIPS or longer imaging.
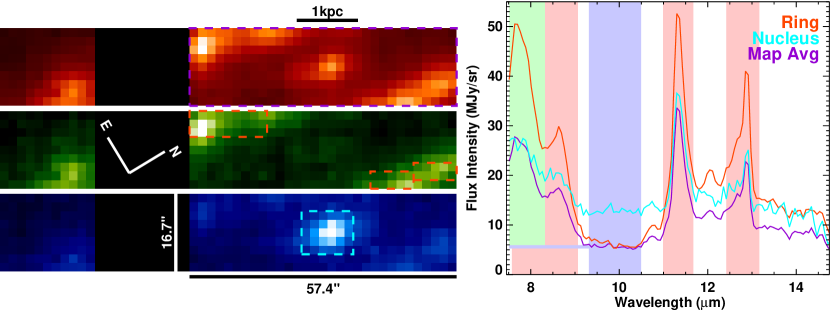
Using the MIR spectral cubes, we can test the spatial variability of PAH emission on kiloparsec scales. Figure 4 illustrates three maps created from the SL spectral cube. The topmost map (red) is a combination of the 7.7, 8.6, 11.3, and 12.7 µm PAH features (as indicated by shading on the spectra at right), and highlights the mapped portion of the ring and resolved nuclear core. In the continuum-subtracted 7.7 µm map (green, at middle), the nucleus, with its weak 7.7 µm PAH feature, nearly vanishes. In the pure continuum map at 10 µm (blue, at bottom), the strong inter-feature continuum of the nuclear emission is demonstrated. The three spectra extracted from ring, nucleus, and both components together, illustrate the spatial variability of the relative 7.7 µm and 11.3 µm PAH strengths. Although the apparent strength of the nuclear 7.7 µm PAH feature is diluted by excess continuum, the 7.7 µm/11.3 µm ratio increases by 40% from nucleus to ring. A similar band ratio increase, correlated with increasing star formation activity, has also been observed in M31 (Pagani et al., 1999).
3.2. H2 and Fine Structure Line Emission
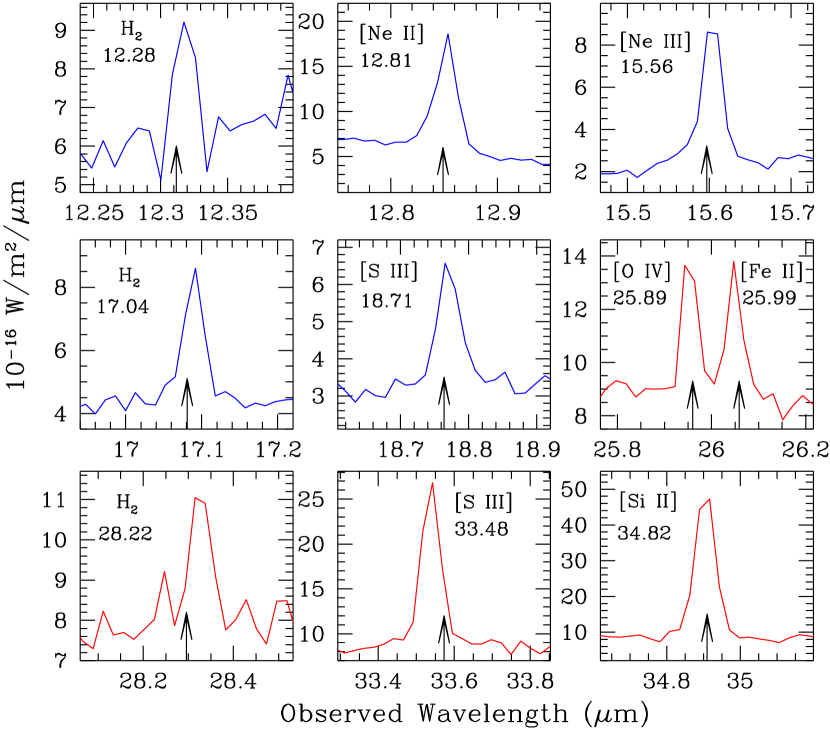
We detected seven fine structure and three molecular hydrogen lines, averaged over areas of size 22″22.4″ (LH) and 23.1″15.7″ (SH) (1–1.5 kpc on a side at the 15.1 Mpc distance of NGC 7331, see Fig. 1 inset). The fine structure lines detected arise from species ranging in ionization potential from 8.2 eV () to 55 eV (). The line parameters are given in Table 1, and individual line cut-outs are shown in Fig. 5.
| Line | Flux Intensity | I.P. or E/kccIonization potential of contributing ion, or excitation temperature of upper level state (H2). | ||||
|---|---|---|---|---|---|---|
| InneraaAverage intensity over 22″ region as indicated in Fig. 1 | OuterbbWeighted average intensity over the entire LH map, with 4 the weight in the regions excluding the nucleus (LH only). | |||||
| µm | W m-2 sr-1 | |||||
| Fine Structure | ||||||
| [Ne ii] | 12.81 | 237.2 | 8.3 | 21.6 eV | ||
| [Ne iii] | 15.56 | 164.7 | 7.5 | 41.1 eV | ||
| [S iii] | 18.68 | 100.7 | 15.1 | 23.4 eV | ||
| [O iv] | 25.89 | 39.6 | 5.5 | 16.2 | 4.4 | 54.9 eV |
| [Fe ii] | 25.99 | 36.7 | 11.0 | 29.2 | 1.8 | 7.9 eV |
| [S iii] | 33.48 | 189.5 | 19.7 | 251.3 | 19.7 | 23.4 eV |
| [Si ii] | 34.82 | 463.1 | 49.1 | 585.9 | 38.1 | 8.2 eV |
| Molecular Hydrogen | ||||||
| H2 S(2) | 12.28 | 43.8 | 14.7 | 1682 K | ||
| H2 S(1) | 17.04 | 108.0 | 7.5 | 1015 K | ||
| H2 S(0) | 28.22 | 34.2 | 5.9 | 43.3 | 6.2 | 510 K |
The 18.71 µm and 33.48 µm fine structure lines of [S iii] are detected. For K the [S iii] 18.71 µm/[S iii] 33.48 µm line ratio is insensitive to temperature and provides a density diagnostic. The density obtained with this diagnostic is . This density corresponds to a thermal pressure cm-3K in the H ii regions.
The pure rotational lines of molecular hydrogen, especially the S(1) and S(2) lines, which require 100 K for excitation, likely arise in PDRs surrounding or adjacent to these H ii regions, and can be used to provide joint constraints on the pressure or density and starlight intensity there. The observed H2 S(0)/S(1) and S(1)/S(2) line ratios and intensities can be reproduced by PDR models (Draine & Bertoldi, 2001, M.J. Kaufman et al. 2004, in prep.) with a large fraction of PDRs in the beam having a similar thermal pressure as the ionized gas, typically K and cm-3 at the surface, with incident FUV fluxes roughly times the local interstellar value. This is consistent with the strong 20–37 µm continuum observed in Fig. 2, which indicates a component of dust with temperature 30–60 K; such warm dust requires –.
The nucleus and inner edge of the circumnuclear ring in NGC 7331 therefore appear dominated by H ii regions and PDRs. However, our current PDR models tend to create too much warm dust for the observed 30 µm continuum. This may indicate either a lack of understanding of PDR heating processes (we note similar problems for H2 and CO rotational emission observed in dense, warm Galactic PDRs, see Hollenbach & Tielens, 1999), or a contribution of shock heating to the H2 emission.
Also of note is the weak but well-detected [O iv] line near 26 µm (see Fig. 5). Lutz et al. (1998) found that [O iv], with its high ionization potential of 55 eV, was nonetheless nearly universally present as weak emission in galaxies classified as starbursts from the relative strength of their 7.7 µm PAH features. The ionization potential is just above the Lyman limit of 54.4 eV, and as a result [O iv] is rarely formed in H ii regions. Any observed [O iv] therefore requires shocks, the wind-enhanced far-ultraviolet emission of Wolf–Rayet stars, or an AGN, to provide sufficient high energy photons (e.g. Schaerer & Stasińska, 1999).
When the [O iv]/([Ne iii]+0.44 [Ne ii]) ratio ( to emissivity-weighted neon emission) is compared to the excitation measure [Ne iii]/[Ne ii] (as in Lutz et al. (1998) Fig. 2), NGC 7331 is found to lie well above the locus of starburst galaxies, with [O iv] emitting more than 12% of the weighted neon line flux (vs. 1% typical for traditional starbursts). That [O iv] is centrally concentrated is evident from the relative line intensity in the inner to outer map. Both the relative strength and tight spatial distribution of [O iv] support the conclusion that a weak AGN provides the ionizing source, though a central concentration of high-mass stars cannot be ruled out. The AGN hypothesis is given further credence by noting that preliminary HST Paschen- imaging of the center of NGC 7331 indicates little or no atomic hydrogen line emission from the nucleus (D. Calzetti et al. 2004, in prep.).
4. Conclusions
All IRS modules were used to map the inner 5 kpc of the nearby spiral galaxy NGC 7331. A new band feature at 17.1 µm, associated with the 16.4 µm PAH feature observed in Galactic nebulae, was found at 49% of the 11.3 µm PAH strength, making it an important contributor to the total MIR flux. Among the 7 detected fine structure lines was [O iv], whose strength and central concentration indicate an AGN or an unusual concentration of massive stars as the ionizing source. Two [S iii] fine structure lines fix the typical pressure in H ii regions to be cm-3K, and the three H2 rotational lines require that the bulk of the non-ionizing stellar radiation be processed through PDRs with similar pressures. The traditional PAH features at 7.7 and 11.3 µm were found to vary in strength, with the nucleus maintaining strong 11.3 µm emission relative to 7.7 µm.
References
- Allamandola & Hudgins (2003) Allamandola, L. J., & Hudgins, D. M. 2003, in Solid State Astrochemistry, 251
- Draine & Bertoldi (2001) Draine, B. T., & Bertoldi, F. 2001, in Molecular H2 in Space, 131
- Filho et al. (2002) Filho, M. E., Barthel, P. D., & Ho, L. C. 2002, ApJS, 142, 223
- Genzel et al. (1998) Genzel, R., et al. 1998, ApJ, 498, 579
- Helou et al. (2001) Helou, G., Malhotra, S., Hollenbach, D. J., Dale, D. A., & Contursi, A. 2001, ApJ, 548, L73
- Hollenbach & Tielens (1999) Hollenbach, D., & Tielens, A. 1999, Rev. Mod. Phys., 71, 173
- Houck et al. (2004) Houck, J. R., et al. 2004, ApJS
- Kennicutt et al. (2003) Kennicutt, R. C., et al. 2003, PASP, 115, 928
- Li & Draine (2001) Li, A., & Draine, B. T. 2001, ApJ, 554, 778
- Lutz et al. (1998) Lutz, D., Kunze, D., Spoon, H. W. W., & Thornley, M. D. 1998, A&A, 333, L75
- Moutou et al. (2000) Moutou, C., Verstraete, L., Léger, A., Sellgren, K., & Schmidt, W. 2000, A&A, 354, L17
- Pagani et al. (1999) Pagani, L., et al. 1999, A&A, 351, 447
- Regan et al. (2004) Regan, M. W., et al. 2004, ApJS, 154
- Sanders & Mirabel (1996) Sanders, D. B., & Mirabel, I. F. 1996, ARA&A, 34, 749
- Schaerer & Stasińska (1999) Schaerer, D., & Stasińska, G. 1999, A&A, 345, L17
- Smith (1998) Smith, B. J. 1998, ApJ, 500, 181
- Sturm et al. (2002) Sturm, E., et al. 2002, A&A, 393, 821
- Thornley et al. (2000) Thornley, M. D., et al. 2000, ApJ, 539, 641
- Werner et al. (2004) Werner, M. W., et al. 2004, ApJS, 154