Spitzer Infrared Spectrograph111The IRS was a collaborative venture between Cornell University and Ball Aerospace Corporation funded by NASA through the Jet Propulsion Laboratory and the Ames Research Center Observations of M, L, and T Dwarfs
Abstract
We present the first mid-infrared spectra of brown dwarfs, together with observations of a low-mass star. Our targets are the M3.5 dwarf GJ 1001A, the L8 dwarf DENIS-P J02554700, and the T1/T6 binary system Indi Ba/Bb. As expected, the mid-infrared spectral morphology of these objects changes rapidly with spectral class due to the changes in atmospheric chemistry resulting from their differing effective temperatures and atmospheric structures. By taking advantage of the unprecedented sensitivity of the Infrared Spectrograph on the Spitzer Space Telescope we have detected the 7.8 µm methane and 10 µm ammonia bands for the first time in brown dwarf spectra.
Subject headings:
stars: low mass, brown dwarfs – infrared: stars1. Introduction
Within the past few years the number of known brown dwarfs has increased dramatically, with both the Sloan Digital Sky Survey (SDSS; York et al., 2000) and Two Micron All-Sky Survey (2MASS; Skrutskie et al., 1997) accounting for the bulk of the discoveries. These objects have been identified based on broad-band photometry with follow-up optical and near-infrared spectroscopy. The integrated data from these investigations has yielded important information about the variation of the chemical composition and of the effects of condensates in brown dwarfs in term of their spectral types (e. g. Kirkpatrick et al., 2000; Leggett et al., 2001; Burgasser et al., 2002; McLean et al., 2003; Knapp et al., 2004).
Spectroscopic observations in the mid-infrared yield important additional information (Saumon, Marley, & Lodders, 2003), but due to the very low infrared brightness of these objects and the effects of the Earth’s atmospheric absorption these measurements have been difficult or impossible from ground-based observatories. With the launch of the Spitzer Space Telescope (Werner et al., 2004) and the onboard Infrared Spectrograph (IRS; Houck et al., 2004) on 2003 August 25, we now have an observatory with sufficient sensitivity to undertake these studies. Accordingly, the Science Team of the IRS has organized a comprehensive observational program of M, L, and T dwarfs, covering the range from the earliest M dwarfs to the latest T dwarfs. We present here the first results from this program: observations of the M3.5 star GJ 1001A (LHS 102A), the L8 dwarf DENIS-P J02554700 (hereafter J02554700), and the T1/T6 binary system Indi Ba/Bb.
2. Observations and Flight Data Reduction
The three objects described here were observed with the IRS instrument on the Spitzer Space Telescope as part of one of the major IRS Science Team Guaranteed Time Observing programs. The IRS is capable of low-and moderate-resolution spectroscopy, with only data from the low-resolution modules being reported here. Each of the IRS low-resolution modules is fed by two long slits, one used for first order and the second used for second order. The IRS low-resolution modules have slit lengths of 546 and 1513 for both orders in the short-low (SL) and long-low (LL) modules, respectively. The spectral resolution of the SL module as determined by the slit width is = 0.06 µm for second order and = 0.12 µm for first order. The spectral resolution of the LL module as determined by the slit width is = 0.17 µm for second order and = 0.32 µm for first order. The slit widths of both of the IRS low-resolution modules are Nyquist sampled by the pixel pitch of their infrared arrays. Houck et al. (2004) describe the design, performance, and operation of the IRS in more detail.
Table 1 provides a summary of the observations reported here. As all of these objects have relatively large proper motions, the IRS blue peakup array was used to locate the current positions of these objects and to reposition them into the IRS slits with an estimated radial uncertainty of approximately 04, (1). Each object was observed at two locations in each of the IRS low-resolution slits, with the positions located at approximately the 1/3 and 2/3 positions along the long axis of the slits.
The standard IRS data reduction pipeline version S9.1 at the Spitzer Science Center processed the data. Stellar standards were also observed to calibrate the spectra and remove any spectral artifacts which may have survived the processing; the results reported here were corrected with the A dwarf standard star UMi. The zodiacal and galactic backgrounds were subtracted before the spectral extractions using observations when the target was located in the alternate slit. Finally, the spectra were extracted from the sky-subtracted two-dimensional array images using an early version of the SMART IRS data-reduction software package being developed at Cornell University (Higdon et al., 2004).
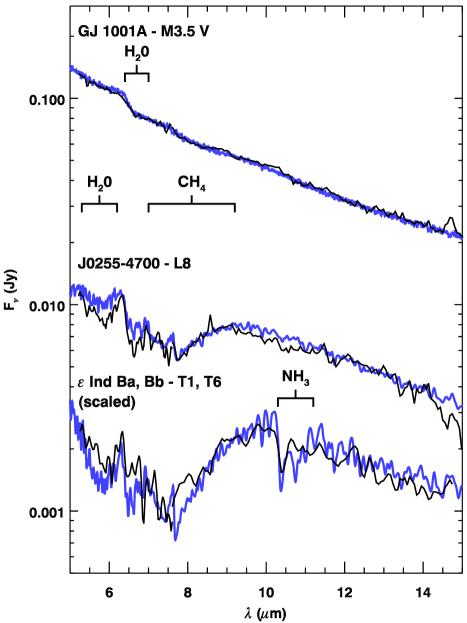
Figure 1 shows the resulting IRS low-resolution spectra for the three objects reported here. At this early stage in the Spitzer mission, our estimated uncertainty in the absolute photometry is , but the uncertainty in the spectral shape is much less than this. The caption for Figure 1 gives the uncertainties in the spectral shapes which were estimated from a combination of the measured noise in the individual reads of the pixels in the detector arrays and the variation between the spectra extracted from the observations at the two slit positions. These uncertainties therefore incorporate some measure of the residual systematic uncertainties and spectral flat-fielding errors. Uncertainties in the absolute flux calibration were estimated in different ways for the three objects and are described below.
| Object | Observation Dates | Spitzer AOR Key |
|---|---|---|
| Integration Time | ||
| GJ 1001A | 2003 December 16 | 4190464 |
| SL2 480 seconds | ||
| SL1 480 seconds | ||
| LL2 480 seconds | ||
| LL1 960 seconds | ||
| DENIS-P J02554700 | 2004 January 7 | 4192000 |
| SL2 480 seconds | ||
| SL1 480 seconds | ||
| LL2 480 seconds | ||
| LL1 960 seconds | ||
| Indi Ba/Bb | 2003 September 26 | 6625792aaObservations of the binary system Indi Ba/Bb (Scholz et al., 2003; McCaughrean et al., 2004) were taken during the Spitzer In-Orbit Checkout and Science Validation period which accounts for it being observed only by the IRS Short-Low module and for such a short integration time. Additional observations of this object will take place later in the Spitzer mission. |
| SL2 56 seconds | ||
| SL1 56 seconds |

3. Discussion
As the atmospheres of brown dwarfs cool with time, their spectral signatures reflect a progression of changes in their atmospheric chemical equilibrium and condensate structure. The three dwarfs discussed here provide snapshots of this progression. In an M dwarf such as GJ 1001A, the elements O, C, and N are predominantly found in O, CO, and and the atmosphere is too warm for condensation of solids (Allard & Hauschildt (1995); Lodders (1999)). As the effective temperature () falls, a variety of condensates form in the atmosphere, most notably iron and silicates. These condensates are not expected to be well-mixed through the atmosphere, but rather be found in relatively thin, discrete cloud layers overlying the condensation level (Ackerman & Marley (2001); Marley et al. (2002); Tsuji (2002); Woitke & Helling (2004)). As the falls to that of a late L dwarf, such as J02554700, the cloud layer is optically thick and affects either directly (as a major opacity source) or indirectly (by altering the atmospheric temperature/pressure profile) all spectral regions. The exact spectral signature of the cloud depends both on its vertical thickness and the particle size distribution of the condensates. In addition as the atmosphere cools chemical equilibrium begins to favor first over CO and then over (Tsuji (1964); Fegley & Lodders (1996); Burrows & Sharp (1999); Lodders (1999); Lodders & Fegley (2002); Burrows et al. (2001)). The strong mid-infrared bands of these molecules begin to challenge the domination of water opacity, at least in some spectral regions, by the late L’s. By the early to mid T dwarfs, such as the Indi pair, the condensate cloud is forming quite deep in the atmosphere. In the relatively clear, cool atmosphere above the cloud, chemical equilibrium begins to strongly favor and and their spectral features, along with particularly strong bands of water, grow in prominence (Marley et al. (1996); Burrows et al. (1997); Allard et al. (2001); Burrows, Sudarsky, & Lunine (2003)).
Figure 1 shows the resulting pronounced changes in the mid-infrared spectral morphology between the three objects. The spectra and comparisons with synthetic spectra are considered for each of the objects in turn.
3.1. GJ 1001A
GJ 1001A is classified as an M3.5 V star (Hawley, Gizis, & Reid, 1996) and is part of a binary system with the L5 dwarf GJ 1001B (Goldman et al., 1999). The distance between the primary and secondary is large enough (18″) that there is no contamination of the primary’s spectrum by stray light from the secondary. Using optical and near-infrared spectra, Leggett et al. (2002) find a best fit to this object with = 3200 K and using a mixing length parameter of 2 in the AMES-dusty models of Allard et al. (2001). Figure 2 compares this same model, smoothed to a spectral resolution of , with the IRS data. The 6.5 µm feature seen in the IRS spectrum also appears in the model and arises from H2O opacity.
For the object GJ 1001A the near-infrared observations (Leggett et al., 2002) can be used with the model and the resulting predicted photometric flux compared with our observations. Although the shape of the model spectrum is an excellent match to the IRS data, the model fluxes derived from the near-infrared observations had to be scaled by a factor of 0.87 to fit the observed data. The near-infrared flux levels are consistent with the and radius derived from the luminosity if the dwarf is older than 0.15 Gyr (Leggett et al., 2002; Baraffe et al., 1998).
3.2. J02554700
J02554700 is classified optically as an L8 dwarf.111http://spider.ipac.caltech.edu/staff/davy/ARCHIVE Unfortunately the trigonometric parallax distance of this object has not been measured. Considerable structure can be seen in the IRS spectrum and to interpret these results we have compared the IRS data with the model described by Marley et al. (2002) and Saumon et al. (2003), with Teff = 1400 K, in Figure 2. In this model atmospheric condensate clouds are treated as described by Ackerman & Marley (2001) with a sedimentation efficiency parameter . The model has been normalized to match the observed flux in the 8.6 – 9.0 µm region. Models that include condensate sedimentation in the chemical equilibrium but ignore cloud opacity require unrealistically high Teff to acceptably fit the data and these are not shown here. We judge the excellent agreement of the cloudy model to the J02554700 data as further evidence for finite-thickness silicate and iron clouds in the observable atmospheres of late L dwarfs. As can be seen in the figure the correlation between the model spectrum and the IRS data is excellent, although there is a slight discrepancy between the data and model predictions in the H2O feature at 5.5 – 6.5 µm. In addition there is a broad shallow dip in the IRS data compared with the model between 9 and 11 µm that may be due to a silicate cloud feature. The IRS spectrum shows the first detection of the 7.8 µm CH4 band in a brown dwarf. was detected at 3.3 µm in L dwarfs by Noll et al. (2000) and since the band is of comparable strength to the fundamental, it is not surprising to find this mid-infrared signature of atmospheric methane in an L dwarf. Models with (Saumon, Marley, & Lodders (2003)) and without (Burrows et al. (1997); Allard et al. (2001)) dust opacity also anticipated this feature in the L dwarf Teff range along with the water features noted above. Methane absorption is even more obvious in the spectrum of the Indi B system discussed below.
Creech-Eakman et al. (2004) used OSCIR at Gemini South to image J02554700 in the -band ( – 13.4 µm) and three narrowband filters centered at 8.8, 10.3 and 11.7 µm. Flux density detections were obtained in the and 8.8 µm bands, with upper limits for the 10.3 and 11.7 µm bands. Despite the estimated 25% uncertainty in our absolute flux calibration, the IRS spectrum cannot be scaled to match both their -band and their 8.8 µm flux density measurements. Creech-Eakman et al. (2004) note that the -band flux density is a factor of 2 to 3 greater than the narrowband values and discuss possible causes of this discrepancy. Our data can rule out two of their suggestions - the presence of peculiar emission or absorption lines. Figures 1 and 2 show that there are no strong emission features in the bandpass and also that the narrow bandpasses do not fall in regions of strong absorption. While it is difficult to reconcile all of the Creech-Eakman et al. photometry with our IRS spectrum, our data can be brought into approximate agreement with the three narrowband measurements if the spectrum is scaled to the lower limit of the 8.8 m OSCIR detection. This may indicate that the -band measurement is in error.
3.3. Indi Ba and Bb
The Indi Ba and Bb system consists of a T1 and T6 dwarf separated by 0732 (McCaughrean et al., 2004). The IRS does not have the spatial resolution to separate the two objects so the measured spectrum is a composite of the two individual spectra. In this object we find the first evidence for NH3 absorption in the spectrum between 10 and 11 µm, although its presence in very cool brown dwarf atmospheres has been expected for some time (Tsuji, 1964; Marley et al., 1996; Fegley & Lodders, 1996; Saumon et al., 2000; Allard et al., 2001; Burrows, Sudarsky, & Lunine, 2003; Saumon, Marley, & Lodders, 2003). Saumon et al. (2000) reported a weak detection of NH3 in the near infrared spectrum of the T6 dwarf Gl 229B but this is the first strong detection of NH3 in a brown dwarf. With the lower Teff for the components of this binary system the condensate clouds are predicted to be below the photosphere and thus have a less pronounced effect on the composite spectrum than they do on the L8 dwarf’s spectrum.
A composite model spectrum provides an excellent match to the IRS data and was obtained as follows. As with the model for J02554700 we used the model described by Marley et al. (2002) and Saumon et al. (2003). From the estimates of for each component (McCaughrean et al., 2004) and the estimated age of Indi A (0.8–2 Gyr; Lachaume et al., 1999), we use our brown dwarf cooling calculations (Marley et al., 2004) to obtain (, log , ) = (1250 K, 5.13, 0.094), (840 K, 4.89, 0.100) for the T1 and the T6 dwarfs, respectively. Selecting the closest cloudless synthetic spectra in our grid of models (1200 K, 5.0) and (800 K, 5.0) which are within the uncertainties of those parameters, and using the above radii and the trigonometric parallax of Indi A (Perryman et al., 1997), the absolute flux at the Earth of the T dwarf binary was obtained. Note that in Figure 2, the composite model spectrum has not been normalized to the IRS data, so that in this case the predicted flux agrees with the IRS data to within the data errors.
4. Summary and Conclusions
(1) We have taken advantage of the unprecedented sensitivity of the Infrared Spectrograph instrument on the Spitzer Space telescope to observe two brown dwarfs. These are the first spectra in this wavelength range ever reported for this type of object. The spectrum of an M dwarf is also reported here, providing a contrast between objects with masses above and below the Hydrogen-Burning Minimum Mass.
(2) The observed mid-infrared spectral morphologies of these three objects vary strongly with their spectral classes, reflecting the changes in gas chemistry driven by the temperature of their atmospheres.
(3) Model comparisons with the observed spectra of all three objects show good agreement, with only a few minor deviations. Models with cloud opacities do a better job of reproducing the data from J02554700 than do models without clouds.
(4) We report here the first positive detection of the 7.8 µmmethane band. We also report the first unambiguous detection of NH3 in a brown dwarf atmosphere.
5. Acknowledgments
We are pleased to thank the entire team of dedicated scientists, engineers, and managers that contributed to the development of the Spitzer observatory and the IRS instrument. In particular, we would like to especially thank Larry Simmons and David Gallagher of JPL, and John Troeltzsch, Marty Huisjen, and John Marriott of Ball Aerospace for their leadership in this endeavor. This work is based on observations made with the Spitzer Space Telescope, which is operated by the Jet Propulsion Laboratory, California Institute of Technology under NASA contract 1407. Support for this work was provided by NASA’s Office of Space Science. T. Roellig and M. Marley would like to acknowledge the support of the NASA Office of Space Sciences. D. Saumon’s work at LANL is supported by the United States Department of Energy under contract W-7405-ENG-36. M. Cushing is supported by a Spitzer Fellowship.
References
- Ackerman & Marley (2001) Ackerman, A. S. & Marley, M. S. 2001, ApJ, 556, 872
- Allard & Hauschildt (1995) Allard, F. & Hauschildt, P. H. 1995, ApJ, 445, 433
- Allard et al. (2001) Allard, F. Hauschildt, P. H., Alexander, D. R., Tamanai, A., & Schweitzer, A. 2001, ApJ, 556, 357
- Baraffe et al. (1998) Baraffe, I., Chabrier, G., Allard, F. & Hauschildt, P. H. 1998, A&A, 337, 403
- Burgasser et al. (2002) Burgasser, A. J. et al. 2002, ApJ, 564, 421
- Burrows et al. (1997) Burrows, A., et al. 1997, ApJ, 491, 856
- Burrows et al. (2001) Burrows, A., Hubbard, W. B., Lunine, J. I., & Lieberrt, J. 2001, Reviews of Modern Physics, 73, 719
- Burrows & Sharp (1999) Burrows, A. & Sharp, C. M. 1999, ApJ, 512, 843
- Burrows, Sudarsky, & Lunine (2003) Burrows, A., Sudarsky, D., & Lunine, J. I. 2003, ApJ, 596, 587
- Creech-Eakman et al. (2004) Creech-Eakman, M. J., Orton, G. S., Serabyn, E. & Hayward. 2004, ApJ, 602, L129
- Fegley & Lodders (1996) Fegley, B. J. & Lodders, K. 1996, ApJ, 472, L37
- Goldman et al. (1999) Goldman, B. et al. 1999, A&A, 351, L5
- Hawley, Gizis, & Reid (1996) Hawley, S.L., Gizis, J. E., & Reid, I. N. 1996, AJ, 112, 2799
- Higdon et al. (2004) Higdon, S. J. U., et al. 2004, PASP, submitted
- Houck et al. (2004) Houck, J.R., et al. 2004, ApJS, in this issue
- Kirkpatrick et al. (2000) Kirkpatrick, J. D., et al., 2000, AJ, 120, 447
- Knapp et al. (2004) Knapp, G. K., et al., 2004, AJ, in press
- Lachaume et al. (1999) Lachaume, R., Dominik, C., Lanz, T. & Habing, H. J. 1999, A&A, 348, 897L
- Leggett et al. (2001) Leggett, S. K., Allard, F., Geballe, T. R., Hauschildt, P. H., & Schweitzer, A., 2001, ApJ, 548, 908
- Leggett et al. (2002) Leggett, S. K., Hauschildt, P. H., Allard, F., Geballe, T. R., & Baron, E. 2002, MNRAS, 332, 78
- Lodders (1999) Lodders, K. 1999, ApJ, 519, 793
- Lodders & Fegley (2002) Lodders, K. & Fegley, B. 2002, Icarus, 155, 393
- Marley et al. (1996) Marley, M. S., Saumon, D., Guillot, T., Freedman, R. S., Hubbard, W. B., Burrows, A., & Lunine, J. I. 1996, Science, 272, 1919
- Marley et al. (2002) Marley, M. S., Seager, S., Saumon, D., Lodders, K., Ackerman, A. S., Freedman, R. S., & Fan X. 2002, ApJ, 568, 335
- Marley et al. (2004) Marley, M. S., Saumon, D., Lodders, K., Freedman, R. S., 2004, in preparation.
- McCaughrean et al. (2004) McCaughrean, et al. 2004, A&A, 413, 1029
- McLean et al. (2003) McLean, I. S., McGovern, M. R., Burgasser, A. J., Kirkpatrick, J. D., Prato, L., & Kim, S.S. 2003, ApJ, 596,561
- Noll et al. (2000) Noll, K. S., Geballe, T. R., Leggett, S. K., & Marley, M. S. 2000, ApJ, 541, L75
- Perryman et al. (1997) Perryman, M. A. C., et al. 1997, A&A, 323, L49
- Saumon et al. (2000) Saumon, D., Geballe, T. R., Leggett, S. K., Marley, M.S., Freedman, R. S., Lodders, K., Fegley, B., Jr. & Sengupta, S. K. 2000, ApJ, 541, 374
- Saumon, Marley, & Lodders (2003) Saumon, D., Marley, M.S., & Lodders, K. 2003, ArXiv Astrophysics e-prints, astro-ph/0310805
- Scholz et al. (2003) Scholz, R.-D., McCaughrean, M. J., Lodieu, N., & Kuhlbrodt, B. 2003, A&A, 398, L29
- Skrutskie et al. (1997) Skrutskie, M. F., et al. 1997, in The Impact of Large Scale Near-IR Sky Surveys, ed. F. Garzon et al. (Dordrecht: Kluwer Academic Publishing Company), 25
- Tsuji (1964) Tsuji, 1964, Annals of the Tokyo Astronomical Observatory, 9,1
- Tsuji (2002) Tsuji, T. 2002, ApJ, 575, 264
- Werner et al. (2004) Werner et al. 2004, ApJS, in this issue
- Woitke & Helling (2004) Woitke, P. & Helling, C. 2004, A&A, 414, 335
- York et al. (2000) York, D. G. et al. 2000, AJ, 120, 1579