Detection of the Main Sequence Turn-off of a Newly Discovered Milky Way Halo Structure in the Triangulum-Andromeda Region
Abstract
An upper main sequence (MS) and main-sequence turn-off (MSTO) feature appears in the color-magnitude diagram (CMD) of a large area photometric survey of the southern half of M31 stretching to M33. Imaging in the Washington system allows us to remove the background M31/M33 giants from our CMD and more clearly defined the dwarf star feature, which has an MSTO near . The corresponding stellar population shows little density variation over the area of the sky sampled and is of very low surface brightness, mag arcsec-2. We show that this feature is not the same as a previously identified, MS+MSTO in the foreground of the Andromeda Galaxy that has been associated with the tidal stream ringing the Milky Way disk at less than half the distance. Thus, the new stellar system is a separate, more distant entity, perhaps a segment of tidal debris from a disrupted satellite galaxy. It is most likely related to the structure with similar distance, location and density uniformity seen as an excess of K and M giants in the Two Micron All-Sky Survey reported in the companion paper by Rocha-Pinto et al. (2004).
1 Introduction
The search for halo substructure has become an important avenue by which to constrain models for the growth of galaxies and their stellar populations, which is currently thought to occur through the accretion of smaller companions (e.g., Searle & Zinn 1978, White & Rees 1978). Because this substructure is typically subtle and obscured by a substantial foreground veil of disk stars, eliciting its presence requires strategies that optimize the substructure signal compared to the foreground noise. These strategies include searching for stellar tracers particular to the halo substructure at certain apparent magnitudes, like RR Lyrae stars (e.g., Vivas et al. 2001) or M giants (e.g., Majewski et al. 2003), or utilizing specific regions of the color-magnitude diagram where the presence of the substructure is expected to be strongly expressed compared to the background (e.g., Kuhn, Smith & Hawley 1996, Rockosi et al. 2002). The main sequence-turnoff (MSTO) region has proven particularly useful for identifying or tracing out the tidal tails of accreted satellite systems in the Galactic halo (e.g., Grillmair et al. 1995; Martínez-Delgado et al. 2001, 2004; Newberg et al. 2002, 2003; Ibata et al. 2003, hereafter “I03”). The latter five references have each inferred the presence of new tidal debris structures on the basis of identified MSTO structures in field color-magnitude diagrams. The present discussion follows the precedent of these other papers.
In the course of his deep, large area survey of M31 giants, Ostheimer (2002; see also Ostheimer et al. 2004) noted a feature in his integrated color-magnitude diagram (CMD) that resembled a main sequence turn-off for a foreground Milky Way population. The goal of this paper is to report that this MSTO must be related to a new halo substructure in the direction of Tringulum-Andromeda. I03 have previously reported the existence of an MSTO feature in the foreground of the Andromeda galaxy that they associate with the ring-like tidal stream around the Galactic disk discovered by Newberg et al. (2002) and described by Yanny et al. (2003) and others. We show that the new stellar population reported here is about two magnitudes fainter and at least twice as distant as the ring feature previously described.
2 Data
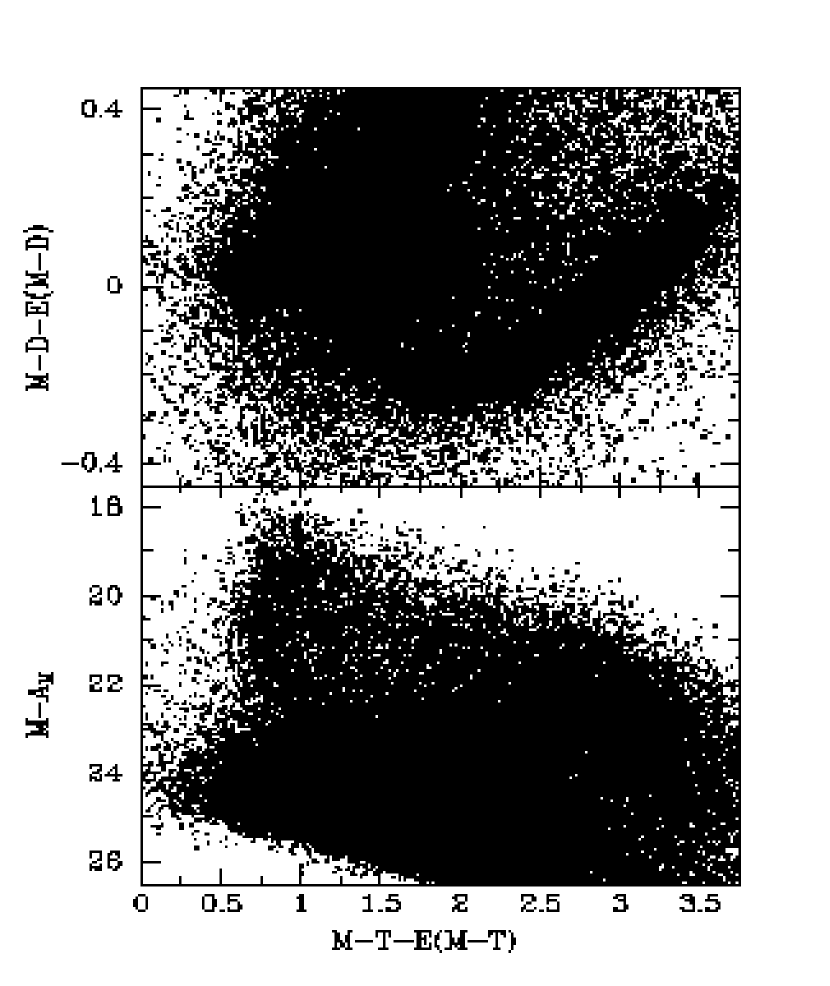
A full description of the data and their reduction is contained in Ostheimer (2002), Ostheimer et al. (2004), and Ostheimer et al. (in preparation). Ten “M31 halo” fields stretching from the southeast of M31 to the northwest of M33 were surveyed using the MOSAIC camera on the KPNO 4-m telescope on the nights of UT 14-18 Nov 1998, and UT 26 Dec 2001-02 Jan 2002. The field placement is shown in Figure 1. Photometry was obtained in the Washington , and filters, a combination employed in the Ostheimer et al. studies to separate foreground Milky Way dwarf stars from M31 halo giants using the technique described by Majewski et al. (2000; see below). Stellar sources were identified and photometered using DAOPHOT II (Stetson 1992) and ALLFRAME (Stetson 1994); Figure 2 (bottom panel) shows the combined color-magnitude diagram (CMD) for more than 8.3 million stellar sources (selected with DAOPHOT and to remove galaxies) corrected for reddening on a star-by-star basis using the maps of Schlegel et al. (1998). The total area represented is 3.6 deg2. The large mass of points at faint magnitudes in the CMD corresponds to the top of the M31/M33 giant branch (and perhaps some contribution of contaminating compact galaxies), while the smaller mass of points redder than is from nearby late type dwarf stars. Here we call attention to the hook-like feature near above the M31 giants, brighter than . It clearly is not associated with M31, as we shall now show.
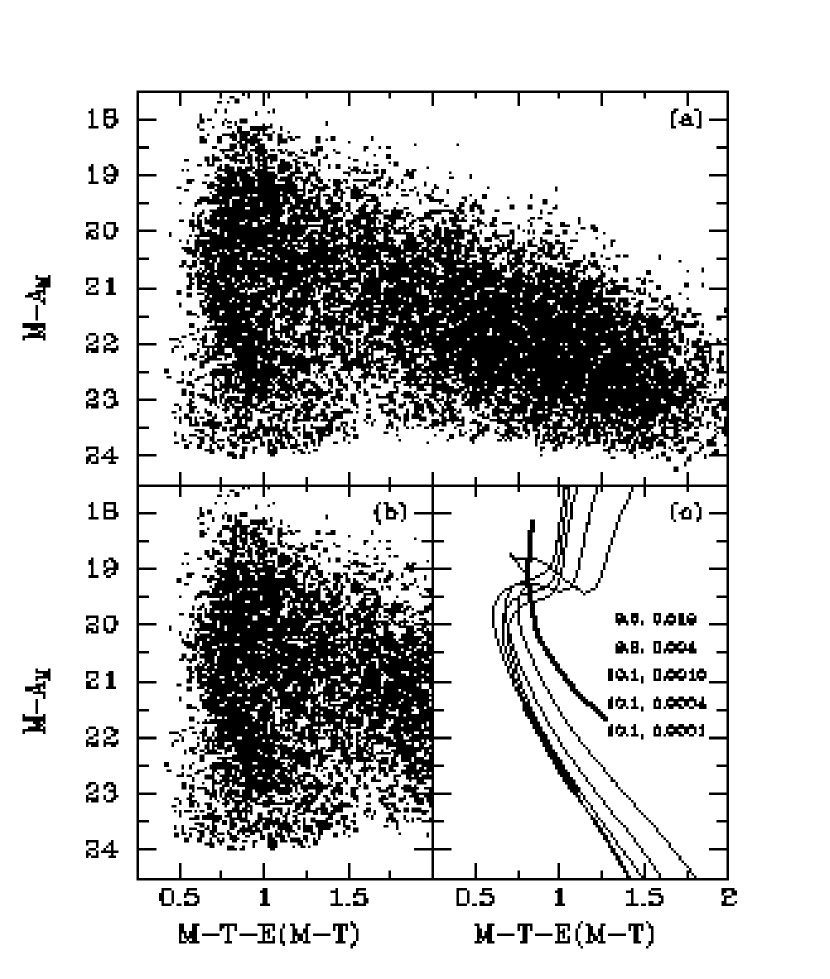
Because the color is primarily sensitive to stellar surface gravity whereas is primarily sensitive to surface temperature, the diagram (2CD; top panel of Figure 2) has previously been used to remove foreground dwarf stars as contaminants from distant giant star samples (e.g., Majewski et al. 2000b, Palma et al. 2002); but here the foreground dwarfs are the targets of interest. To remove the background giant stars, we fit the dwarf star locus in the 2CD (see Majewski et al. 2000) of Figure 2 with an eighth order polynomial and discard all stars with an color more than 0.075 mag from that locus. We also impose magnitude error limits of 0.075 in all passbands for the present paper. A CMD of the resulting sample of “dwarf only” stars (Fig. 3a) shows the hook-like feature more clearly, and largely free of the background M31 giant stars and compact galaxy contamination.111Galaxies not already removed by the DAOPHOT morphological parameters are generally removed by the 2CD analysis because galaxy spectral energy distributions have a strong contribution from K or M giant stars, and, moreover, galaxies at larger redshifts have their Mgb+MgH feature redshifted out of the passband, giving them an color identical to that of a featureless object at wavelengths. That the MS feature appears to “end” at is an artifact of the irregular limiting magnitudes and seeing among the ten M31 fields.
To assess the significance of the MS feature we must first account for the “background” of other, unrelated sources. Unfortunately, because the MS+MSTO feature appears in all of our fields, we have no CMD to use as a “control field” to subtract from Figure 3a. Thus, an estimate the number of “background” stars falling in the region of the MS must be estimated from the density of stars in nearby regions of the CMD. We prefer to avoid regions of the CMD where there is a less reliable handle on the “CMD background” level, and this forces us away from using the MSTO proper. Instead, focus is placed on the region in the Figure 3a CMD where the MS feature is both distinct and for which there are populated regions of the CMD to either side of the MS from which to interpolate, namely . As a tool, we include in Figure 3b a ridge line () for the MS in this magnitude range. This particular ridge line was found to give a minimum width in the distribution of differences between the colors of stars in the MS structure and the ridge line over (Fig. 4a); this ridge line is purely observationally derived and for now we ascribe no special astrophysical content to it. Figure 4 shows the distribution of color differences from the ridge line for . The peak near the origin of Figure 4a represents the MS in this magnitude range. To estimate the background in the region of the MS, we fit a fourth order function to the two 0.30 color ranges to either side of, and not part of, the peak. The inset to Figure 4a shows the resulting distribution within the region defining the background. By this analysis, over the ten fields in our survey there are 934 stars in the to color difference range, while the background is estimated to be 335.9 stars. The result is that over this 1.5 magnitude range of the MS there are estimated to be MS stars (with the error derived from Poissonian statistics), and the MS is detected with a at these magnitudes.
3 Exploring The Main Sequence Turn-Off Feature
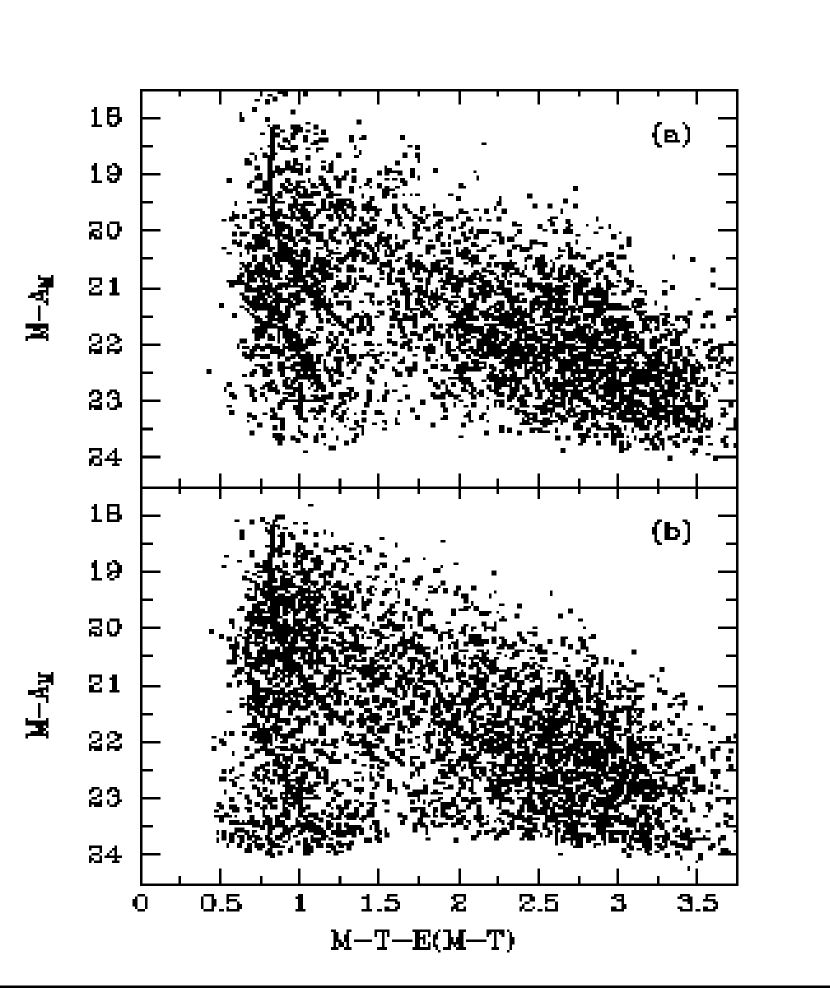
The thickness of the MSTO feature in Figures 2 and 3, and the flat-topped distribution in Figure 4a, are deceptive — the product of the large span of sky surveyed. In fact, the MSTO feature is thinner in any one of our 0.36 deg2 fields, but appears to change distance modulus across the fields, generally getting farther with higher . CMDs of more limited spans of sky area (Figure 5) demonstrate thinner, more coherent MSTOs as well as the distance modulus shift as a function of Galactic latitude — in this case between fields m1, a0 and m4 spanning Galactic latitudes (Fig. 5a) compared to the fields m11, b15, and a19 spanning (Fig. 5b). The shift is also evident in Figures 4b and 4c where the color difference distribution is compared for the two groups of fields shown in Figure 5a and 5b, respectively: The median color difference between the two samples is 0.075 dex,222This is more than the uncertainty in the difference, where the uncertainties in the median values are estimated by with conservatively estimated by the best Gaussian fit to the broader distributions, ignoring the narrow peaks in each. and, adopting the form of the Figure 3 ridge line, this corresponds to a difference in distance modulus between the two Galactic latitudes of magnitudes (a difference in distance of 19%), assuming no metallicity differences. Figures 4 and 5 show that the MS feature has more coherence than suggested in Figures 2 and 3, and that the width of the feature in those latter figures is due neither to a substantial metallicity spread nor a line-of-sight spread in the stellar population creating it.
I03 have previously reported the presence of a foreground MS+MSTO feature in a number of fields in the sky, including, in particular, fields around M31 and M33 (the latter are marked in Fig. 1). However, their focus is on a populations having an MSTO feature at brighter magnitudes (), which they attribute to the ring-like tidal stream first discovered in Monoceros by Newberg et al. (2002; see also Yanny et al. 2003) and found to extend to greater angles around the sky by I03 as well as by Majewski et al. (2003), Rocha-Pinto et al. (2003), Crane et al. (2003), Martin et al. (2003) and Frinchaboy et al. (2004). We convert the ridge line of their discovered MSTO feature into the Washington system333Majewski et al. (2000) give the transformation between Washington and and Johnson-Cousins and . The I03 CMDs of M31 are in the Johnson and Gunn band of the Sloan Digital Sky Survey. From the Wide Field Survey website, http://www.ast.cam.ac.uk/wfcsur/colours.php, we obtain the conversion from to the Landolt system. Menzies et al. (1991) point out a slight difference between the Landolt and the true Cousins systems; we account for this difference before translating to the Washington system. Thus, we obtain and . and include that ridge line in Figures 3 and 5. As may be seen, this feature fails to match the MSTO feature in our data by some 1.5 to 2.5 magnitudes.
We can rule out that our MSTO feature is not simply a population at the same distance as the I03 feature, but somehow more subluminous by magnitudes. Girardi et al. (2002) have produced isochrones in the Washington system for populations with a variety of metallicities and ages. Because our data are saturated for , we do not have a clear view of a subgiant/giant branch that would be associated with our MS+MSTO feature; access to this would be helpful for determining an appropriate metallicity/age isochrone to adopt for main sequence fitting. However, because metallicity is the predominant parameter driving MS luminosity at the colors of our ridge line in Figure 3, it is sufficient to test whether a reasonable metallicity spread can explain the difference between the I03 and our own ridge lines. Figure 3c shows a spread of isochrones from solar to [Fe/H], all shifted by a distance modulus of 16.0 magnitudes. We have selected younger isochrones for the metal-rich isochrones so that they extend to the blue colors of the MSTOs of both the I03 and the newly identified MS+MSTO features, but this is of little consequence to the following discussion. As may be seen, more than this 2.3 dex span of metallicity would be needed to place both the I03 and our fainter ridge line at the same distance, and the situation is exacerbated in the case of the even fainter MS seqences in some of the Ostheimer fields (e.g., those shown in Figure 5b). The argument against association of the two MS populations is made even stronger by the fact that Yanny et al. (2003) have associated the ring MS+MSTO feature with a population dominated by [Fe/H] stars; if this is the case, it is not possible that our feature is at the same distance because the main sequence of a [Fe/H] population is already nearly to the fullest possible subdwarf displacement relative to solar metallicity stars (as shown by the two bottom isochrones in Fig. 3c). Clearly the MS+MSTO we have identified belongs to a coherent stellar structure different than and beyond the foreground system associated with the I03 MS+MSTO.
One may wonder why there is no strong indication of the I03 ring feature within our CMDs. This is due to the strong exponential gradient (described in terms of a scaleheight with in I03) in the density of the ring stars with Galactic latitude: As shown in Figure 10 of I03, the density contrast in ring stars from their northern () and southern () M31 fields (the latter corresponding to the lowest of our fields) is about a factor of three to one. A comparison of their north and south M31 CMDs (their Figures 6 and 7) clearly shows how diffuse the ring MS+MSTO feature has become in the CMD by ; by their M33 field () I03 detect no ring stars. On the other hand, the structural feature we identify shows a much weaker density gradient across our fields (e.g., compare the relative density of the MS+MSTO in Figs. 5a and 5b; see also §5) and it is plainly visible in the M31 field CMDs shown in I03, though these authors do not comment on this more distant feature appearing in their CMDs. The existence of two MS+MSTO features in the I03 M31 CMDs, the fainter one corresponding to the one we have identified and roughly 1.5-2.5 magnitudes fainter than the ( kpc distant) MS+MSTO they discuss, is additional proof that there are two, distinct Milky Way halo structures in this part of the sky. A comparison of Figures 6 and 7 of I03 shows an interesting change in density constrast between the near and far MS+MSTO structures at two different Galactic latitudes ( and ): The two MS+MSTOs are more comparable in density in their field, but the nearer population is much more populous in the field, for reasons discussed above.
The Ostheimer and I03 studies may not be the only surveys to have uncovered this newly-identified Galactic star system, although, to our knowledge, it has never been pointed out before. For example, the MS+MSTO hook we observe here also clearly lies in the “M31” CMDs presented by Durrell et al. (2001) — whose fields correspond well to the location of fields in our study (Fig. 1) — but these authors do not bring attention to this MS+MSTO feature in their CMDs. More recently Durell et al. (2004) have expanded their survey area, and obtain similar results in terms of a clear signal of the fainter MS+MSTO hook in their CMDs. However, the similar lack of the I03 ring MS+MSTO feature in the southerly fields of Durrell et al. (2004), especially compared to their more northern field where a double MS+MSTO is seen (as with the northern I03 field), is consistent with our own non-detection of the brighter ring MS+MSTO feature in the same general area to the south of M31.
4 Discussion
As discussed above, without a clearly defined subgiant branch it is difficult to assign a specific age and metallicity to our MS+MSTO feature, although a variety of combinations of age and can be ruled out (e.g., old, relatively metal-rich – say 10 Gyr, — isochrones do not go blue enough). What we can say is that the MS for any specific isochrone must be at a specific distance modulus to match the observed sequence. For example, as shown in Figure 3c we find that ([Fe/H] ) isochrones must be shifted to a distance modulus of 16.0 to match the mean ridge line across our fields, whereas a ([Fe/H]) isochrone must be shifted to 16.5 and a solar metallicity () isochrone must be shifted to 17.0 to match the ridge line. Thus, with no information on metallicity, the best we can say about the distance of our new stellar structure is that it is from to kpc away if it is of poor to solar metallicity, respectively. On top of this, we identified above (§3; Figs. 4 and 5) an approximately 19% distance variation from field to field, with a larger distance found at higher Galactic latitude.
On the other hand over the roughly area surveyed (Fig. 1) the density of the feature is roughly constant. For this comparison we combine fields at similar Galactic latitudes to improve statistics. For example, the number of stars in the MS feature from , as determined by the background subtraction analysis demonstrated in Figure 4, is and for the lower (, Fig. 4b) and higher (, Fig. 4b) Galactic latitudes, respectively. A similar analysis on the summed three middle latitude fields m6, a13, and m8 (spanning ) yields stars. Thus, to within the Poisson errors (and ignoring shifts in the portion of the MS luminosity function sampled due to distance modulus shifts), there is no variation in the density of the feature. No clear “center” of highest density can be discerned within our survey fields.
The above measurements of the surface density of upper MS stars allows an estimate of the surface brightness of the system via an adopted luminosity function. We actually calculate an upper limit to surface brightness by adopting the steepest mass functions of Silvestri et al. (1998), namely those with an index where the mass function goes as ; this index assures the most generous contribution of low mass stars for every upper MS star. As mentioned above, fitting the the and Girardi et al. (2002) isochrones to our ridge line requires a distance modulus of 16.0, so that the range corresponds to the upper MS magnitudes , or after converting to Johnson . Integrating the 13 Gyr old luminosity function (the lowest metallicity computed by Silvestri et al. 1998) with , we find that the upper MS region represents 12.9% of the total flux in this particular luminosity function and we determine that the detected stars in the feature across our ten fields represents a bright limit to the total surface brightness of the feature of mag arcsec-2. If we repeat the calculation with the Silvestri et al. 9 Gyr luminosity function (the most metal-rich luminosity function they give) we obtain for the equivalent MS range (representing 18.3% of the total luminosity function flux) a limit to the surface brightness of mag arcsec-2. Given that these are lower limits to , derived with the generous mass functions, our detected feature is extremely diffuse. For comparison, the surface brightnesses of the diffuse, northern parts of the Sgr stream identified by a similar analysis of MS+MSTO stars by Martínez-Delgado et al. (2004) are some magnitudes brighter than even the brighter of the two limits derived above. If these limits are converted to solar luminosities at the required distance moduli to match our ridge line, we obtain luminosity density limits of and L☉ deg-2 for the and luminosity functions, respectively.
Accounting for the fact that it also reveals its presence in the I03 CMDs, this newly identified, more distant structure would appear to be at least several times larger than the roughly area we have sampled. Recently, by mapping the distribution of 2MASS K and M giants in the Galaxy, Rocha-Pinto et al. (2004, herafter “R04”) have identified an excess, “cloud-like” structure in the same general area of the sky (Triangulum and Andromeda) and with the same general properties as the stellar population we explore here: Their structure is very diffuse, lies at several times the distance of the nearby, Monoceros “ring” (which R04 also identify as a separate, distinct structure), and has a rather smooth density distribution lacking any discernible nucleus or core. Given the overall agreement of general properties, it is logical to conclude that this structure traced by K and M giants is the same as that structure traced by the MS+MSTO stars in the present contribution. Some support for this conclusion comes from the radial velocities of stars that lie within the MS+MSTO feature in M31 CMDs: In a Keck LRIS spectroscopic survey of the M31 field, Reitzel & Guhathakurta (2002, and in preparation) and Reitzel, Guhathakurta & Rich (2004) find four of eight foreground Milky Way “contaminants” lying along our upper MS feature (from ) to have radial velocities inconsistent with the Andromeda Galaxy (M31 stars generally have km s-1) but within 20 km s-1 of the mean km s-1 (dispersion 18 km s-1) that R04 have measured for dozens of red giant stars in their “TriAnd” cloud feature.
If we make the association of the R04 K and M giant structure with our MS+MSTO structure, then the area of the sky over which R04 detect TriAnd implies a total system luminosity of a mere L☉, where this is an upper limit within that area because the luminosity density used is an upper limit. This is equivalent to no more than a large globular cluster spread over 1000 deg2 of sky. From these dimensions and mass estimates we must conclude that this structure does not resemble any of the known Galactic satellites. If these stars are tracing the core of a gravitationally self-bound satellite galaxy, this “Triangulum-Andromeda” system must be a rather dark galaxy.
A far more likely scenario, in analogy with previously found MSTO detections in deep CMDS (e.g., I03; Martínez-Delgado et al. 2001, 2004; Newberg et al. 2002, 2003), is that what we have detected is a piece of unbound tidal debris in the Galactic halo. In this case, the feature is at a distance of -25 kpc, extends more or less uniformly across at least a 15∘ span (corresponding to the Fig. 1 fields), may extend to much greater lengths (according to R04), and is tenuous compared to tidal debris structures previously identified by their MS and/or MSTO. While it is not surprising that many of the most recently found Galactic halo subcomponents would be clustered at low Galactic latitudes (Willman et al. 2004), the general location of this new feature of the Milky Way — i.e., lying almost directly behind the Newberg-Yanny et al. Monoceros tidal stream as identified in Andromeda by I03 — leads one to wonder about possible associations to the latter structure. Certainly, as shown in §3 and R04, the two M31 foreground features are distinct, but this does not preclude them being different parts of the same entity. As is now well-known from both N-body models (e.g., Ibata & Lewis 1998, Johnston et al. 1999, Helmi et al. 2003, Law et al. 2004) as well as observations (e.g., Majewski et al. 2003) of tidal debris, extremely long tidal arms from disrupting satellites can wrap upon themselves, so that lines of sight can intercept multiple occurences of the same tidal system at different distances. Even for a satellite disrupting in a nearly circular orbit (an orbit that has been suggested for the satellite creating the Newberg-Yanny et al. tidal stream — see, e.g., Crane et al. 2003) the leading/trailing tidal debris arms will extend interior/exterior to the parent satellite’s actual orbital path, so that over time a spiral-like configuration of tidal debris can be created. Further analysis of the chemical and kinematical properties of stars in both the near and far Andromeda structures, as well as tracing them both to larger angle on the sky, would help to establish if they are related. If they are, then the Newberg-Yanny et al. stream is extremely long, and, therefore, relatively old. We note that while an kpc distant stream at this position of the sky is not predicted by the tidal debris model for the ring recently presented by Martin et al. (2004), it is fair to say that models of the ring are still relatively unconstrained and immature; pieces of tidal debris as distant as the structure we see here are easily accommodated in variants of such models (e.g., see Fig. 1 of Helmi et al. 2003 and Fig. 14 of Martin et al. 2004).
SRM and RJP acknowledge funding by NSF grants AST-0307842 and AST-0307851, NASA/JPL contract 1228235, the David and Lucile Packard Foundation, and The F.H. Levinson Fund of the Peninsula Community Foundation. PG acknowledges support from NSF grant AST-0307966 and a Special Research Grant from UCSC. PG and DBR thank Linda Pittroff and Drew Phillips for help with the LRIS spectral reductions. We appreciate helpful discussions with Michael Skrutskie.
References
- Crane et al. (2003) Crane, J. D., Majewski, S. R., Rocha-Pinto, H. J., Frinchaboy, P. M., Skrutskie, M. F. & Law, D. R. 2003, ApJ, 594, L119
- Durrell et al. (2001) Durrell, P. R., Harris, W. E. & Pritchet, C. J. 2001, AJ, 121, 2557
- Durrell et al. (2004) Durrell, P. R., Harris, W. E. & Pritchet, C. J. 2004, AJ, in press (astro-ph/0405403)
- Frinchaboy et al. (2004) Frinchaboy, P.M., Majewski, S.R., Crane, J.D., Reid, I.N., Rocha-Pinto, H.J., Phelps, R.L., Patterson, R.J. & Munoz, R.R. 2004, ApJL, in press (astro-ph/0311101)
- Girardi et al. (2002) Girardi, L., Bertelli, G., Bressan, A., Chiosi, C., Groenewegen, M. A. T., Marigo, P., Salasnich, B., & Weiss, A. 2002, A&A, 391, 195
- Grillmair et al. (1995) Grillmair, C. J., Freeman, K. C., Irwin, M., & Quinn, P. J. 1995, AJ, 109, 2553
- Helmi et al. (2003) Helmi, A., Navarro, J. F., Meza, A., Steinmetz, M. & Eke, V. R. 2003, ApJ, 592, L25
- (8) Ibata, R.A. & Lewis, G.F. 1998, ApJ, 500, 575
- Ibata et al. (2003) Ibata, R. A., Irwin, M. J., Lewis, G. F., Ferguson, A. M. N. & Tanvir, N. 2003, MNRAS, 340, L21 (I03)
- Johnston et al. (1999) Johnston, K.V., Majewski, S.R., Siegel, M.H., Reid, I.N. & Kunkel, W.E. 1999, AJ, 118, 1719
- Kuhn et al. (1996) Kuhn, J.R., Smith, H.A., & Hawley, S.L. 1996, ApJ, 469, L93
- Law et al. (2004) Law, D.R., Johnston, K.V. & Majewski, S.R. 2004, ApJ, submitted
- Majewski, Ostheimer, Kunkel, & Patterson (2000) Majewski, S. R., Ostheimer, J. C., Kunkel, W. E., & Patterson, R. J. 2000, AJ, 120, 2550
- Majewski et al. (2003) Majewski, S. R., Skrutskie, M. F., Weinberg, M. D. & Ostheimer, J. C. 2003, ApJ,599, 1082
- Martin et al. (2004) Martin, N.F., Ibata, R.A., Bellazzini, M., Irwin, M.J., Lewis, G.F. & Dehnen, W. 2004, MNRAS, in press (astro-ph/0311010)
- Martinez-Delgado et al. (2001) Martínez-Delgado, D., Aparicio, A., Gómez-Flechoso, M. Á., & Carrera, R. 2001b, ApJ, 549, L199
- Martínez-Delgado, Gómez-Flechoso, Aparicio, & Carrera (2004) Martínez-Delgado, D., Gómez-Flechoso, M. Á., Aparicio, A., & Carrera, R. 2004, ApJ, 601, 242
- Menzies et al. (1991) Menzies, J. W., Marang, F., Laing, J. D., Coulson, I. M., & Engelbrecht, C. A. 1991, MNRAS, 248, 642
- Newberg et al. (2002) Newberg, H. J., et al. 2002, ApJ, 569, 245
- Newberg et al. (2003) Newberg, H. J., et al. 2003, ApJ, 596, L191
- Ostheimer (2002) Ostheimer, J. C. 2002, Ph.D. Thesis, University of Virginia
- Ostheimer et al. (2004) Ostheimer, J. C., Link, R., Majewski, S.R., Patterson, R.J. & Crane, J.D. 2004, in preparation
- Reitzel & Guhathakurta (2002) Reitzel, D. B. & Guhathakurta, P. 2002, AJ, 124, 234
- Reitzel et al. (2004) Reitzel, D. B., Guhathakurta, P., & Rich, R. M. 2004, AJ, 127, 2133.
- Rocha-Pinto et al. (2004) Rocha-Pinto, H. J., Majewski, S. R., Skrutskie, M. F., Crane, J. D. & Patterson, R. J. 2004, ApJ, submitted (R04)
- Rocha-Pinto et al. (2003) Rocha-Pinto, H. J., Majewski, S. R., Skrutskie, M. F. & Crane, J. D. 2003, ApJ, 594, L115
- Rockosi et al. (2002) Rockosi, C. M. et al. 2002, AJ, 124, 349
- Schlegel, Finkbeiner, & Davis (1998) Schlegel, D. J., Finkbeiner, D. P., & Davis, M. 1998, ApJ, 500, 525
- Searle & Zinn (1978) Searle, L. & Zinn, R. 1978, ApJ, 225, 357
- Silvestri, Ventura, D’Antona, & Mazzitelli (1998) Silvestri, F., Ventura, P., D’Antona, F., & Mazzitelli, I. 1998, ApJ, 509, 192
- Stetson (1992) Stetson, P. B. 1992, in Astronomical Data Analysis Software and Systems, eds. D.M. Worrall, C. Biemesderfer & J. Barnes, ASP Conf. Ser. Vol. 25, (San Francisco: ASP), p.297
- Stetson (1994) Stetson, P. B. 1994, PASP, 106, 250
- Vivas et al. (2001) Vivas, A. K. et al. 2001, ApJ, 554, L33
- White & Rees (1978) White S.D.M., Rees M.J., 1978, MNRAS, 183, 341
- Willman et al. (20040) Willman, B., Governato, F., Dalcanton, J.J., Reed, D. & Quinn, T. 2004, MNRAS, submitted (astro-ph/0403001)
- Yanny et al. (2003) Yanny, B., et al. 2003, ApJ, 588, 824