Kinematics of two dwarf galaxies in the NGC 6946 group
We present high velocity resolution ( km s-1) Giant Meterwave Radio Telescope (GMRT) HI 21 cm synthesis images of the dwarf galaxies KK98 250 and KK98 251, as well as optical broad band images of KK98 250. We find that, despite being faint (), both galaxies have regular velocity fields. In both cases the velocity fields are consistent with rigid body rotation. We derive rotation curves for the galaxies and fit mass models to them. For both galaxies, we find acceptable fits using isothermal halos while NFW halos provide a poor fit. Finally, we compile from literature a sample of galaxies with HI synthesis observations and I band magnitudes. From this sample we find, in agreement with earlier studies (which used single dish HI data), that dwarf galaxies tend to lie below the I band Tully-Fisher relation defined by brighter galaxies.
Key Words.:
galaxies: dwarf – galaxies: kinematics and dynamics – galaxies: individual: KK98 250 galaxies: individual: KK98 251 radio lines: galaxies1 Introduction
There has been renewed interest in the kinematics of dwarf galaxies for two reasons. (1) There appears to be a conflict between hierarchical galaxy formation model predictions for, and observational determinations of, the dark matter halo density profile of galaxies. In particular, these models predict a cuspy central halo, which many observers find inconsistent with observations (e.g. Weldrake et al. (2003)). While the models predict cuspy halos for all galaxies, dwarf galaxies are believed to be best suited for tests of the models because these galaxies are in general held to be dominated by dark matter, even in the innermost regions. In larger galaxies, uncertainties in the stellar mass to light ratio limit one’s ability to determine density profile of the dark matter halo. (2) It appears that faint dwarf galaxies deviate significantly from the Tully-Fisher relationship as defined by bright galaxies. While the TF relation is generally studied using the inclination corrected 50% profile width (usually obtained from single dish observations), it is unclear whether this is an appropriate measure to use for the faintest dwarf galaxies, where the rotational velocities are comparable to the velocity dispersion. For such galaxies, the “asymmetric drift” corrected rotational velocity is probably a better measure. However, estimating this quantity requires HI synthesis imaging. Further, for the faint dwarf irregulars, even the inclination may be difficult to estimate from the optical image and may only be obtainable from the HI distribution and kinematics. Unfortunately, the number of faint dwarf galaxies with sufficiently high quality HI synthesis images available is quite small. We discuss here GMRT HI observations of two dwarf galaxies, KK98 250 and KK98 251, in light of both these issues. In discussing the TF relation, we combine our data for KK98 250 and KK98 251 with our earlier data for still fainter galaxies and data for brighter galaxies available from the literature.
Both KK98 250 and KK98 251 were identified as companions to the giant spiral galaxy NGC 6946 by Karachentseva & Karachentsev (1998), and have also been observed in HI at Effelsberg (Huchtmeier et al. 1997) and at the DRAO (Pisano & Wilcots (2000)). The data presented here are of much higher sensitivity and resolution than the DRAO data. Distance estimates to KK98 250 and KK98 251 vary from 5.3 Mpc (Sharina et al. 1997, Karachentsev et al. 2000) to 8.2 Mpc (Sharina et al. 1997). Because of the proximity of the two galaxies to each other and to NGC 6946, on the sky as well as in the velocity, we feel that it is likely that all these galaxies belong to the same group viz. the NGC 6946 group. Hence, in this paper we take the mean distance to the group (5.6 Mpc, estimated from the brightest stars in eight members of the group) as the distance to both the galaxies (Huchtmeier et al. 2000). At this distance, the absolute blue magnitude for KK98 250 and KK98 251 are 13.72 and 14.54 respectively.
2 Observations
2.1 Optical Observations and analysis
CCD images of KK98 250 and KK98 251 in the Bessell I and V filters were obtained on 29th and 30th May 2003, using the HFOSC (Himalayan Faint Object Spectrograph Camera), at the 2.0 m Himalayan Chandra Telescope. The camera has a field of view of 1010′, with a scale of 0.3/pixel. Both the galaxies were covered in the same pointing. The total exposure time on the target was 40 min in I and 50 min in the V band. The FWHM seeing of the co-added images was . Since the first night was not photometric, standard fields (from Landolt (1983)) were observed only on the second night.
Debiasing, flat-fielding and cosmic ray filtering were done in the usual manner, using standard IRAF routines. The exposures taken on the 30th were calibrated and then added after alignment. This combined frame was used to calibrate the individual exposures taken on the 29th. No fringe subtraction was done for the I band images.
Surface photometry for KK98 250 was done using the ellipse fitting algorithm of Bender & Möllenhoff (1987). Ellipse fitting in the I band was restricted to the inner regions of the galaxy, since the outer low surface brightness emission is affected by fringing. The average ellipticity was found to be (corresponding to an inclination of , for an intrinsic thickness ratio ). The position angle, measured between the north direction on the sky and the major axis of the receding half of the galaxy (see Sect. 3.3), was found to be . The surface brightness profiles obtained from the ellipse fitting in V and I bands are well described by exponential disk with the scale length of (1.1 kpc) and (1.7 kpc) respectively. The average V-I color is 1.2, with little variation with radius. The total magnitude after correcting for galactic extinction (using =1.01 mag and =0.59 mag; Schlegel et al. 1998) is 13.80.3 mag in V and 12.60.4 mag in I. No correction for internal extinction was applied.
KK98 251 has several bright stars superposed on it which could not be accurately removed. For this galaxy, we hence use the results of the I band photometry derived by Karachnetsev et al (2000), who derived an I band exponential scale length and a total I magnitude of (0.6 kpc) and 14.42 mag respectively.
2.2 HI observations and analysis
| Parameters | Value |
|---|---|
| RA(2000) | 20h30m33.0s |
| Declination(2000) | |
| Central velocity (heliocentric) | 121.0 km s-1 |
| Date of observations | 22 June 2001 |
| Time on source | 6 hrs |
| Total bandwidth | 1.0 MHz |
| Number of channels | 128 |
| Channel separation | 1.65 km s-1 |
| FWHM of synthesized beam | 43, 26, |
| 16, 11.5 | |
| RMS noise per channel | 3.5 mJy, 2.8 mJy, 2.2 mJy |
| 1.9 mJy |
The GMRT (Swarup et al. 1991) observations of KK98 250 and KK98 251 were conducted during the commissioning phase of the telescope. The field of view of the telescope ( is large enough to cover both galaxies in a single pointing. The setup for the observations is given in Table 1. The calibrators were 3C48 and 3C286 (flux), 2022+616 (phase) and 3C286 (bandpass).
The data were reduced in the usual way using standard tasks in classic AIPS. The GMRT has a hybrid configuration which simultaneously provides both high angular resolution ( if one uses baselines between the arm antennas) as well as sensitivity to extended emission (from baselines between the antennas in the central array). Data cubes were therefore made using various (u,v) cutoffs, including 05 k, 010 k, 0 k and 020 k. The corresponding angular resolutions are 43, 26, 16 and 11.5. All the data cubes were deconvolved using the AIPS task IMAGR and then corrected for primary beam attenuation.
Moment maps of the data cubes were made using the AIPS task MOMNT. Maps of the velocity field and line profile widths were also made in GIPSY, using single gaussian fits to the line profiles. The velocity fields produced by gaussian fitting were found to be in a reasonable agreement with that obtained from moment analysis. As we discuss in more detail later, we need to know the velocity dispersion of the gas in order to estimate the pressure support in the HI disk. For dwarf galaxies, where the contribution from systematic rotation to the profile width in a single synthesized beam is small, the velocity dispersion can generally be estimated from the width of the line profiles. However, for a highly inclined galaxy like KK98 250, the profile width is dominated by rotational motion even within a single synthesized beam. For this galaxy, we hence assume that the velocity dispersion is km s-1, a typical value for dwarf galaxies (e.g. Lake et al. (1990); Skillman et al. (1988)). For KK98 251, from the widths obtained from gaussian fitting (which we prefer to use because the thresholding algorithm used by the MOMNT task results in an underestimation of the true profile width), we find that the profile widths vary from km s-1 in the inner region (upto ) to km s-1in the outer regions.
Finally, a continuum image was made using the average of the line free channels but no extended continuum (to limit of 1.8 mJy/beam for a beam size of ) was detected from either galaxy. A high resolution () image also showed no compact sources associated with either galaxy down to a limit of 1.0 mJy/beam.
3 Results and Discussion
3.1 HI distribution

The global HI emission profiles of KK98 250 and KK98 251 (obtained from 43 data cube), are shown in Fig. 1. The integrated flux of KK98 250 is Jy km s-1, the (heliocentric) systemic velocity and the velocity width at 50% level of peak emission (W50) are 126.0 km s-1and km s-1. The systemic velocity is a good match to the single dish value of km s-1(Huchtmeier et al. (1997)), but the flux integral is considerably lower than the single dish value of 20.0 Jy km s-1. For KK98 251, the integrated flux is Jy km s-1, the systemic velocity is km s-1and W50 is km s-1. Again, the systemic velocity is in reasonable agreement with the value of km s-1obtained from single dish observations (Huchtmeier et al. (1997)), but the integrated flux and W50 are considerably smaller than the single dish values of 14.6 Jy km s-1and km s-1respectively.
The GMRT fluxes could be lower than those obtained from single dish measurements either because of (i) a calibration error or (ii) a large fraction of the HI being in an extended distribution that is resolved out. However, the flux of the point sources seen in the GMRT image are in good agreement with those listed in NVSS, indicating that our calibration is not at fault. Further, from our past experience in HI imaging of galaxies (with sizes similar to KK98 250 and KK98 251) with the GMRT, it seems unlikely that we have resolved out a large fraction of the total flux. Interestingly, a large discrepancy between the interferometric fluxes and the single dish fluxes was also seen in the DRAO images of these galaxies (Pisano & Wilcots (2000)), although the comparison in that case is complicated by the very poor signal to noise ratio of the DRAO data. Finally, we note that for both the galaxies there is a strong local HI emission at velocities very close to the systemic velocities. Hence, it is likely that the single dish integrated flux measurements were contaminated by blending of the HI emission from the galaxies with that of the galactic emission due to both the coarse velocity resolution (10.0 km s-1), as well as imperfect subtraction of the foreground emission in the position switching mode used in those observations. If we assume that the total fluxes are those measured at the GMRT, then the HI mass of KK98 250 is and . For KK98 251, the corresponding numbers are and .
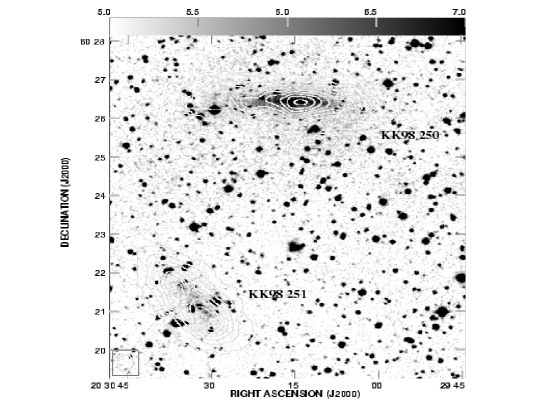
Fig. 2 shows the integrated HI emission from KK98 250 and KK98 251 at 26 resolution, overlayed on the digitized sky survey (DSS) image. Although KK98 250 may be mildly warped, there is no clear signature of interaction between the two galaxies. For KK98 251, two high density peaks are seen near the center.
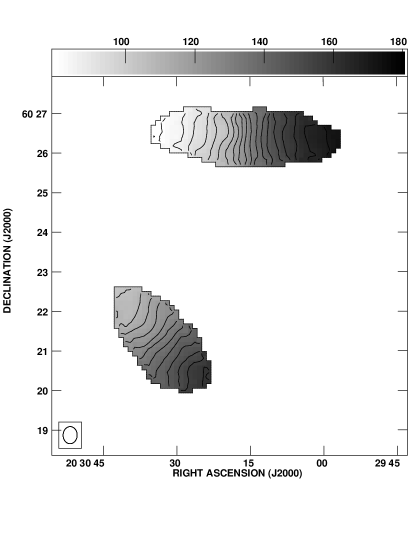
An estimate of the morphological center, position angle (PA) and inclination (assuming an intrinsic thickness ratio ) of the galaxies were obtained by fitting elliptical annuli to the 43, 26 and 16 resolution integrated HI column density maps. For KK98 250, the inclination and PA were found to be and degrees respectively. Due to the high density clumps in the center, ellipse fitting for KK98 251 was restricted to the outer contours of the 43 and 26 resolution images. The inclination and PA of the HI disk were found to be and degrees respectively. For each galaxy, the value of the PA and inclination estimated from different resolution images match within the error bars. For KK98 250, the estimated parameters are also in good agreement with the values obtained from the optical image.
Another input that we require for estimating the pressure support of the HI disk is the deprojected HI radial surface density profile. For highly inclined galaxies, deprojection using ellipse fitting does not lead to reliable estimates for the surface density. Hence, in the case of KK98 250, Lucy’s (1974) iterative decovolution scheme, as adapted and developed by Warmels (1988), was used to derive the HI surface mass density. Fig. 3[A] shows the best fit HI radial profile obtained from the 26 resolution HI image using Lucy’s scheme. Note that the deconvolved HI surface density profile shows a steep rise of 40% in the central , i.e. within one synthesized beam. This is likely to be an artifact produced by the deconvolution; similar artifacts produced by this method have been seen earlier, by for e.g. Swaters (1999). We therefore fit the surface density by a double Gaussian (shown as dotted line in Fig. 3[A]), and use only the broad component for further analysis. For reference the full double Gaussian fit is given by:
| (1) |
with , , and .
For KK98 251, the HI surface density profile was obtained in the usual way from fitting elliptical annuli. The surface density (shown in Fig. 3[B]) was obtained from the integrated HI column density image at 26 resolution image and is well represented by a Gaussian:
| (2) |
with , c= and .

3.2 HI Kinematics
The velocity fields of KK98 250 and KK98 251, derived from the 26 resolution HI data cube are shown in Fig. 4. The velocity fields are regular and the isovelocity contours are approximately parallel, which is a signature of rigid body rotation.
The velocity field of KK98 251 is slightly lopsided, the isovelocity contours in the north-eastern half of the galaxy are more curved than the south-western half. Some small scale kinks are also seen in the isovelocity contours in the outer regions of the galaxy, indicative of a weak warping of the outer disk. These effects are more prominent in the higher spatial resolution velocity fields (not shown), which also show a mild twist in the kinematical major axis in the outer region of the galaxy, consistent with warping.
3.3 HI Rotation Curve
The rotation curves of the galaxies were derived separately for each of the , and velocity fields, using the usual tilted ring model (Warner et al. 1973). For the edge on galaxy KK98 250, as described in more detail below, the rotation curve was also derived by fitting to the position-velocity diagram.
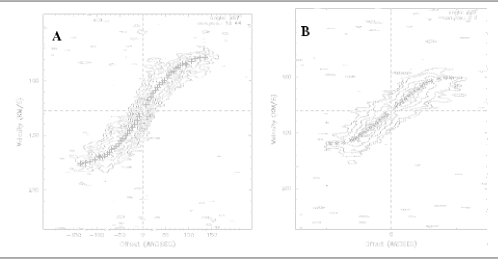
For each galaxy, the center and systemic velocity obtained from a global fit to the various resolution velocity fields matched within the error bars; the systemic velocity also matched with the values obtained from the global HI profiles. Keeping the center and systemic velocity fixed, we fitted for the inclination and position angle (PA) in each ring. For KK98 250, keeping inclination as a free parameter in the tilted ring fit gave unphysical results, hence, the kinematical inclination of the galaxy was fixed to the value estimated from the HI morphology, viz . Note that at such high inclination angles, the uncertainty in inclination has only a small effect on the derived rotation curve (Begeman 1989). For example, if we fix the inclination to , the derived rotation curve is the same, within the error bars. Fits for the position angle gave a value of (in good agreement with that derived from the optical image), with no systematic variation across the galaxy. The rotation curves (derived with the PA and inclination fixed to the values of and ) are shown in Fig. 5[A]. Note that the rotation curves derived from the different resolution velocity fields match within the errorbars, suggesting that, in spite of being highly inclined, the effects of beam smearing are not significant. The final adopted rotation curve is shown in Fig. 5[A] as a solid line.
For KK98 251, the inclination was found to be (which agrees with that derived from ellipse fitting to the HI morphology, see Sect. 3.1), with no systematic variation with the radius. The best fit position angle was at all radii, except in the outermost regions of the galaxy where it changes to . Ignoring this relatively small change, (which in any case has negligible effect on the derived velocities), the rotation curve was derived by keeping the inclination and PA fixed at and respectively. Fig. 6[A] shows the rotation curves for KK98 251, derived from the various resolution velocity fields. Note that all the rotation curves match within the errorbars. Recall that KK98 251 shows slight kinematical lopsidedness. Consistent with this, the rotation curve derived independently for the approaching and receding sides are slightly different, although the difference is everywhere less than 3.5 km s-1. For the purpose of mass modeling, we have used a mean of the rotation curves for the two sides. The errorbars on the mean rotation curve were obtained by adding quadratically the uncertainty reported by the tilted-ring fit as well as the difference in rotation velocities between the approaching and receding side.


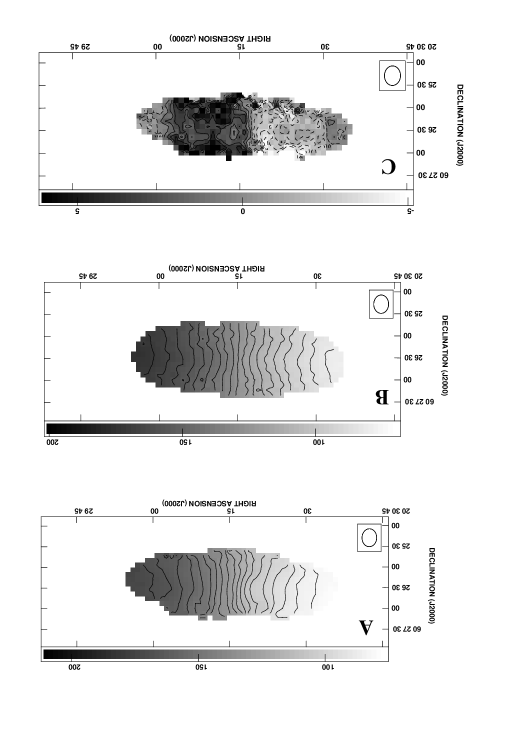
For highly inclined galaxies, rotation velocities derived from the titled ring fits to the velocity field could underestimate the true rotation velocities, hence in such cases the rotation curve is often estimated by fitting to the high velocity edge of the emission (e.g. Sancisi & Allen 1979). While this method is well suited to large galaxies with flat rotation curves, it is not appropriate for galaxies with solid body rotation. Both the velocity field of KK98 250 as well as the rotation curve derived from the tilted ring fit indicate solid body rotation, hence, instead of using the ‘edge fitting’ technique, the rotation curve for KK98 250 was derived by interactively fitting to the PV diagram, using the task INSPECTOR in GIPSY (see Fig 7[A]). The PA and the inclination in the interactive fitting were fixed to the values used in the tilted ring fit. The derived rotation curve matches, within the errorbars, to that derived from the tilted ring fit. As a further check of the robustness of the derived rotation curve, a model data cube for KK98 250 was constructed using the adopted rotation curve and the observed HI column density profile, with the task GALMOD in GIPSY. The model data cube was smoothed to a beam of 26 resolution and the moment maps were derived in the same manner as for the real data. Fig. 8[B] shows the derived model velocity field for KK98 250. A residual (data-model) velocity field is shown in Fig. 8[C]; as can be seen, the model velocity field provides a good match to the observed field.
Although KK98 251 is less inclined, a similar exercise of estimating the rotation velocities from the PV diagram was repeated for it. Fig 7[B] shows the adopted mean rotation curve projected onto the PV diagram – as can be seen, the mean rotation curve provides a reasonably good fit to the data. A model data cube for KK98 251 was also constructed using the derived rotation curve, in the same manner as for KK98 250. Again, a good match between the model (not shown) and the observed field was found.
The sensitivity of HI observations to the inner slope of the rotation curve has been the subject of much recent discussion (e.g. van den Bosch & Swaters, 2001). One possible way of overcoming the relatively poor resolution offered by HI observations is to instead use H observations. For KK98 250, an H based rotation curve has been derived by de Blok et al. (2001), and is shown with triangles in Fig. 5[B]. As can be seen, although the H curve is steeper than the HI curve at intermediate radii, in the innermost regions of the galaxy, (where the effects of beam smearing are expected to be most severe), the two rotation curves in fact show an excellent agreement.
As mentioned earlier, if one wishes to use the rotation curves to estimate the total dynamical mass, then one needs to account for the pressure support of the HI disk; this correction (generally called the “asymmetric drift” correction) is given by:
| (3) |
where is the corrected circular velocity, is the observed rotation velocity, is the velocity dispersion, and is the scale height of the disk. Strictly speaking, “asymmetric drift” corrections are applicable to collisionless stellar systems for which the magnitude of the random motions is much smaller than that of the rotation velocity. However, it is often used even for gaseous disks, where the assumption being made is that the pressure support can be approximated as the gas density times the square of the random velocity. The observed profile width can be used as an estimator of the velocity dispersion, after correcting for instrumental broadening and the finite size of the synthesized beam. This procedure doesn’t work for very inclined galaxies, so, as discussed in Sect. 2 for KK98 250 we assume a constant velocity dispersion of 8 km s-1. For KK98 251 we find that, after putting in these corrections, the estimated velocity dispersion is also km s-1. Further, in the absence of any measurement for , we assumed (i.e. that the scale height does not change with radius). Substituting these values back in the Eqn. (3) and using the fitted Gaussian profile to the radial surface density distribution, the “asymmetric drift” correction was calculated and applied to the observed rotation velocities. For KK98 250 this correction is found to be small (less than 2.5 km s-1), compared to the errorbars on the rotation curve. On the other hand, the correction for KK98 251 is significant in the outer regions. The “asymmetric drift” corrected curve for KK98 251 is shown in Fig. 6[B].
3.4 Mass Model

In this section, we use the “asymmetric drift” corrected rotation curves, derived in the last section, to derive mass models for KK98 250 and KK98 251.
The contribution of the stellar mass to the observed rotation curves were computed by assuming the galaxies to have exponential stellar disks, with a constant mass to light ratio () and an intrinsic thickness ratio (q0) of 0.2. We further assumed that the density distribution in the vertical () direction falls off like sech, with independent of galacto-centric radius (see e.g. van der Kruit & Searle 1981, de Grijs & Peletier 1997). The contribution of the gaseous disks to the observed rotation curves were calculated using the observed HI surface mass density profiles, with the HI surface density being scaled by a factor of 1.4 to account for the contribution from helium. There is little evidence that dwarf galaxies contain substantial amounts of molecular gas (e.g. Israel et al. (1995), Taylor et al. (1998)), hence, no correction was made for molecular gas. We also neglected the contribution of ionized gas, if any. Since there is some evidence for similar vertical distributions of the HI and stellar disks (e.g. Bottema et al. 1986), we assumed the HI disks also to have a sech vertical profile, with an intrinsic thickness ratio of . The circular velocities of the disk components were computed using the formulae given by Casertano (1983). For the dark matter halo, we considered two types of density profiles, viz. the modified isothermal profile and the NFW (Navarro et al. 1996) profile. For mass models using a modified isothermal halo, the free parameters are the halo central density , core radius rc and the mass to light ratio of the stellar disk, . For the NFW models, the free parameters are the halo concentration parameter c, (the circular velocity at the radius at which the halo density is 200 times the critical density) and the mass to light ratio of the stellar disk, . Mass model were fit using the GIPSY task ROTMAS.
| KK98 250 | KK98 251 | ||||||
|---|---|---|---|---|---|---|---|
| HI Curve | rc (kpc) | pc | rc (kpc) | pc | |||
| Best fit | 0.200.05 | ||||||
| Maximum disk | 3.0 | 1.0 | |||||
| From observed V-I | 0.7 | 0.5 | |||||
| Minimum disk | 0.0 | 0.0 | |||||
| Hybrid (HI+H) Curve | 0.2 | ||||||
| H Curve | 0.0 |
3.5 KK98 250
Since we could trace emission only from the brightest central regions of the galaxy in the I band, we use the more accurately determined V band scale length for the mass modeling. Fig. 9[A] shows the best fit mass models for KK98 250. The derived halo parameters are given in Table 2. For comparison, apart from the best fit mass model, the derived halo parameters are also given for the maximum disk, minimum disk and (which was obtained from the observed color V-I of using the low metallicity Bruzual Charlot SPS model using a modified Salpeter IMF; Bell de Jong 2001). The total dynamical mass of KK98 250, estimated from the last measured point of the rotation curve is –at this radius more than 92% of the mass of KK98 250 is dark.
For mass models with an NFW halo, keeping as a free parameter in the fit gave unphysical results. Even after setting , no reasonable fit could be obtained. As an illustration, Fig. 9[A] shows an NFW fit to the data, keeping the concentration parameters c fixed to 1, =0.0 and chosen to minimize . As can be seen, even at these extreme values for the parameters, the quality of fit is poor.
We also fit mass models to a hybrid rotation curve (see Fig. 5[B]), consisting of H data derived by de Blok et al. (2001) in the inner regions of the galaxy and the “asymmetric drift” corrected HI rotation curve in the outer regions. Again, keeping as a free parameter in the fit gave unphysical results, hence it was fixed to the value of 0.2, obtained from the best fit isothermal halo model, derived using the HI rotation curve alone. In any case, fixing to a common value allows a meaningful comparison of the halo parameters derived using both the rotation curves. The derived halo parameters for the isothermal halo are given in Table 2. The table also shows the isothermal halo parameters derived by de Blok et al. (2001) using only the H rotation curve. We note that apart from the (probably not physically meaningful) maximum disk case, the halo parameters derived from the HI rotation curve are in good agreement with one another, but that they are substantially different from the parameters derived from the Hybrid or H rotation curves. In this context it is worth repeating, that the discrepancy between the H rotation curve and the HI rotation curve is largest at intermediate radii, and not at small radii as one would have expected, if the HI rotation curve suffered from beam smearing.
Also shown in Fig. 9[B] is the , NFW halo fit to the Hybrid rotation curve. As can be seen, this fit overestimates the observed rotation velocity in the inner regions of the galaxy; fixing to more reasonable values worsens this discrepancy. The NFW halo parameters (corresponding to ) are c=6.5 and . The value of for the concentration parameter is much lower than the range of NFW concentration parameters predicted by LCDM simulations (Bullock et al. 2001). It is worth mentioning here that even for the H rotation curve alone, isothermal halos provide a substantially better fit than an NFW halo (de Blok et al. 2001).
3.6 KK98 251
As discussed in section 2.1 for KK98 251, we use the I band scale length derived by Karachentsev et al. (2000). For isothermal halo models, keeping as a free parameter in the fit gave negative values for . Further, if one keeps fixed, the continuously decreases as is decreased. Fig. 9[C] shows the best fit mass model for KK98 251 for a constant density halo using (which corresponds to the observed V-I color, from the low metallicity Bruzual Charlot SPS model using a modified Salpeter IMF). The derived halo parameters using various values of are given in Table 2. As can be seen from Table 2, the halo parameters are relatively insensitive to the assumed value of . The total dynamical mass (at the last measured point of the rotation curve) is =9.5. For KK98 251, we found that even for , with no value of c and could a good fit using an NFW halo be obtained. The best fit NFW model is also shown in Fig. 9[C]; as can be seen, the data deviate substantially from the model.

3.7 The Tully-Fisher relation
It has been recently suggested that dwarf galaxies deviate systematically from the Tully-Fisher (TF) relation defined by bright galaxies (i.e. Stil (1999), Swaters (1999), McGaugh et al. (2000)), with small galaxies being underluminous compared to what would be expected had they followed the same TF relation as galaxies. Contrary to this suggestion, Pierini & Tuffs (1999) found no evidence of any break in the near-IR TF relation for faint dwarf galaxies. The reason for this discrepancy is unclear. We note however that high resolution HI images are probably crucial in studies of the TF relation for very faint galaxies. This is because (i) the inclination may often be difficult to obtain from images of faint irregular galaxies, and (ii) the 50% HI velocity width may not be a good indicator of the rotation velocity in faint dwarf galaxies, where random motions are comparable to the peak rotational velocities (e.g. Camelopardalis B; Begum et al. (2003), DDO210; Begum & Chengalur (2004)). For such galaxies, it is important to accurately correct for the pressure support (“asymmetric drift” correction), which is possible only if one has high resolution HI images. Unfortunately, there are only few dwarf galaxies with both I band photometry and HI synthesis imaging available. Interestingly enough, even without this correction, (or even a correction for inclination), the HI velocity widths of dwarf galaxies with well measured distances do correlate with the absolute blue luminosity, albeit with large scatter (Huchtmeier et al. 2003). It is currently a matter of speculation as to whether the scatter would reduce significantly, once one puts in the corrections discussed above.
We show in Fig. 10, the TF relation for a sample of galaxies (with both HI synthesis imaging and I band photometry) spanning a range of I magnitude from 23.0 to 12.0. For the bright galaxies, the photometry and rotation velocities are from Verheijen (2001), while for the fainter galaxies, the I band magnitudes are from Patterson & Thuan (1996) and Makarova & Karachentsev (1998), while the rotation velocities were taken from Swaters (1999) and de Blok et al. (1996). The faintest two galaxies (Camelopardalis B and DDO210) are from our earlier work (Begum et al. 2003; Begum & Chengalur 2004). For Camelopardalis B, the I magnitude is calculated using the relation (BV)(VI)0.2 (Makarova & Karachentsev 1998). As can be seen from Fig. 10, faint dwarf galaxies do tend to lie systematically below the TF relation defined by bright galaxies (dotted line). This trend persists even if one excludes the most discrepant bright galaxy (U7094, which has a poor quality rotation curve) in determining the bright galaxy TF relation (dashed curve). Note also that the scatter in the TF relation increases at the faint end – this may be in part due to the uncertainty in the distances to the galaxies.
4 Conclusions
To conclude, we have presented high velocity resolution HI 21 cm synthesis images of the dwarf galaxies, KK98 250 and KK98 251, as well as optical broad band images of KK98 250. We find that the HI disks of the galaxies do not show any clear signs of tidal disturbance and that both galaxies have regular velocity fields, consistent with rigid body rotation. We fit the rotation curves with dark matter halo mass models and find that both rotation curves can be fit using modified isothermal halos but not with NFW halos. Finally, for a small sample of galaxies with both I band photometry and HI synthesis images, we find, in agreement with earlier studies (which used single dish HI data), that dwarf galaxies tend to lie below the I band TF relation defined by brighter galaxies.
Acknowledgements.
The HI observations presented in this paper would not have been possible without the many years of dedicated effort put in by the GMRT staff in order to build the telescope. The GMRT is operated by the National Centre for Radio Astrophysics of the Tata Institute of Fundamental Research. We thank the staff of IAO, Hanle and CREST, Hosakote, that made the optical observations possible. The facilities at IAO and CREST are operated by the Indian Institute of Astrophysics, Bangalore. We are also grateful to Dr Devendra Kumar Sahu invaluable help with the optical observations.References
- Begeman (1989) Begeman, K. G. 1989, A&A, 223, 47
- Begum & Chengalur (2004) Begum, A., & Chengalur, J. N. 2004, A&A, 413, 525
- Begum et al. (2003) Begum, A., Chengalur, J. N., & Hopp, U. 2003, New Astronomy, 8, 267
- Bender & Möllenhoff (1987) Bender, R., & Möllenhoff, C. 1987, A&A, 177, 71
- Bell & de Jong (2001) Bell, E. F., & de Jong, R. S. 2001, ApJ, 550, 212.
- Bottema et al. (1986) Bottema, R., Shostak, G. S., & van der Kruit, P. C. 1986, A&A, 167, 34.
- Bullock et al. (2001) Bullock, J. S., Kolatt, T. S., Sigad, Y. et al. 2001, MNRAS, 321, 559
- Casertano (1983) Casertano S. 1983, MNRAS, 203, 735.
- de Blok et al. (2001) de Blok, W. J. G., McGaugh, S. S., & Rubin, V. C. 2001, AJ, 122, 2396.
- de Blok et al. (1996) de Blok, W. J. G., McGaugh, S. S., & vander Hulst, J. M. 1996, MNRAS, 283, 15.
- de Grijs & Peletier (1997) de Grijs, R., & Peletier, R. F. 1997, A&A, 320, L21
- Huchtmeier et al. (2003) Huchtmeier, W. K., Karachentsev, I. D., & Karachentseva, V. E. 2003, A&A, 401, 483
- Huchtmeier et al. (2000) Huchtmeier, W. K., Karachentsev, I. D., Karachentseva, V. E., & Ehle, M. 2000, A&AS, 141,469
- Huchtmeier et al. (1997) Huchtmeier, W. K., Karachentsev, I. D., & Karachentseva, V. E. 1997, A&A, 322, 375
- Israel et al. (1995) Israel, F. P., Tacconi, L. J., & Bass, F. 1995, A&A, 295, 599.
- Karachnetsev et al (2000) Karachentsev, I. D., Sharina, M. E., & Huchtmeier, W. K. 2000, A&A, 362, 544
- Karachentseva & Karachentsev (1998) Karachentseva, V. E., & Karachentsev, I. D. 1998, A&AS, 127, 409
- Lake et al. (1990) Lake, G., Schommer, R. A., & van Gorkom, J. H. 1990, AJ, 99, 547
- Landolt (1983) Landolt A. U. 1983, AJ, 88, 439
- Makarova & Karachentsev (1998) Makarova, L. N., & Karachentsev, I. D. 1998, A&AS, 133, 181
- McGaugh et al. (2000) McGaugh, S. S., Schombert, J. M., Bothun, G. D., & de Blok, W. J. G. 2000, ApJL, 533, 99
- Navarro et al. (1996) Navarro, J. F., Frenk, C. S., & White S. D. M. 1996, ApJ, 462, 563.
- Patterson & Thuan (1996) Patterson, R. J., & Thuan, T. X. 1996, ApJS, 107, 103.
- Pierini & Tuffs (1999) Pierini, D., & Tuffs, R. J. 1999, A&A, 343, 751
- Pisano & Wilcots (2000) Pisano, D. J., & Wilcots, E. M. 2000, MNRAS, 319, 821
- Sancisi & Allen (1979) Sancisi, R., & Allen, R. J. 1979, A&A, 74, 73
- Schlegel et al. (1998) Schlegel, D. J., Finkbeiner, D. P., & Davis, M. 1998, ApJ, 500, 525
- Sharina et al. (1997) Sharina, M. E., Karachentsev, I. D., & Tikhonov, N. A. 1997, AstL, 23, 373.
- Skillman et al. (1988) Skillman, E. D., Terlevich, R., Teuben, P. J., & H. van Woerden. 1988, A&A, 198, 33.
- Swarup et al. (1991) Swarup, G., Ananthakrishnan, S., Kapahi, V. K., Rao, A. P., Subrahmanya, C. R., & Kulkarni, V. K. 1991, Current Science, 60, 95
- Stil (1999) Stil J.N. 1999, Ph.D. thesis, Rijksuniversiteit Leiden.
- Swaters (1999) Swaters, R. 1999, Ph.D. thesis, Rijksuniversiteit Groningen.
- Taylor et al. (1998) Taylor, C. L., Kobulnicky, H. A., & Skillman, E. D. 1998, AJ, 116, 2746
- van der Kruit & Searle (1981) van der Kruit, P.C., & Searle, L. 1981, A&A, 95, 105.
- van den Bosch & Swaters, (2001) van den Bosch & Swaters, R. 2001, MNRAS, 325, 1017
- Verheijen (2001) Verheijen, M.A.W. 2001, ApJ, 563, 694
- Warmels (1988) Warmels, R. H. 1988, A&AS, 72, 427
- Warner et al. (1973) Warner, P.J., Wright, M. C. H., & Baldwin, J. E. 1973, MNRAS, 163, 163
- Weldrake et al. (2003) Weldrake, D. T. F., de Blok, W. J. G., & Walter, F. 2003, MNRAS, 340, 12.