Spitzer-IRS mapping of the inner kpc of NGC 253: Spatial distribution of the [Ne iii], PAH 11.3 m and H2 (0-0) S(1) lines and a gradient in the [Ne iii]/[Ne ii] line ratio.
Abstract
We present our early results of the mapping of the nucleus of the starburst galaxy NGC 253 and its immediate surroundings using the Infrared Spectrograph 111The IRS was a collaborative venture between Cornell University and Ball Aerospace Corporation funded by NASA through the Jet Propulsion Laboratory and the Ames Research Center. onboard the Spitzer Space Telescope. The map is centered on the nucleus of the galaxy and spans the inner 800 688 pc2. The spatial distribution of the [Ne iii] line at 15.55 m and the polycyclic aromatic hydrocarbons feature at 11.3 m peaks at the center while the purely rotationnal transition of molecular hydrogen at 17.03 m is strong over several slit positions. We perform a brief investigation of the implications of these measurement on the properties of the star formation in this region using theories developped to explain the deficiency of massive stars in starbursts.
1 Introduction
NGC 253 is a well studied nearby starburst galaxy located at a distance of 2.5 Mpc (Pence, 1980) and is mainly powered by an episode of central star formation. This episode is generally believed to be caused by material brought to the center of the galaxy by a bar which is clearly visible in the 2MASS image (Jarrett et al., 2003). The presence of a bar from both morphological and kinematical evidence, and its role as starburst trigger has been extensively discussed in the literature (Das, Anantharamaiah, & Yun 2001 and references therein, Scoville et al. 1985, Engelbracht et al. 1998).
Four luminous super star clusters were discovered in the central region by Watson et al. (1996) with the Hubble Space Telescope. They derived a bolometric luminosity for the brightest cluster of 1.3 109L⊙ which corresponds to 10% of the luminosity of within a region of a radius of 15′′ at the nucleus. Also, observations of H emission and earlier Einstein and ROSAT x-ray data (see Ptak et al., 1997, and references therein) revealed a starburst-driven wind, emanating from the nucleus along the minor axis of the galaxy. This wind was well delineated by Chandra (Strickland, Heckman, Weaver, & Dahlem, 2000). Engelbracht et al. (1998) studied NGC 253 using near-infrared and mid-infrared lines and concluded that the properties of the Initial Mass Function (IMF) in the starbursting region is similar to a Miller-Scalo IMF that has a deficiency in low mass stars. Also, Boeker, Krabbe, & Storey (1998) and Keto et al. (1999) presented maps of [Ne ii] 12.81 m and PAH emission.
Observations in the mid-infrared from space by the Infrared Space Observatory (ISO) were used to identify fine structure lines, molecular hydrogen lines and emission from polycyclic aromatic hydrocarbons (PAH) (Sturm et al., 2000; Rigopoulou et al., 2002; Förster Schreiber et al., 2003; Verma et al., 2003). These authors mainly studied the nuclear region of the galaxy with the Short Wavelength Spectrograph (SWS) and ISOCAM. Rigopoulou et al. (2002) detected several mid-infrared H2 lines in the SWS spectrum of NGC 253. They derived an H2 (0–0) S(2)/S(1) temperature of 380 K with aperture sizes of 14′′20′′ and 14′′27′′ for S(2) and S(1) respectively. Thornley et al. (2000) measured the [Ne iii]/[Ne ii] line ratio using SWS and found a value of 0.06. Since the Ne atom and Ne+ ion have an ionisation potential of 21.56 and 40.95 eV respectively, this ratio traces the massive star content because it is very sensitive to the spectral shape of the UV radiation field. Thornley et al. (2000) addressed specifically this issue by modeling the neon ratio as a function of the upper mass cutoff. They used evolutionnary synthesis code an photoionisation code to predict the neon line ratio around a cluster of stars. Their results show that a [Ne iii]/[Ne ii] line ratio of 0.06 is consistent with an upper mass cutoff around 25 M⊙. However, they found that for short-lived bursts (1 Myr), the measured neon line ratio is consistent with the formation of massive (50100 M⊙) stars. Verma et al. (2003) also analyzed the SWS fine-structure line mainly in the context of gas-phase abundances. Their neon line fluxes indicate a slightly higher [Ne iii]/[Ne ii] line ratio of 0.08. They found a correlation between the neon ratio and metallicity among the SWS starburst sample but excitation for a given metallicity was relatively low compared to local H II regions. This problem with the deficiency of massive stars in starbursts was also found by Puxley et al. (1989) and Doyon, Joseph, & Wright (1994).
In this letter, we present spectral maps of [Ne iii], H2 (0–0) S(1) and the PAH feature at 11.3 m. The sensitivity and small aperture size of the IRS gives us the opportunity to do spatial mapping over small scales of the mid-infrared properties of the central region of NGC 253. A total of 45 positions were observed around the bright starburst seen at the center of the galaxy. These observations allowed us to build the map of the [Ne iii]/[Ne ii] line ratio where a spatial gradient is detected. The observations and data reduction are presented in § 2 and the maps are presented in § 3. The spatial differences in the different maps are briefly discussed in § 4.
2 Observations and data reduction
The observations were carried out during the science verification phase of the Infrared Spectrograph (IRS) onboard the Spitzer Space Telescope (Werner et al., 2004) using the Short-High (SH) module (Houck et al., 2004). The high sensivity and narrow slit sizes of the IRS were used to map of the central region of NGC 253. The spectra ranges from 10 to 20 m with a resolution . Although the observations of NGC 253 were non-contiguous on the sky, we have produced a ”sparsely sampled map” to trace the changes in warm gas and dust properties across the inner starburst. The map is centered at a position of RA 00h47m33.2s DEC -25∘17′19′′ (J2000) and the step between each pointing position is 15′′ along the length of the slit and 9′′ along its width.
The map, which consists of 45 different pointings, is centered on the nucleus of the galaxy and spans an area of 708 608 at a position angle of 271 degrees. This corresponds to the central 800 688 pc2 of the galaxy at the assumed distance of 2.5 Mpc. Each slit covers an area of 118 53 (133 60 pc). The exposure time for each slit position was 88 seconds.
The basic data reduction was performed by the standard IRS pipeline version 9.5 at the Spitzer Science Center (SSC). The pipeline removes detector artifacts and cosmic ray signatures and applies the dark and flatfield corrections (Spitzer Observer’s Manual222http://ssc.spitzer.caltech.edu/documents/som/, Chapter 7). Standard full-slit spectral extraction and flux calibration were performed as described in the SOM. The uncertainty in the line fluxes is dominated by the absolute flux calibration. At the present state, these uncertainties are on the order of 30%. Uncertainties on the absolute fluxes have little impact on the uncertainties of the relative fluxes. Line ratios are mostly affected by the determination of the continuum near the emission line. In our dataset, this source of error is below 5%.

The 12.8 m [Ne ii], 15.55 m [Ne iii] and the 17.03 m H2 (0–0) S(1) lines are detected with a signal to noise () higher than 3, our detection limit, on all the spectra. Line fluxes were measured by fitting a gaussian profile after substracting a second order baseline fit. Table 1 presents the values of the line fluxes for the central position of the map, which corresponds to the nuclear region of the galaxy. Figure 1 shows the spectrum at the central position and a typical off-center spectrum. The values measured for the central spectrum are shown in Table 1.
| Line | Rest wavelength (m) | Total Flux(10-20 W cm-2) |
|---|---|---|
| PAH | 11.3 | 22868 |
| PAH | 12.0 | 206 |
| H2 0-0 S(2) | 12.27 | 51 |
| PAH | 12.7 | 15948 |
| [Ne ii] | 12.81 | 14744 |
| [Ne iii] | 15.55 | 123 |
| PAH | 16.5 | 196 |
| H2 0-0 S(1) | 17.03 | 62 |
| [S iii] | 18.71 | 4012 |
3 Analysis
The [Ne iii] map (Figure 2) shows that the peak emission from this line is located at the center of the galaxy. Further out, the absolute line flux drops quickly. The same behavior is also seen with the PAH 11.3 m feature (Figure 3). However, the intensity of the H2 S(1) line is spatially distributed quite differently. We can see from Figure 4 that the overall intensity of the H2 (0–0) S(1) line follows the shape of the major axis of the emission seen in the 2MASS image.
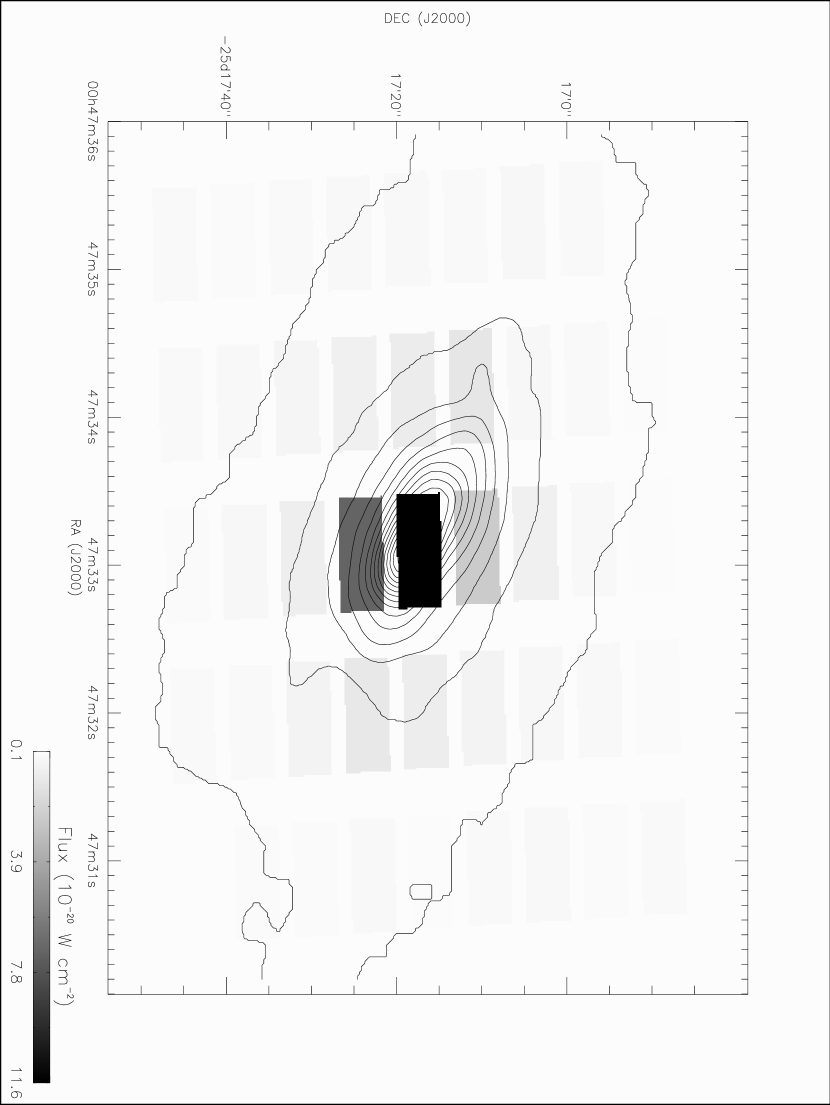
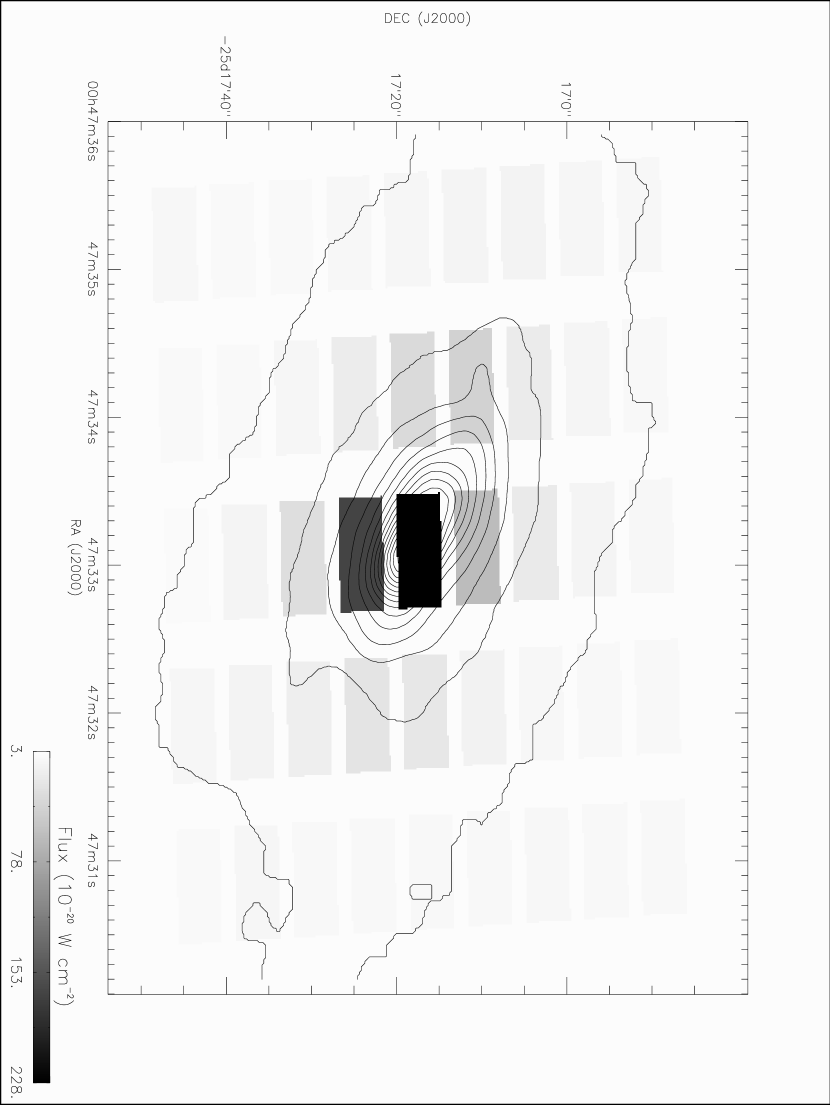
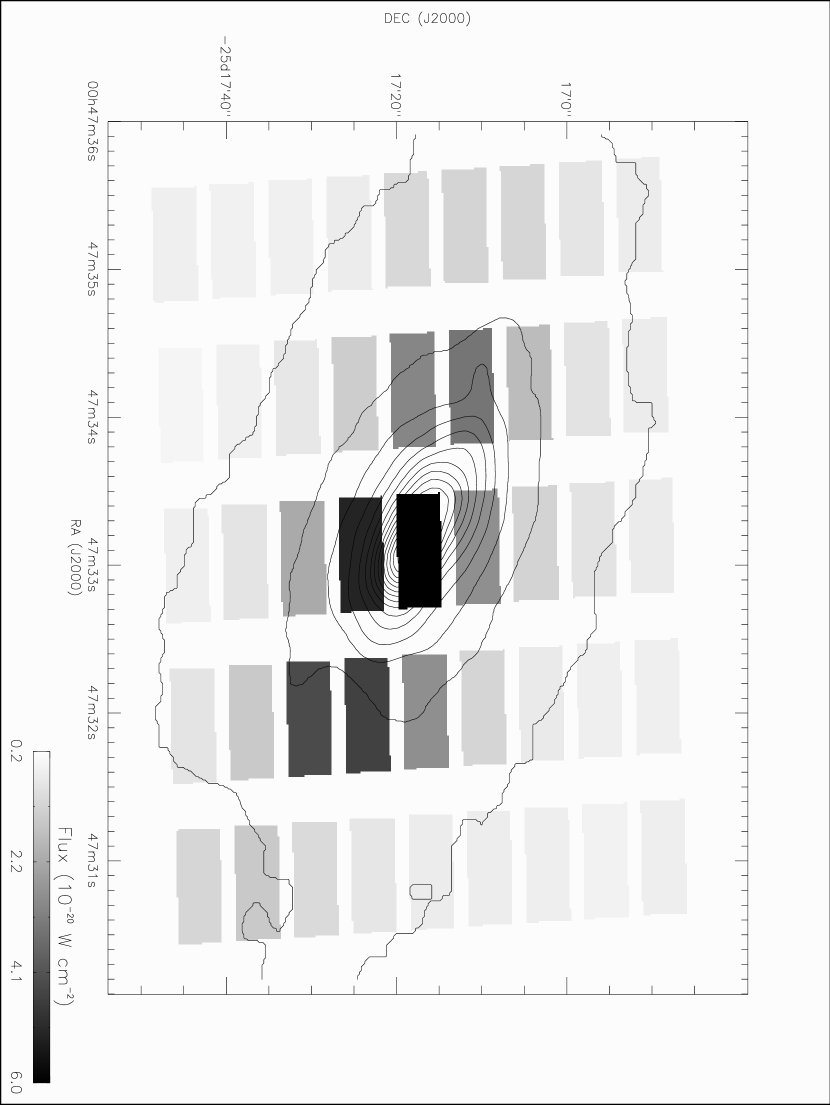
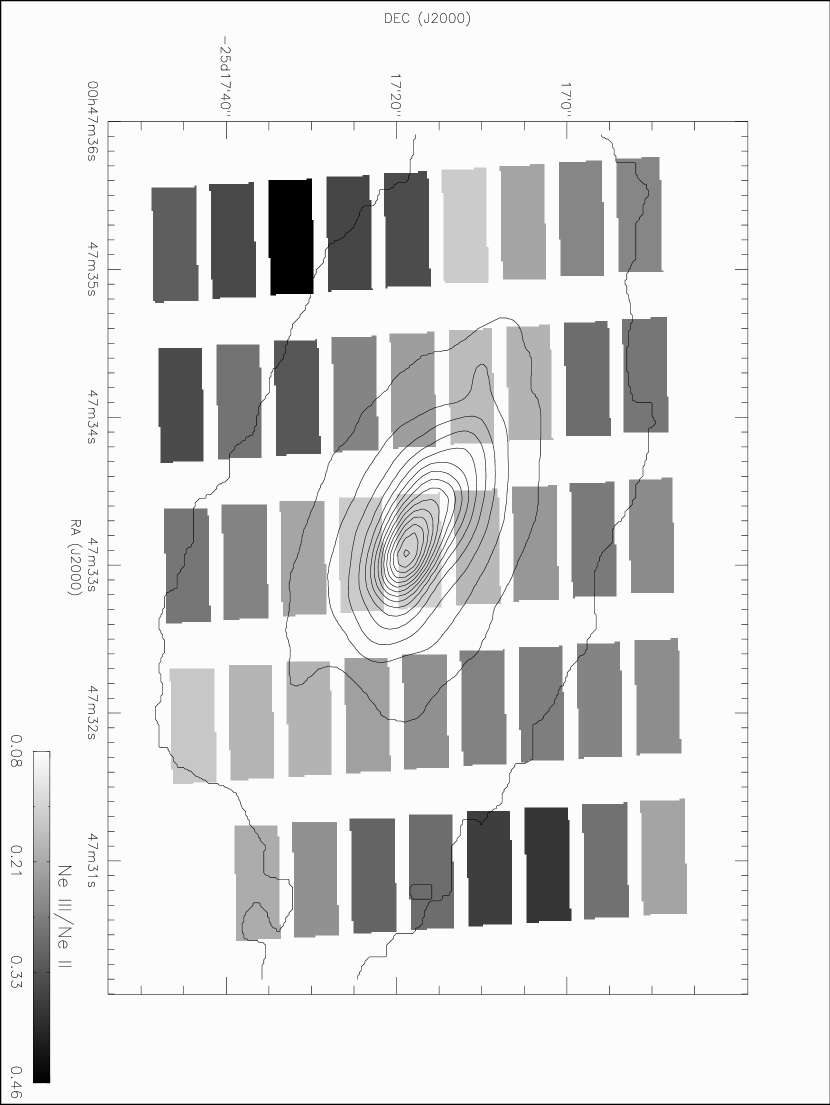
Figure 5 shows that the [Ne iii]/[Ne ii] line ratio increases by a factor 4–6 from the center of the map toward the edges. This increase is higher than our uncertainties on the relative fluxes (see section 2). The line ratio at the central pixel is 0.08, in agreement with what was found with ISO-SWS (Verma et al., 2003). The ratio peaks at 0.46 on the south-east edge of the map.
4 Discussion
4.1 Line fluxes
The [Ne iii] map shows that the strong neon emission is concentrated in the nucleus and decreases sharply outside that region. This behavior is also seen in the [Ne ii] line (not shown here). It is likely that the super star clusters found by Watson et al. (1996) are responsible for the major fraction of the high [Ne iii] flux. The PAH features also follow this trend. These are thought to be excited in star-forming environments where PAH emission arises predominantly in photodissociation regions at the interface between ionized and molecular gas (Verstraete et al., 1996; Cesarsky et al., 1996; Crété et al., 1999).
The map of Figure 4 shows a clear correlation between the H2 (0–0) S(1) line and the major axis of the emission seen in the 2MASS image. This correlation is also seen in the H2 (0–0) S(2) line (not shown here) and indicates that an excitation source is located along the major axis and rises the H2 temperature enough to sustain an elevated emission of the 17.03 m and the 12.27 m lines. The purely rotational transitions of molecular hydrogen can be triggered either by radiation or shocks (Burton, Hollenbach, & Tielens, 1992). In dense ( cm-3) photodissociation regions, UV photons from massive stars can produce enough energy to raise the temperature of the H2 gas so that collisional excitation lines are seen. The molecular gas can also be excited by x-rays (Rigopoulou et al., 2002) or cosmic rays (Bradford et al., 2003). The fact that the H2 S(1) line and the PAH 11.3 m line don’t trace each other may be indicative that different mechanism maybe at work at the central position and along the major axis.
4.2 Spatial variation of the ionization field
The observed increase of the [Ne iii]/[Ne ii] line ratio (Figure 5) implies a harder ionization field outside of the nuclear region of NGC 253. To first order, this means that the radiation field outside the nucleus is harder than away from the nucleus. In this section, we breifly review the various physical conditions that may lead to an increase of the value of the neon line ratio. We discuss the impact of a metallicity gradient, a modified IMF, and an age gradient on the physical properties of the nuclear region of NGC 253.
Martín-Hernández et al. (2002) showed that decreasing metallicity leads to a hardening of the ionization field since it affects the line blanketing and the characteristics of the stellar wind. However, a large gradient is needed to account for the observed change. The data of Martín-Hernández et al. (2002) show that in order to triple the neon line ratio, a change in metallicity close to 1 Z⊙ is required. The maps presented here only cover a radius of 0.5 kpc so the implied metallicity gradient needed to reproduce the data is on the order of 2 Z⊙kpc-1.
Several authors (Puxley et al., 1989; Doyon, Joseph, & Wright, 1994; Engelbracht et al., 1998; Doherty, Puxley, Lumsden, & Doyon, 1995; Achtermann & Lacy, 1995; Beck, Kelly, & Lacy, 1997) proposed a truncated or steeper IMF to explain the deficiency of massive stars in starburst galaxies. This would imply that the properties of the IMF would change from the nucleus to the outer disk. However, the gradient would imply variations in the IMF only if the stellar populations in the different regions were nearly the same ages.
The analysis of Thornley et al. (2000) showed that ageing can cause a softening of the ionization field where a starburst occurs. They pointed out that the observed properties of short-lived starbursts are very sensitive to the massive star content within the first 10 million years of a star formation episode. This means that the hardness of the radiation field, and thus the [Ne iii]/[Ne ii] ratio, should decay rapidly if the starburst episode responsible for the ionisation field is short-lived. Using this model, our results would indicate that the outside regions are, on average, younger than the nuclear region, consistent with star formation propagating outward.
5 Conclusions
We present spectral line maps of [Ne iii], H2 (0–0) S(1) , PAH 11.3 m feature as well as the [Ne iii]/[Ne ii] ratio and the warm molecular hydrogen temperature of the central region of NGC 253 and its immediate surroundings. The strength of the H2 lines follows the morphology of the major axis while the [Ne iii] line and the PAH 11.3 m feature peak at the location of the nucleus and show no strong correlation with the major axis, suggesting different physical mechanism in and outside the nuclear region for the PAHs and neon on one side and the molecular hydrogen on the other.
A significant gradient in the [Ne iii]/[Ne ii] ratio is detected. The ratio rises toward the edges of the map with the lowest value being at the location of the nucleus. To first order, this indicates that the radiation field is harder outside the nucleus which in turn suggests that there is a relative deficiency of massive stars in the nucleus of the galaxy. With our dataset, we were able to briefly explore the variation of the ionisation field within a single starburst galaxy and compare it with models that are usually compared to the ionisation fields of a sample of starburst galaxies. The spectral-mapping capability of the IRS allows detailed studies of the local environment of powerful starbursts and provide unprecedented insight into the star formation process in starbursts. We presented here a small sample of our dataset. A more detailled study on the impact of our observations on the physical properties of the central region of NGC 253 and the stellar population is in preparation.
References
- Achtermann & Lacy (1995) Achtermann, J. M. & Lacy, J. H. 1995, ApJ, 439, 163
- Beck, Kelly, & Lacy (1997) Beck, S. C., Kelly, D. M., & Lacy, J. H. 1997, AJ, 114, 585
- Bradford et al. (2003) Bradford, C. M., Nikola, T., Stacey, G. J., Bolatto, A. D., Jackson, J. M., Savage, M. L., Davidson, J. A., & Higdon, S. J. 2003, ApJ, 586, 891
- Burton, Hollenbach, & Tielens (1992) Burton, M. G., Hollenbach, D. J., & Tielens, A. G. G. 1992, ApJ, 399, 563
- Boeker, Krabbe, & Storey (1998) Boeker, T., Krabbe, A., & Storey, J. W. V. 1998, ApJ, 498, L115
- Cesarsky et al. (1996) Cesarsky, D., Lequeux, J., Abergel, A., Perault, M., Palazzi, E., Madden, S., & Tran, D. 1996, A&A, 315, L305
- Crété et al. (1999) Crété, E., Giard, M., Joblin, C., Vauglin, I., Léger, A., & Rouan, D. 1999, A&A, 352, 277
- Das, Anantharamaiah, & Yun (2001) Das, M., Anantharamaiah, K. R., & Yun, M. S. 2001, ApJ, 549, 896
- Doherty, Puxley, Lumsden, & Doyon (1995) Doherty, R. M., Puxley, P. J., Lumsden, S. L., & Doyon, R. 1995, MNRAS, 277, 577
- Doyon, Joseph, & Wright (1994) Doyon, R., Joseph, R. D., & Wright, G. S. 1994, ApJ, 421, 101
- Engelbracht et al. (1998) Engelbracht, C. W., Rieke, M. J., Rieke, G. H., Kelly, D. M., & Achtermann, J. M. 1998, ApJ, 505, 639
- Förster Schreiber et al. (2003) Förster Schreiber, N. M., Sauvage, M., Charmandaris, V., Laurent, O., Gallais, P., Mirabel, I. F., & Vigroux, L. 2003, A&A, 399, 833
- Houck et al. (2004) Houck, J. R., et al. 2004, ApJS, this volume
- Jarrett et al. (2003) Jarrett, T. H., Chester, T., Cutri, R., Schneider, S. E., & Huchra, J. P. 2003, AJ, 125, 525
- Keto et al. (1999) Keto, E., Hora, J. L., Fazio, G. G., Hoffmann, W., & Deutsch, L. 1999, ApJ, 518, 183
- Martín-Hernández et al. (2002) Martín-Hernández, N. L., Vermeij, R., Tielens, A. G. G. M., van der Hulst, J. M., & Peeters, E. 2002, A&A, 389, 286
- Pence (1980) Pence, W. D. 1980, ApJ, 239, 54
- Pence (1981) Pence, W. D. 1981, ApJ, 247, 473
- Ptak et al. (1997) Ptak, A., Serlemitsos, P., Yaqoob, T., Mushotzky, R., & Tsuru, T. 1997, AJ, 113, 1286
- Puxley et al. (1989) Puxley, P. J., Brand, P. W. J. L., Moore, T. J. T., Mountain, C. M., Nakai, N., & Yamashita, T. 1989, ApJ, 345, 163
- Rigopoulou et al. (2002) Rigopoulou, D., Kunze, D., Lutz, D., Genzel, R., & Moorwood, A. F. M. 2002, A&A, 389, 374
- Scoville et al. (1985) Scoville, N. Z., Soifer, B. T., Neugebauer, G., Matthews, K., Young, J. S., & Yerka, J. 1985, ApJ, 289, 129
- Strickland, Heckman, Weaver, & Dahlem (2000) Strickland, D. K., Heckman, T. M., Weaver, K. A., & Dahlem, M. 2000, AJ, 120, 2965
- Sturm et al. (2000) Sturm, E., Lutz, D., Tran, D., Feuchtgruber, H., Genzel, R., Kunze, D., Moorwood, A. F. M., & Thornley, M. D. 2000, A&A, 358, 481
- Thornley et al. (2000) Thornley, M. D., Schreiber, N. M. F., Lutz, D., Genzel, R., Spoon, H. W. W., Kunze, D., & Sternberg, A. 2000, ApJ, 539, 641
- Verma et al. (2003) Verma, A., Lutz, D., Sturm, E., Sternberg, A., Genzel, R., & Vacca, W. 2003, A&A, 403, 829
- Verstraete et al. (1996) Verstraete, L., Puget, J. L., Falgarone, E., Drapatz, S., Wright, C. M., & Timmermann, R. 1996, A&A, 315, L337
- Watson et al. (1996) Watson, A. M. et al. 1996, AJ, 112, 534
- Werner et al. (2004) Werner, M. et al 2004 ApJS, this volume)