Hot Gas Structure in the Elliptical Galaxy NGC 4472
Abstract
We present X-ray spectroscopic and morphological analyses using Chandra ACIS and ROSAT observations of the giant elliptical galaxy NGC 4472 in the Virgo cluster. We discuss previously unobserved X-ray structures within the extended galactic corona. In the inner of the galaxy, we find X-ray holes or cavities with radii of 2 kpc, corresponding to the position of radio lobes. These holes were produced during a period of nuclear activity that began years ago and may be ongoing. We also find an asymmetrical edge in the galaxy X-ray emission (14 kpc) northeast of the core and an tail (36 kpc) extending southwest of the galaxy. These two features probably result from the interaction of NGC 4472 gas with the Virgo gas, which produces compression in the direction of NGC 4472’s infall and an extended tail from ram pressure stripping. Assuming the tail is in pressure equilibrium with the surrounding gas, we compute its angle to our line of sight and estimate that its true extent exceeds 100 kpc. Finally, in addition to emission from the nucleus (first detected by Soldatenkov, Vikhlinin & Pavlinsky), we detect two small extended sources within of the nucleus of the galaxy, both of which have luminosities of ergs s-1.
1 Introduction
Significant emission from 1 keV thermal plasma coronae is common in luminous elliptical galaxies. This coronal gas was first detected with the Einstein observatory (Forman, Jones, Tucker, 1985). Later, BBXRT, ROSAT, and ASCA (eg. Serlemitsos et al. (1993); Forman et al. (1993); Irwin Sarazin (1996); Matsumoto et al. (1997); Finoguenov Jones (2000)) provided improved measurements of the temperature structure and the first information on heavy element abundances in the gas.
The morphologies of these hot coronae in bright ellipticals differ greatly from the stellar morphologies. While the stellar luminosity in bright ellipticals generally follows a symmetric de Vaucouleurs profile, the X-ray emission is often quite asymmetrical and varies in structure from galaxy to galaxy. Typical structures include X-ray cavities generally corresponding to radio lobes e.g. M84 (Finoguenov Jones, 2001)), sharp edges in brightness e.g. N507 (Kraft et al., 2003a) and NGC 1404 (Dosaj et al., 2002)) , a disk in NGC 1700 (Statler & McNamara, 2002), extended bright “arms” (as in NGC 4636 Jones et al. (2001)), and the very extended tail seen in M86 (Forman et al., 2001). Since these structures owe their origins primarily to either nuclear outbursts or interactions with other galaxies or the surrounding cluster gas, X-ray observations provide a unique opportunity to study both the histories of bright cluster elliptical galaxies and their interactions with their environment.
Coronal gas structures can be divided into two primary categories: 1) those produced by internal processes and 2) those produced by galaxy-galaxy and galaxy-cluster interactions. Nuclear outbursts are the primary internal stimuli that shape the X-ray coronae of many elliptical galaxies. During periods of nuclear activity, relativistic jets can inject ergs into the hot ISM, producing buoyant radio-emitting lobes. As they form and rise, these lobes expand, thus both evacuating and compressing the surrounding X-ray gas, resulting in bright-rimmed X-ray cavities coincident with the radio lobes. Such cavities associated with radio sources have been observed in M84 (Finoguenov Jones, 2001), in NGC 1275 (Fabian et al., 2003; Böhringer et al., 1993), and in the central cD galaxy of the clusters Hydra A (McNamara et al., 2000), Abell 2052 (Blanton et al., 2001), and Abell 478 (Sun et al., 2003). Similar X-ray cavities without corresponding radio sources have also been observed in NGC 4636 (Jones et al., 2001) and in the central galaxies of Abell 2597 (McNamara et al., 2001) and Abell 4059 (Heinz et al., 2002). These “ghost” cavities suggest that X-ray cavities persist even after the corresponding radio lobes are too faint to be detected. Calculating ages for X-ray cavities/radio lobes from the buoyant rise time provides valuable information about the nuclear outburst histories of bright elliptical galaxies (Ensslin Heinz, 2002).
The interaction of bright elliptical galaxies with other galaxies and the cluster medium shapes other structures within the coronal gas. Interactions mold galactic gas in two ways – 1) through ram pressure as the galaxy passes through a gas-rich medium or 2) through gravitational tidal forces. Ram pressure stripping can occur both as a galaxy passes through cluster gas and during galaxy-galaxy interactions (e.g. Nulsen 1982 (Elmegreen et al., 2000; Forman et al., 2001). Typically, ram pressure produces compression of the gas (and corresponding steep changes in X-ray brightness by a factor of 2-10 – see Finoguenov Jones (2001) and Machecek et al. (2004)) in the direction of motion and elongation of the corona in the direction opposite the motion. This creates an overall “cometary” profile in the galaxy gas. Tidal forces due to gravity also can produce elongations and sharp edges (Borgani, private communication). In the case of galaxy-galaxy interactions, these structures trace the merger history of the galaxies.
Coronal gas was first observed in the giant elliptical NGC 4472 with Einstein (Forman, Jones, Tucker, 1985; Thomas, 1986). With ROSAT, Forman et al. (1993) measured the radial profile of the gas temperature and iron abundance, while Irwin Sarazin (1996) observed an elongation towards the SW and a compression to the NE. Irwin Sarazin (1996) attributed these structures in the gas to ram pressure from NGC 4472’s passage through the Virgo ICM. Recently, Soldatenkov, Vikhlinin & Pavlinsky (2003) reported detection of the nucleus of NGC4472 in X-rays and showed that this emission is soft. In this paper, we report on previously unresolved structure within the galaxy’s coronal gas. In addition to features related to those reported by Irwin Sarazin (1996), we find X-ray cavities associated with radio lobes within the inner of the galaxy and two luminous ( ergs s-1) extended sources near the nucleus of the galaxy.
This article explores the roles of nuclear outbursts, tidal deformation, and ram-pressure in forming structures in the X-ray coronal gas of NGC 4472. In §2, the X-ray analysis is described. The overall morphology of NGC 4472 is explored in §3. We discuss structures produced by nuclear outbursts in §4. Structures resulting from ram pressure and/or tidal deformation are discussed in §5. The two small extended sources found within of the nucleus and the nuclear emission itself are discussed in §6. Summary and conclusions are provided in §7.
2 Analysis of X-Ray Observations
NGC 4472 was observed for 41.6 ksec on 2000 June 12 with the ACIS S-array in very faint (vf) timed exposure mode (accepting ASCA grades 0,2,3,4, and 6). The S1-S4 and I2-I3 CCDs were operated at a focal plane temperature of -120 C and with a frame time of 3.214 s. The Chandra pointing placed the center of the galaxy on the S3 CCD. We extracted useful NGC4472 data from the S2 and S3 CCDs. We used data from the S1 and I2 CCDs for background determination. At this time in the Chandra mission, the contamination on the ACIS filter (resulting in decreased low energy efficiency) was fairly modest.
We time filtered the S2 and S3 CCDs independently for background flares following the procedures from Markevitch (2000). Lightcurves were created with a binsize of 259.28 s (this corresponds to 80 3.214 s frames) using the lc_clean software. We found a mean count rate of 0.175 cts/s in the energy band from 0.3-10 keV and excluded 1987 s for S2 (when cts/s were above the mean count rate). A total clean exposure time on S2 of 40.2 ksec was retained. Since the large angular extent of the galaxy made background light curve determination difficult for the back-illuminated S3 CCD, we derived background light curves from the back-illuminated S1 CCD. The S1 CCD possesses a response similar to that of the S3 CCD. For S1, we found a mean count rate of 1.748 cts/s in the energy band from 0.3-10 keV and excluded 7428 s due to high background intervals, leaving a total clean exposure time of 34.7 ksec on S3. Bright columns and pixels due to instrumental effects or cosmic ray afterglows also were removed.
Since we are interested in the diffuse gas emission from NGC 4472, we identified and excluded regions around 214 point source candidates with 3 or more counts in the 0.5-2 keV energy band. Point source candidates were identified by performing a wavelet deconvolution on the data. We also created and examined a hard image in the 2-5 keV band to detect any highly absorbed sources. No such sources were found.
3 Overall Morphological Features
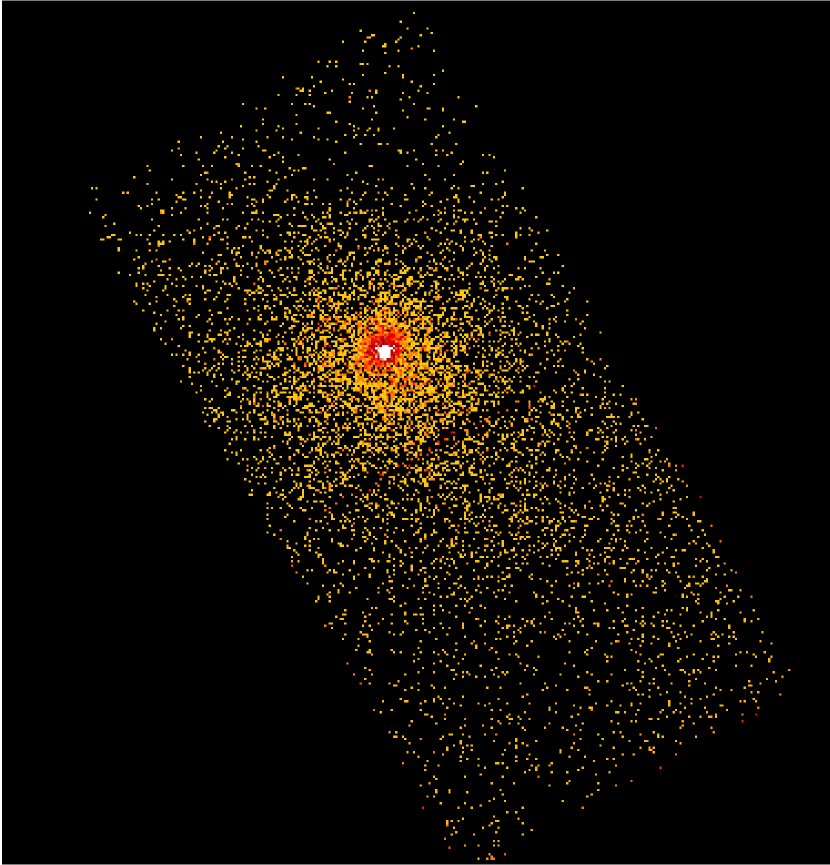
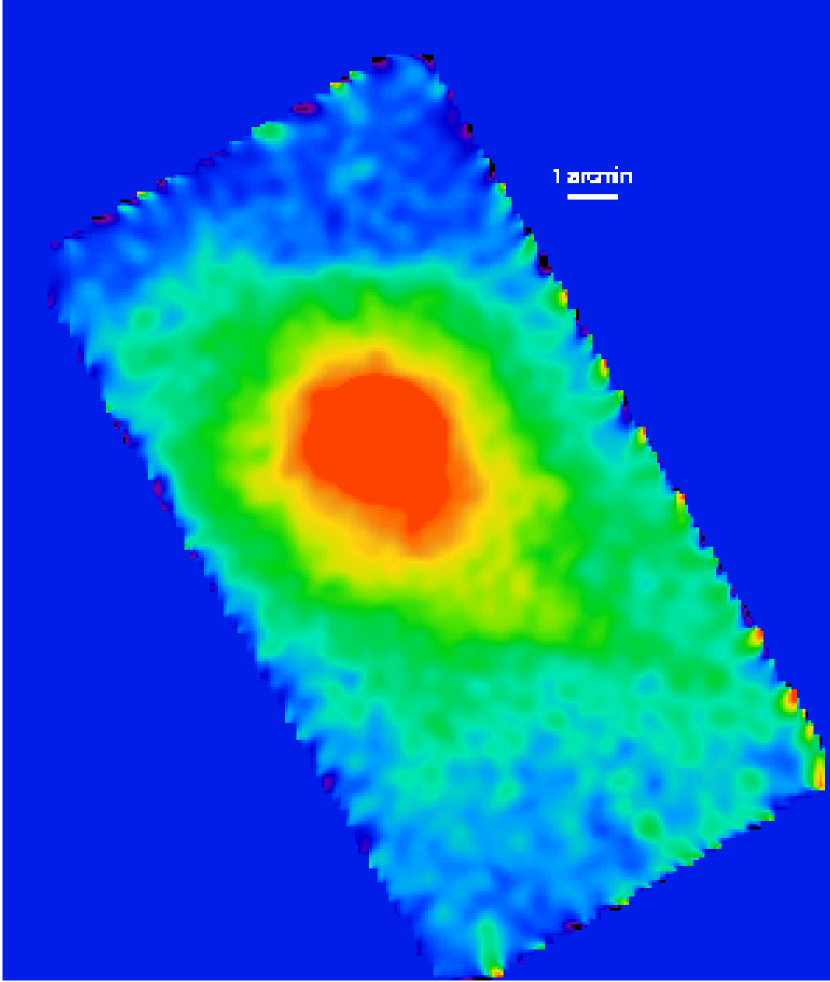
Fig. 1 shows NGC 4472 on the S2 and S3 CCDs in the energy range 0.7-2 keV. This image was produced from the “cleaned” events, with a binning factor of 2 (1 binned pixel is 20.492 arcsec). A background subtracted, exposure map corrected image is presented in Fig. 2. This image has been smoothed on a length scale of 5 pixels. At the distance of NGC 4472 (16 Mpc – Tonry et al. (2001)), each arcmin corresponds to a linear size of 4.65 kpc.
We characterize the gas morphology into four primary features. A bright, symmetric central region dominates the emission. Within the inner (9.3 kpc) of this region are radio lobes corresponding to X-ray cavities (see §4). On larger scales, a drop in surface brightness is apparent towards the northeast, three arcminutes (14 kpc) north of the nucleus. Finally, southwest of the nucleus, a tail of emission stretches nearly (37 kpc) from the nucleus and becomes as narrow as 10′′ (775 pc). (See §5) The hot coronal gas in NGC 4472 is actively being sculpted by both internal (nuclear outbursts) and external (interaction with Virgo cluster gas) processes.
4 X-Ray Structure Related to Radio Lobes
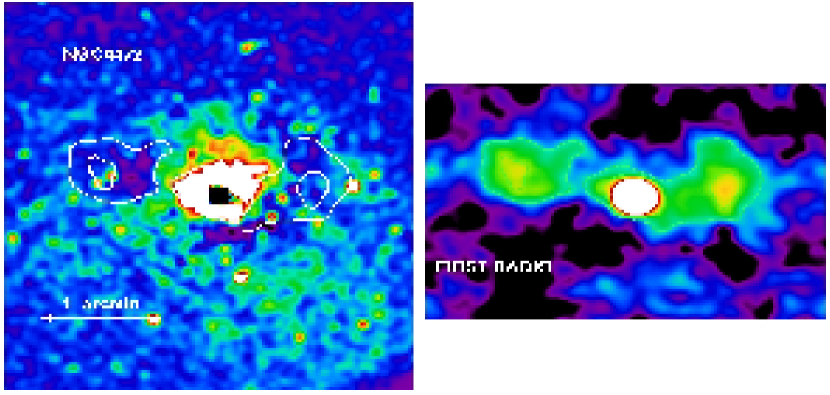
NGC 4472 possesses weak radio lobes from an episode of nuclear activity that is possibly still ongoing. A FIRST radio image (Becker et al., 2003) of the inner two arcmin is shown in Fig. 3. The corresponding Chandra X-ray image (with a smoothed radial profile of the inner region subtracted to enhance the asymmetric emission) is also presented in Fig. 3 and shows depletion or “holes” in the X-ray emission at the positions of the radio lobes. Emission in the X-ray holes is depleted by 95 relative to X-ray emission at a similar radius from the nucleus.
We performed spectral fits in XSPEC for the lobe regions shown in Fig. 3 and also for an elliptical annulus (400 pc) in width framing each lobe region. Since the holes are substantially depleted of X-ray gas, spectra of the lobe regions measure primarily the overlying gas. ACIS sky backgrounds (Markevitch, 2000) were subtracted from the spectra. A mekal model with a constant neutral hydrogen column density of 1.71020 cm-2 (Dickey Lockman, 1990) was fit in the 0.5-7 keV band. We found a temperature of keV for lobe 1 (east and to the left in Fig. 3) and and a similar temperature of keV for lobe 2 (west and to the right in Fig. 3). (Errors correspond to 90 uncertainties.) The gas temperature dropped slightly to keV in a elliptical annulus outside the eastern lobe and rose slightly in a similar annulus outside the western lobe to 0.86 keV. Hence, we see no evidence for significant shock heating along the edges of the lobes.
Assuming the lobes lie in the plane of the sky, we estimate a minimum energy and age for the two X-ray cavities/radio lobes. The lower bound on energy is simply the mechanical energy necessary to evacuate the X-ray gas from the cavity and is estimated from the pressure of the surrounding gas and the volume of each cavity. Parameters for each lobe are given in Table 1. The initial electron density (ne) was taken from our model fit to the surface brightness at the projected radius of the lobe (see §5.1), kT from our temperature fits for each lobe, and the volume (V) from the lobe size. Lobes were considered ellipsoids – the radius along the line of sight was modeled as the apparent semi-minor axis of the elliptical spectral extraction region on the sky. Estimating a distance from the nucleus of 3.6 kpc and a sound speed of 300 km s-1 (appropriate for a 0.8 keV gas), and assuming a buoyant lobe moves nearly at the sound speed, the lobes were produced by a nuclear outburst that began at least 1.2107 years ago. We also utilized code from Ensslin Heinz (2002) to model the rise velocity as the lobe buoyantly rises through the halo gas. We find a lobe velocity from these models of 320 km s-1, approximately the sound speed.
With a mechanical evacuation energy of 1054 erg ( from Table 1), since the lobes likely contain relativistic plasma, we can estimate the enthalpy of the lobes as , or about erg (Birzan et al., 2004). Thus, the energy in the X-ray cavities in NGC 4472 is small compared to those in other galaxies, which possess energy outputs of up to 1061 ergs (McNamara et al., 2001). While the energy in the lobes is sufficient to evacuate a cavity in the X-ray gas, it does not produce bright rims, as seen in other systems.
| Lobe | ne (cm-3)∗ | kT (keV)∗ | V (kpc3) | E (1053ergs) |
|---|---|---|---|---|
| East | 0.059 | 0.82 | 23 | 5.2 |
| West | 0.080 | 0.76 | 27 | 7.9 |
∗ ambient gas density and pressure
5 Large Scale Structures in the X-ray Coronal Gas
5.1 Analysis of Temperature Structure and Morphology
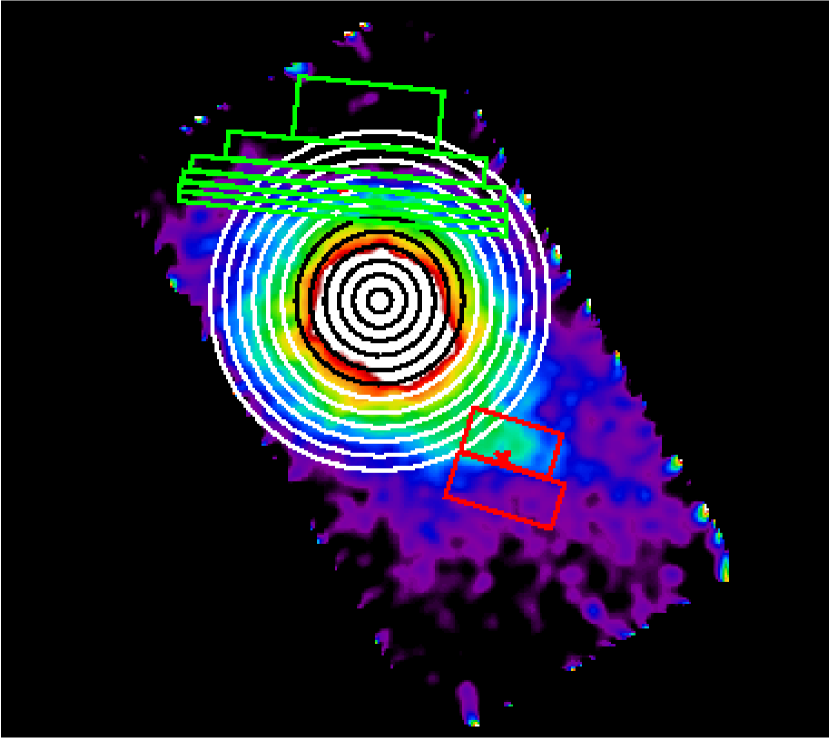
We investigated the temperature structure in the central region, across the northern edge, and in the tail. In the central region, spectra were extracted for ten annular regions to a (19 kpc) radius from the nucleus. An image with these spectral extraction regions overlaid is shown in Fig. 4. We subtracted ACIS sky backgrounds (Markevitch, 2000) from our spectra. Spectra were fit in the 0.7-2 keV band using a mekal model in XSPEC. Spectra were extracted on the S3 CCD only – sections of each annulus outside S3 were excluded. The neutral hydrogen column density was fixed at 1.71020 cm-2 (Dickey Lockman, 1990). We find that the temperature increases monotonically from 0.80.05 keV to 1.10.05 keV radially outward to 10 kpc, then rises by 20 to 1.20.1 keV from 10-12 kpc, and returns to 1.10.05 keV at radii greater than 12 kpc. The 10 kpc temperature jump coincides with the bright NE edge and is also apparent in spectra extracted along this edge (Fig. 7 – see below for details.)
After applying an exposure map correction, subtracting background counts, and excluding point sources (as well as the extended central sources, see §6) we also measured the surface brightness distribution in 22 annuli covering the same (19 kpc) radius region. The surface brightness distribution is strongly peaked around the nucleus of the galaxy and decreases with radius. An increase in surface brightness as observed here, along with a decrease in temperature, is consistent with a cooling flow. We fit a model to our surface brightness profile and found = 0.4400.001 and a core radius a = 0.2800.001 kpc. Density and pressure were derived from this model and also are plotted as a function of radius in Fig. 6. Adopting a central temperature of 0.8 keV and a central density of 0.03 cm-3 from our model fit, we calculated a cooling time at the galactic center of 0.9 Gyr, consistent with a cooling flow.
Although the northeast edge shows a drop in surface brightness by an order of magnitude, this is not apparent in an azimuthally averaged radial surface brightness profile. To directly investigate this surface brightness drop, we considered both temperature and surface brightness locally along the NE edge. Surface brightnesses were calculated in a 50∘ wide wedge centered on the northern edge after an exposure map correction had been applied. This surface brightness profile is presented in Fig. 8. The surface brightness decreases by an order of magnitude over a length of (3.9 kpc). Beyond (7.8 kpc) of the edge, hot cluster gas dominates over the galactic gas.
In order to examine the temperature structure of the NE edge, we extracted spectra for a series of rectangular slices with long sides aligned parallel to the edge. Slices were chosen to contain at least 1000 source counts. An image with these spectral extraction regions overlaid for the NE edge is shown in Fig. 4. Along the NE edge, emission from Virgo cluster gas comprises a significant portion (up to 20) of the total emission. We fit a mekal model to the cluster gas far from the galaxy (using the I2 CCD) and found a temperature of 2.2 keV. We used this cluster model as a second mekal model in fitting our NE edge spectra. Spectral fits were performed in XSPEC in the 0.7-2 keV band. A temperature profile for the NE edge is plotted in Fig. 7. For the NE edge, the temperature increases from 1.10.1 to 1.40.1 keV towards the north.
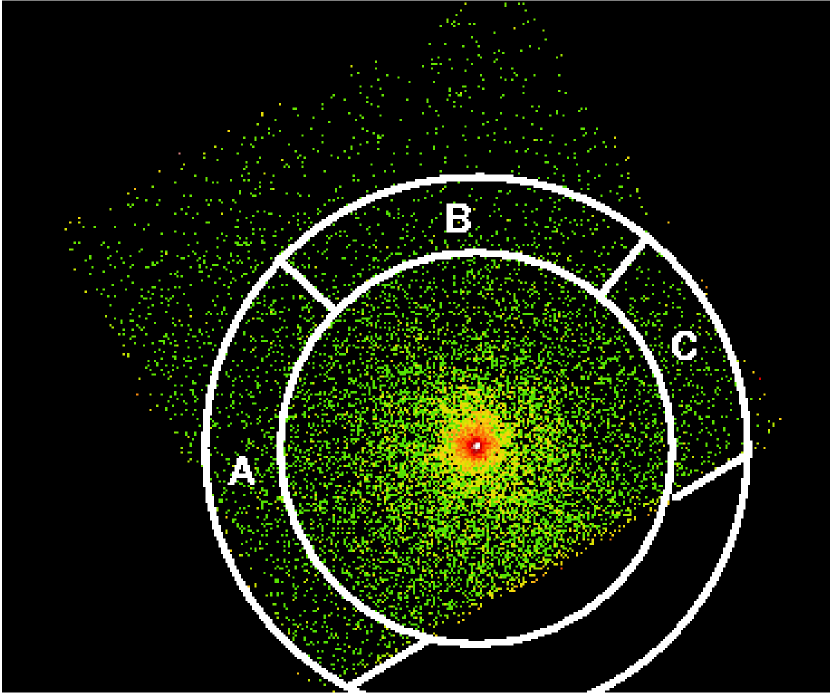
To determine the extent of the hotter emission along the northern edge of the galaxy, we fit three wedges displayed in Fig. 5 (labeled A, B, and C). Each wedge had an inner radius of (13 kpc) and an outer radius of (19 kpc) arcmin from the nucleus. We find temperatures of keV for wedge A, for wedge B, and for wedge C. Thus, the hotter region is north and east of the galaxy center. This temperature change is likely produced by the compression of the corona as the galaxy moves through the Virgo ICM.
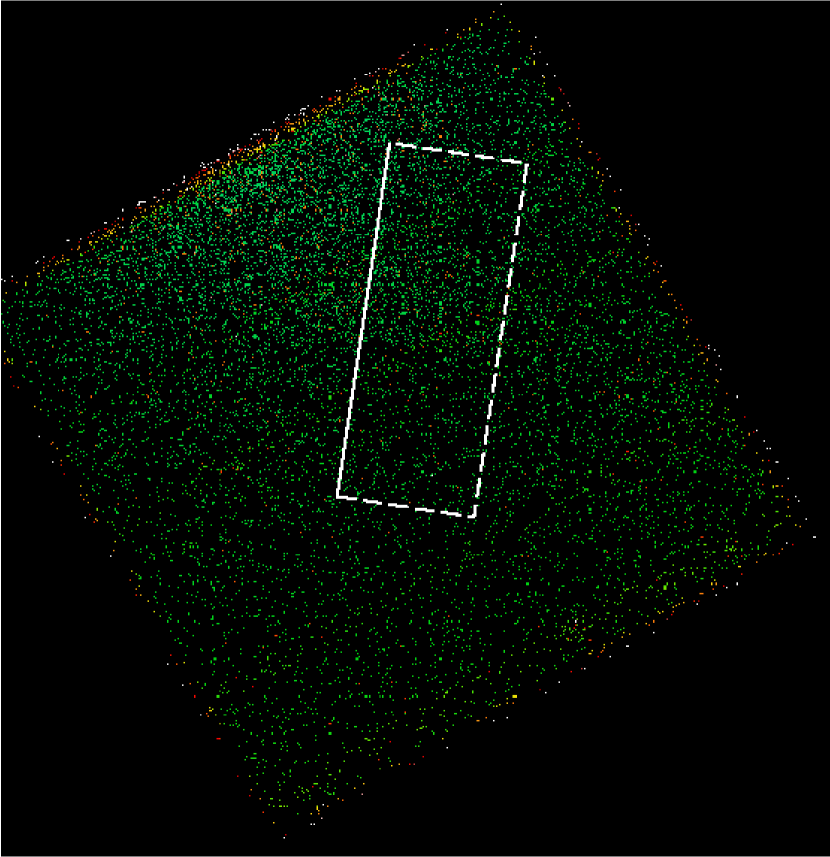
We extracted and fit temperatures on and off the SW tail. Spectral extraction regions along the SW tail are shown in Fig. 4 and were chosen to contain at least 1000 source counts. To include the contribution of cluster gas in our spectra, backgrounds derived far from the galaxy (using the I2 CCD) were subtracted from these spectra. A mekal model was fit to each spectra. We find a temperature of on the tail and a temperature of south of the tail. Surface brightnesses were calculated for a series of slices across the SW tail after an exposure map correction had been applied. The surface brightness across the tail is plotted in Fig. 9; the positive direction is to the SE, away from the galaxy core. The region from which the surface brightness profile was extracted is also plotted in Fig. 9. The surface brightness peaks by a factor of three on the tail, compared to emission from the galaxy halo at the same radius. The change in surface brightness along the southern edge of the filament is sharp, occurring over an angular size of 20′′ (155 pc).
5.2 Extent of Large Scale Structures
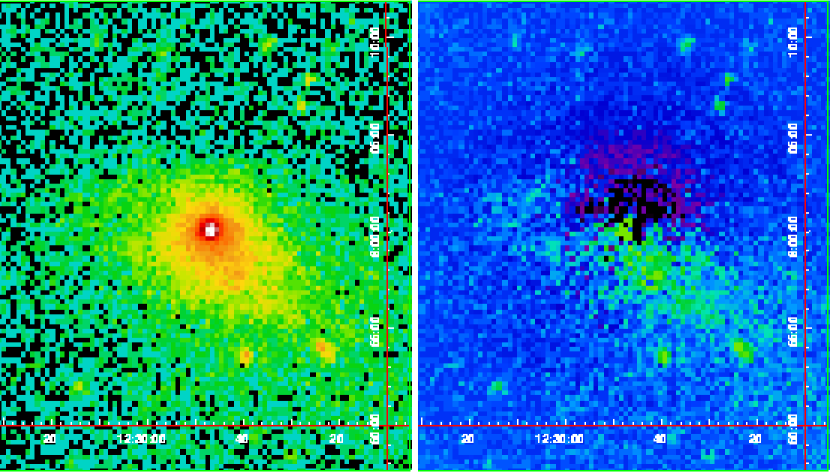
To determine the extent of asymmetric features in the NGC 4472 halo gas on large scales, we used the ROSAT PSPC pointed observation and subtracted a symmetric radial profile from the image. NGC 4472 was observed by ROSAT for 25 ksec on 26 January 1992 (see Forman et al. (1993) and Irwin Sarazin (1996) for details on this observation). A symmetric model based on the radial surface brightness profile was subtracted from the inner (70 kpc) radius of the ROSAT PSPC image. Both the ROSAT PSPC image and the subtracted image are presented in Fig. 10. A faint extension, 4′ (19 kpc) long, is seen to the ENE. The large SW tail extends (51 kpc) from the core of the galaxy in the ROSAT image, compared to the extent seen in the Chandra image. Thus the tail as detected by ROSAT is fully contained within the Chandra S2 CCD, while the faint extension to the ENE is not in the Chandra field.
5.3 The Formation of the Gas Discontinuity and the Tail by the Motion of NGC 4472 through the Virgo ICM
The large-scale structure of coronal gas in NGC 4472 is formed primarily by the interaction of the galaxy with the Virgo ICM, as originally suggested by Irwin Sarazin (1996) based on the ROSAT observation. The sharp surface brightness discontinuity 3.5′ north of the nucleus is most likely a ‘cold-front’ which is the result of ram-pressure as NGC 4472 falls into the Virgo cluster. Such structures have been well observed by Chandra in cluster mergers (e.g. Markevitch et al. 2000, Vikhlinin et al. 2001, Markevitch et al. 2002). On a smaller scale, similar features have been seen in NGC 1404 in the Fornax Cluster (Dosaj et al. 2002, Machecek et al. 2004 in preparation) and NGC 7619 (Kraft et al., 2003b). Figure 8 contains a plot of the NGC 4472 surface brightness profile in a 50∘ wedge centered on the nucleus in the direction of this discontinuity. The appearance of the discontinuity is a result of the temperature difference between the ISM of the galaxy (1.10.1 keV) and that of the Virgo cluster ICM ( keV). There is no evidence of shock heated gas in the vicinity of the discontinuity implying that the infall velocity is subsonic ( 780 km s-1). In order to evaluate the ‘cold-front’ hypothesis, we have created a simple model of the density distribution in the region around the discontinuity. The region just beyond the discontinuity must be a stagnation point and the gas on both sides of the discontinuity is in pressure equilibrium. Thus the change in temperature across the discontinuity is balanced by a similar (inverse) jump in the gas density. If we assume that the density of the gas interior to the discontinuity is uniform, and that the galaxy is falling into a uniform density medium, the resulting surface brightness profile is shown in Figure 8 (continuous curve). The rise in surface brightness just behind (within 50′′ of) the discontinuity can be explained by this simple model. Hydrodynamic simulations of the ‘cold-front’ phenomenon in merging clusters of galaxies suggest that such interactions can create complex currents in the interior regions that transport the low entropy, high abundance material from the center to just behind the discontinuity (Heinz et al., 2003).
At first glance, the SW tail appears morphologically similar to tidal features produced in N-Body simulations of galaxy mergers. However, NGC 4472 is a fairly isolated galaxy – at least from other galaxies massive enough to produce such a large feature. While stellar kinematics are slightly perturbed in the core of NGC 4472 (Caon et al., 2000), this perturbation is consistent with minor rather than major merging. NGC 4472 has most likely consumed a number of smaller galaxies over time (e.g. UGC 7636; see Patterson Thuan 1992 and McNamara et al. 1994). However, if it had interacted with a galaxy large enough to produce the observed SW tail, we would detect this other very massive (and bright) galaxy somewhere in the neighborhood.
We suggest that the SW tail is a long tail of gas extending primarily along our line of sight (similar to simulation results by Volmer et al. (2001)). The long pathlength of the tail produces the apparent sharpness along the edges. The low temperature along the tail (1.1 keV compared to 1.4 keV in the surrounding gas) implies that the tail was drawn out from the lower temperature galaxy gas surrounding the core of the galaxy. NGC 4472 has a radial velocity of 997 km s-1, while M87 has a radial velocity of 1292 km s-1 (Blakeslee et al., 2001). This radial velocity difference between NGC 4472 and M87 suggests that NGC 4472 lies behind M87 (which sits at the center of the cluster) and is falling in towards the cluster center and towards us partially along our line of sight. As there is no evidence of shock heating in the SW tail gas, we expect the tail gas to be nearly in pressure equilibrium with the surrounding gas.
To constrain the length of the SW tail along the line of sight, we assumed pressure equilibrium, calculated the pressure adjacent to the SW tail, and then calculated the extension along the line of sight that would produce a similar pressure in the SW tail. From our model fit (see §5.1), we expect an electron density of 410-4 cm-3 at a radius of 30 kpc just off the SW tail. We take a temperature of 1.4 keV for the surrounding gas (from our off-tail spectra in §5.1) and find a pressure of 5.610-4 keV cm-3. Along the SW tail, the gas temperature is measured as 1.1 keV as described in §5.1. We then calculated the pressure, volume, and density as a function of tail extension along the line of sight. To achieve pressure equilibrium, the tail must be extended 50 kpc along the line of sight at the position of our on-tail measurement region. This region lies (21 kpc on the sky) from the start of the tail near the galaxy core. Thus the ratio of the extension along the line of sight to the extension in the sky is: 50 kpc/21 kpc = 2.4. Applying this ratio to the length of the tail on the sky, we find a total tail length of 96 kpc for the length observed by Chandra and 133 kpc for the extension seen in the ROSAT PSPC image. Modeling the tail as a cone with a base diameter of 5.9 kpc, we find a total tail mass of 1.05107 M⊙ for the tail length observed by Chandra and a total tail mass of 1.45107 M⊙ for the tail length observed by ROSAT. For the region of the tail on the S2 CCD, we measure a luminosity of 2.21040 erg s-1 in the 0.5 to 2 keV band.
Both the NE edge and SW tail structures are consistent with the effects of ram pressure. Both these structures possess sharp edges – interestingly, these sharp edges are produced in different manners. The NE edge is due to the compression of the gas as NGC 4472 passes through the Virgo ICM, while the large pathlength of the SW tail gas produces its apparent sharpness.
6 The Nucleus and Extended Central Sources
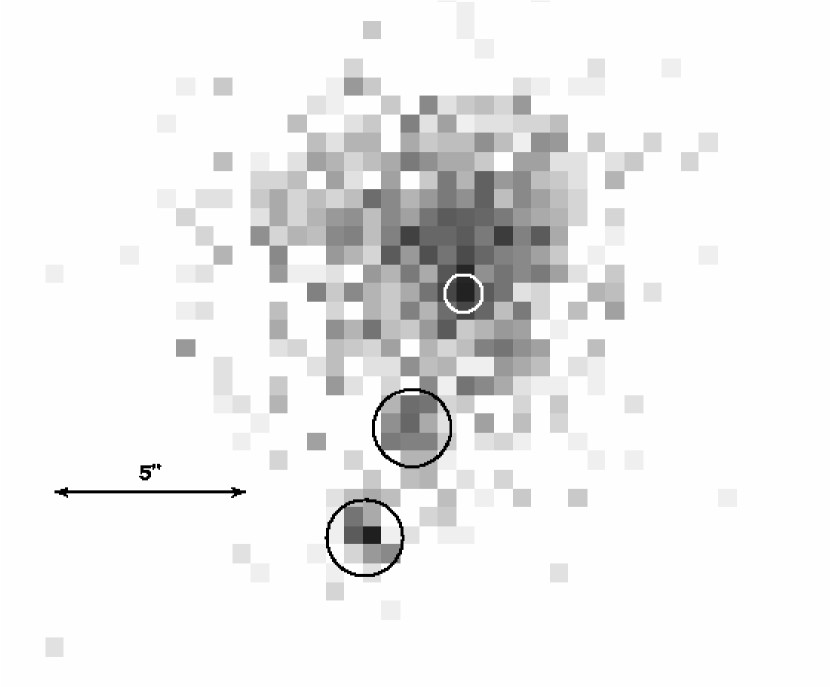
Chandra’s exquisite resolution reveals new features in the galaxy core – emission from the nucleus itself and two small extended sources within of the nucleus. An image of the central of NGC 4472 is presented in Fig. 11. Each of these sources contains about 200 counts within a radius.
Soldatenkov, Vikhlinin, & Pavlinsky (2003) and Maccarone et al. (2003) detected emission from the nucleus at energies below 2.5 keV, although Loewenstein et al. (2001) did not detect nuclear emission in the hard X-ray band from 2-10 keV. Using the accurate radio position from Nagar et al. (2002), for the nucleus, we confirm emission in the 0.3-10 keV band. Within of the nuclear position, we measure source counts in the full ACIS-S energy band from 0.3-10 keV. For a power-law spectrum with a photon index of 1.7 and an nH of cm-2, this corresponds to a 0.3-10 keV flux of ergs cm-2 s-1 and a luminosity of erg s-1. (In the 0.3-2 keV energy band, the nuclear luminosity is ergs s-1.)
Maccarone et al. (2003) previously reported emission from the two sources south of the nucleus in Fig. 11, identified as numbers 72 and 73 in their source list. Each source has a luminosity of ergs s-1. Positions, fluxes and luminosities for these sources are given in Table 2. To determine whether these two sources were point-like or extended, we compared the 0.5 to 2 keV surface brightness within a circle centered on the source to the surface brightness within an annulus from to . Background was computed from an annulus from to . We chose a small annulus for background, due to the sharp decline in the surface brightness of NGC 4472’s corona. For comparison we also extracted the counts from five point sources using these same annuli. The ratio of the counts from the circle to the counts in the to annulus was for the northern source, for the southern source and for the summed point sources. Although the bright emission from the gas around NGC 4472 complicates the determination of extent, these ratios demonstrate that the two inner sources are not point-like. We note that if the two small sources are more extended than the to annulus chosen for the background, the addition of source counts to the background would have increased the ratio of source counts in the circle to the counts in the to annulus.
We searched for optical and radio counterparts to the two small extended sources (8′′ from the nucleus) in the FIRST radio image (Becker et al., 2003) and also in HST WFPC2 data (F814W and F555W filters). We found no counterparts either in the optical or radio regimes – these sources are observed only in the X-ray. However, it is worthwhile to note that the large surface brightness of NGC 4472 near the nucleus ( = 18.24 mag arcsec-2, Boroson Thompson (1991)) prevents us from detecting faint optical sources.
Because they appear to have no detectable radio or optical emission, we first modeled the two small extended sources as X-ray emitting gas clouds. For a simple estimate of the masses of these objects, we modeled them as spheres with radii of (78 pc at 16 Mpc). We found source masses of M⊙. To estimate their lifetimes, we calculated cooling times for a 0.5 keV gas and a 1.0 keV gas of only 2.0 yr or 5.0 yr. We also compared the expected gas pressure within these sources (0.5 keV cm-1) to that of the ambient gas (0.02 keV cm-1). The very short cooling time along with the overpressured nature of these inferred gas clouds has led us to conclude that these sources are probably not clouds of gas, but instead may be collections of point X-ray sources.
| Source Position | Net Countsa | Fluxb | Lx |
|---|---|---|---|
| (epoch 2000) | (erg cm-2 s-1) | (erg s-1) | |
| 12:29:46.858 +07:59:58.26 | |||
| 12:29:46.924 +07:59:55.28 |
a - net counts are in the energy band 0.3-2.0 keV
and are computed from the source counts within a radius circle
with local background taken from a surrounding annulus.
b - Flux in the 0.5-2.0 keV band is computed from the net counts assuming a 5 keV bremsstrahlung spectrum, suitable for galactic binaries. Note that other spectral forms, e.g., a power law spectrum with or a thermal spectrum with K, give fluxes that differ by less than 10% from that for the bremsstrahlung spectrum.
7 Conclusions and Summary
Chandra’s arcsecond resolution reveals several previously unobserved structures in the 1 keV halo gas surrounding NGC 4472. These structures have been molded by a variety of mechanisms, most importantly by nuclear outburst activity and ram pressure.
On small size scales (inner corresponding to 9.3 kpc), X-ray cavities corresponding to radio lobes are the result of an episode of nuclear activity that began 1.2107 years ago and injected more than ergs. The total nuclear energy output ( ergs) producing the lobes in NGC 4472 is small compared to that seen in other galaxies, particularly those at cluster centers, which possess nuclear energy outputs of up to ergs (McNamara et al., 2001). The expansion of the radio lobes in NGC 4472 evacuates the X-ray emitting gas within the lobes, but it does not compress the X-ray lobes enough to shock the surrounding gas or to produce bright rims like those observed in galaxies with larger nuclear energy outputs (McNamara et al., 2001). From models by Ensslin Heinz (2002), we find a lobe rise velocity of 320 km s-1. This rise velocity is approximately the sound speed in the gas, supporting the interpretation of the rise of the lobe as subsonic.
Larger scale structures in the halo gas are a product of the interaction of that gas with the Virgo ICM. While the radially averaged emission fits a model surface brightness profile with =0.4400.001 and core radius a=0.2800.001 kpc, there are significant deviations from radial symmetry. The temperature increases monotonically from 0.8 keV to 1.1 keV radially outward to 10 kpc from the nucleus, then rises to 1.4 keV along the NE edge of the galaxy 10-12 kpc from the nucleus. At this NE edge, the surface brightness drops by more than an order of magnitude over a scale of 50′′ (3.9 kpc). The NE edge is the result of compression as NGC 4472 falls inward towards M87 through the Virgo ICM.
A tail-like structure in the X-ray emitting gas extends 8′ (36 kpc in the plane of the sky) to the SW of the galaxy core in the Chandra observation. We find a temperature of 1.1 keV for the tail gas and a temperature of 1.4 keV south of the tail. Surface brightness increases by a factor of 3 on the tail compared to emission from the galaxy halo at the same radius. The southern edge of the tail is very sharp, with surface brightness dropping by a factor of 3 over an angular length of 20′′ (155 pc.) The lower temperature SW tail was drawn out from the bright central region of the halo by ram pressure. Its sharp edge is a line of sight effect, since much of the tail lies radially to the observer. We find a total tail length of 96 kpc and a total tail mass of 1.05107 M⊙ for the tail observed by Chandra. From the ROSAT PSPC observation, we can trace the tail to 11′, corresponding to a length on the sky of 133 kpc.
We also confirm emission from the nucleus (first observed by Soldatenkov, Vikhlinin, & Pavlinsky (2003)) and identify two luminous sources within of the nucleus as extended. The two small extended sources sources have luminosities of 1038 erg s-1 and have no radio or optical counterparts. Modeling the two small extended sources as hot X-ray emitting gas clouds, we find that they would be severely overpressurized relative to the ambient medium. Thus, it is unlikely that these sources are X-ray emitting gas clouds; instead, they are likely collections of X-ray point sources.
References
- Becker et al. (2003) Becker, R.H., Helfand, D.J., White, R.L., Gregg, M.D., & Laurent-Muehleisen, S.A. 2003, http://sundog.stsci.edu
- Birzan et al. (2004) Birzan, L., Rafferty, D.A., McNamara, B.R., Wise, M.W., & Nulsen, P.E.J. 2004, ApJ, accepted
- Blakeslee et al. (2001) Blakeslee, J.P., Lucey, J.R., Barris, B.J., Hudson, M.J., & Tonry, J.L. 2001, MNRAS, 327, 1004
- Blanton et al. (2001) Blanton, E.L., Sarazin, C.L., McNamara, B.R., & Wise, M. 2001, ApJ, 558, L15
- Böhringer et al. (1993) Böhringer, H., Voges, W., Fabian, A.C., Edge, A.C., & Neumann, D.M. 1993, MNRAS, 264, L25
- Borgani (private communication) Borgani, S. private communication.
- Boroson Thompson (1991) Boroson, & Thompson, . 1991, AJ, 101, 111
- Caon et al. (2000) Caon, N., Macchetto, D., & Pastoriza, M. 2000, ApJS, 127, 39
- Churazov et al. (2000) Churazov, E., Forman, F., Jones, C., & Böhringer, H. 2000, A&A, 356, 788
- Dickey Lockman (1990) Dickey, J.M., & Lockman, F.J. 1990, ARA&A, 28, 215
- Dosaj et al. (2002) Dosaj, A., Jones, C., Forman, W.R., Markevitch, M.L., & Vikhlinin, A.A. 2002, BAAS, 200, 4317
- Elmegreen et al. (2000) Elmegreen, D.M., Elmegreen, B.G., Chromey, F.R., & Fine, M.S. 2000, ApJ, 120, 733
- Ensslin Heinz (2002) Ensslin, T.A., & Heinz, S. 2002, A&A, 384, L27
- Fabian et al. (2003) Fabian et al. 2003, MNRAS, 344, L43
- Finoguenov Jones (2000) Finoguenov, A., & Jones, C. 2000, ApJ, 539, 603
- Finoguenov Jones (2001) Finoguenov, A., & Jones, C. 2001, ApJ, 547, L107
- Forman, Jones, Tucker (1985) Forman, W., Jones, C., & Tucker, W. 1985, ApJ, 293, 102
- Forman et al. (2001) Forman, W., Markevitch, M., Jones, C., Vikhlinin, A., & Churazov, E. 2001, http://xxx.lanl.gov/ps/astro-ph/0110087
- Forman et al. (1993) Forman, W., Jones, C., David, L., Franx, M., Makishima, K., & Ohashi, T. 1993, ApJ, 418, L55
- Heinz et al. (2002) Heinz, S., Choi, Y.Y., Reynolds, C.S., & Begelman, M.C. 2002, ApJ, 569, L79
- Heinz et al. (2003) Heinz et al. 2003.
- Irwin Sarazin (1996) Irwin, J.A., & Sarazin, C.L. 1996, ApJ, 471, 683
- Jones et al. (2001) Jones, C., Forman, W., Vikhlinin, A., Markevitch, M., David, L., Warmflash, A., Murray, S., & Nulsen, P.E.J. 2001, ApJ, 567, L115
- Kraft et al. (2003a) Kraft, R.P., Laslo, N., Forman, W.R., Murray, S.S., Jones, C., Markevitch, M., Vikhlinin, A., & Churazov, E. 2003, HEAD, 35, 1315
- Kraft et al. (2003b) Kraft et al. 2003, in preparation.
- Loewenstein et al. (2001) Loewenstein, M., Mushotzky, R.F., Angelini, L., Arnaud, K., & Quataert, E. 2001, ApJ, 555, L21
- Maccarone et al. (2003) Maccarone, T.J., Kundu, A., & Zepf, S.E. 2003, ApJ, 586, 814
- Machecek et al. (2004) Machecek et al. 2004, in preparation.
-
Markevitch (2000)
M. Markevitch. 2000,
http://asc.harvard.edu/cal/Links/Acis/acis/Cal_prods/bkgrnd/current/index.html - Markevitch et al. (2000) Markevitch, M., Ponman, T. J., Nulsen, P. E. J., Bautz, M. W., Burke, D. J., David, L. P., Davis, D., Donnelly, R. H., Forman, W. R., Jones, C., Kaastra, J., Kellogg, E., Kim, D.-W., Kolodziejczak, J., Mazzotta, P., Pagliaro, A., Patel, S., Van Speybroeck, L., Vikhlinin, A., Vrtilek, J., Wise, M., & Zhao, P. 2000, ApJ, 541, 542
- Markevitch et al. (2002) Markevitch, M., Gonzalez, A.H., David, L., Vikhlinin, A., Murray, S., Forman, W., Jones, C., & Tucker, W. 2002, ApJ, 567, 27
- Matsumoto et al. (1997) Matsumoto, H., Koyama, K., Awaki, H., Tsuru, T., Loewenstein, M., & Matsushita, K. 1997, ApJ, 482, 133
- McNamara et al. (1994) McNamara, B.R., Sancisi, R., Henning, P.A., & Junor, W. 1994, AJ, 108, 844
- McNamara et al. (2000) McNamara, B.R., Wise, M., Nulsen, P.E.J., David, L.P., Sarazin, C.L., Bautz, M., Markevitch, M., Vikhlinin, A., Forman, W.R., Jones, C., & Harris, D.E. 2000, ApJ, 534, L135
- McNamara et al. (2001) McNamara, B.R., Wise, M., Nulsen, P.E.J., David, L.P., Carilli, C.L., Sarazin, C.L., O’Dea, C.P., Houck, J., Donahue, M., Baum, S., Voit, M., O’Connell, R.W., Koekemoer, A. 2001, ApJ, 562, L149
- Nagar et al. (2002) Nagar, N.M., Falcke, H., Wilson, A.S., & Ulvestad, J.S. 2002, A&A, 392, 53
- Patterson Thuan (1992) Patterson, R.J. & Thuan, T.X. 1992, ApJ, 400, L55
- Serlemitsos et al. (1993) Serlemitsos, P.J., Loewenstein, M., Mushotzky, R.F., Marshall, F.E., & Petre, R. 1993, ApJ, 413, 518
- Statler & McNamara (2002) Statler, T. & McNamara, B., 2002, ApJ, 581, 1032
- Soldatenkov, Vikhlinin, & Pavlinsky (2003) Soldatenkov, D.A., Vikhlinin, A.A., & Pavlinsky, M.N. 2003, Astronomy Letters, 29, 298 Vikhlinin, and Pavlinsky (2003)
- Sun et al. (2003) Sun, M., Jones, C., Murray, S.S., Allen, S.W., Fabian, A.C., & Edge, A.C. 2003, ApJ, 587, 619
- Thomas (1986) Thomas, P.A. 1986, MNRAS, 220, 949
- Tonry et al. (2001) Tonry, J.L., Dressler, A., Blakeslee, J.P., Ajhar, E.A., Fletcher, A.B., Luppino, G.A., Metzger, M.R., & Moore, C.B. 2001, ApJ, 546, 681
- Vikhlinin et al. (2001) Vikhlinin, A., Markevitch, M., & Murray, S.S. 2001, ApJ, 551, 160
- Volmer et al. (2001) Volmer, B., Cayatte, V., Balkowski, C., & Duschl, W.J. 2001, ApJ, 561, 708