Accretion in Brown Dwarfs: an Infrared View ††thanks: Based on observations collected at the European Southern Observatory, Chile.
This paper presents a study of the accretion properties of 19 very low mass objects (M⋆ M⊙) in the regions Chamaeleon I and Oph. For 8 objects we obtained high resolution H profiles and determined mass accretion rate and accretion luminosity Lac. Pa is detected in emission in 7 of the 10 Oph objects, but only in one in Cha I. Using objects for which we have both a determination of Lac from H and a Pa detection, we show that the correlation between the Pa luminosity and luminosity Lac, found by Muzerolle et al. (Mea98 (1998)) for T Tauri stars in Taurus, extends to objects with mass 0.03 M⊙; L(Pa) can be used to measure Lac also in the substellar regime. The results were less conclusive for Br, which was detected only in 2 objects, neither of which had an H estimate of . Using the relation between L(Pa) and Lac we determined the accretion rate for all the objects in our sample (including those with no H spectrum), more than doubling the number of substellar objects with known . When plotted as a function of the mass of the central object together with data from the literature, our results confirm the trend of lower for lower M⋆, although with a large spread. Some of the spread is probably due to an age effect; our very young objects in Oph have on average an accretion rate at least one order of magnitude higher than objects of similar mass in older regions. As a side product, we found that the width of H measured at 10% peak intensity is not only a qualitative indicator of the accreting nature of very low mass objects, but can be used to obtain a quantitative, although not very accurate, estimate of over a large mass range, from T Tauri stars to brown dwarfs. Finally, we found that some of our objects show evidence of mass-loss in their optical spectra.
1 Introduction
Several objects of very low mass discovered in regions of star formation have infrared excess typical of circumstellar disks (e.g., Natta and Testi NT01 (2001), Testi et al. Tea02 (2002); Natta et al. Nea02 (2002)) and show signs of accretion-related activity (Jayawardana et al. Jay02 (2002); White and Basri WB03 (2003); Muzerolle et al. Mea03 (2003)): they undergo an evolutionary phase similar to that of classical T Tauri stars (TTS) (Jayawardana et al. 2003b ). This evidence sets potentially important constraints on the formation of very low mass objects, and on the dominance of dynamical processes in star formation in general (e.g., Bate et al. BBB03 (2003)), which, however, need to be made more quantitative. Statistics of disks, measurements of their masses, characterization of the accretion as a function of the mass of the central objects in regions of different age and properties are required, and are being accumulated, exploiting fully the capabilities of 8-m class telescopes.
In this paper we discuss one important parameter in this scenario, namely the accretion rate in very low mass objects, which, together with the disk mass, determines the timescale for disk survival. Mass accretion rates have been determined for a handful of very low mass objects, mostly from model-fitting of the H profiles (Muzerolle et al. Mea03 (2003)). The results indicate that the trend of lower accretion rates for objects of lower mass, known for TTS (White and Ghez WG01 (2001); Rebull et al. Rea00 (2000)) continues in the substellar regime, where typical accretion rates are much lower than in TTS and can be as low as M⊙/yr (Muzerolle et al. Mea00 (2000)). There is also evidence that, again as for TTS (e.g. Calvet et al. CHS00 (2000)), the fraction of accreting objects among very low mass objects is higher in younger regions (Jayawardana et al. Jay02 (2002), 2003b ). All this points to a continuity in the accretion properties across the range of mass explored so far, which suggests a similar formation mechanism from solar to sub-stellar masses.
These results, however, are based on few measurements only, and need to be confirmed. In particular, it is important to extend them to younger, more embedded regions, where the use of H to derive the accretion rate is made hard or altogether impossible by the high extinction. In these regions, it is natural to use instead infrared hydrogen recombination lines, such as Pa or Br. For TTS, it has been shown that the flux in these lines provides a good estimate of the accretion rate (Muzerolle et al. Mea98 (1998)). The purpose of this paper is to extend this method to the sub-stellar regime, by obtaining near-IR spectroscopy of a sample of well-known objects in two star-forming regions (Chamaeleon I and Oph) for which we have also acquired and analyzed high-resolution H profiles.
The range of masses of interest goes from the low end of the stellar range (M⊙) to brown dwarfs (BD: 0.075 M⊙) and planetary-mass objects, below the deuterium-burning limit (0.013 M⊙ or 13 MJ). In fact, these distinctions are meaningful only “a posteriori”, when bona-fide stars reach the main sequence, not in young star-forming regions, where all objects, independently of their mass, derive their energy from contraction. For the sake of simplification (and in view of the uncertainties affecting mass determinations), we will talk in the following of very low mass objects or VLMOs.
In §2 we detail the observations, obtained with UVES and ISAAC on VLT. The results are presented in §3 and discussed in §4. A summary follows in §5.
2 Observations
2.1 Sample
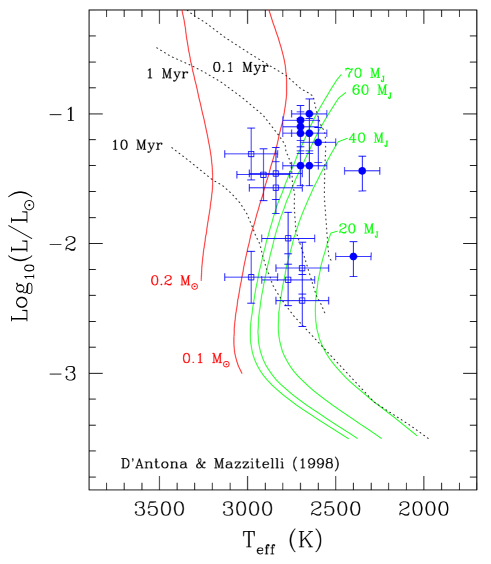
We have collected a total of 19 objects, 9 in Chamaeleon I and 10 in Oph. Their properties are listed in Table 1. For the Cha I sample, spectral types, effective temperatures, extinctions, luminosities and masses are from Comerón et al (Cea00 (2000)). Quoted uncertainties are 150 K in Teff, 0.2 dex in Log L⋆, and a factor of 2 in M⋆. Stellar parameters for the Oph sources are from Natta et al. (Nea02 (2002)), with the exception of GY10, not included in the Natta et al. sample, for which we adopt the parameters of Wilking et al. (WGM99 (1999)). Uncertainties are 100 K in Teff, 20–30% in L⋆, 20–40% in M⋆ (see Testi et al. Tea02 (2002) for a detailed discussion). The sample contains a number of bona-fide BDs, several objects that are either very low mass stars or relatively high-mass BDs, one object ( Oph-033) which has an estimated mass of 10 MJ only. Based on their location on the HR diagram (see Fig. 1), the VLMOs in Cha I are significantly older than those in Oph (2 Myr versus 1 Myr, respectively).
2.2 Low resolution near-infrared spectroscopy
Near-infrared low resolution spectra in the J and K bands were obtained for all our targets using the ISAAC near-infrared camera and spectrograph at the ESO-VLT UT1 telescope. The observations were carried out partly in Visitor Mode on April 8, 2002, and partly in Service Mode from March to July 2003 (see Table 2; Table 2 is only available in electronic form at ”http://www.edpsciences.org”). We used the 0.6 arcsec slit and the low resolution grisms that offered a 800 resolution across the wavelength ranges 1.0–1.3 m and 1.95–2.45 m. The observing sequence was composed by a set of pairs of spectra with the target in different positions along the slit, to allow for an efficient and accurate sky subtraction. The on-source integration times varied from 25 to 40 minutes depending on target brightness and observing band (the J-band observations were typically 40–30% shorter than the K-band ones). Standard calibrations (flats and lamps) and telluric standards spectra were obtained for each observation. Wavelength calibration was performed using the lamps observations and adjusted by measuring a few OH sky lines before sky removal. We did not attempt to obtain flux calibrations.
2.3 High resolution optical spectroscopy
High resolution optical spectra for the eight brightest (in the optical bands) objects in our sample were collected using the UVES spectrograph on the ESO-VLT UT2 telescope (see Table 2). For each target a series of three to five 45 min exposures were obtained in the period from March to June 2003. All spectra were obtained using the standard UVES setup with central wavelength 580nm. The chosen setup allowed us to cover a nominal spectral range from 450 to 680nm. However, due to the very low signal obtained in the blue part of the spectra (450–580 nm), only the red part was analyzed. The slit used was 12 arcsec long and 1 arcsec wide, giving a resolution R40000. Standard calibrations were obtained by the ESO staff as part of the Service Mode and the data were reduced using the UVES pipeline. All spectra were of excellent quality and the H line was detected with high signal to noise in all individual spectra.
| Star | ST | Teff | LogL⋆ | AV | M⋆ | H10% | EW(H)a | EW(Pa)a | EW(Br)a | Log | Log |
|---|---|---|---|---|---|---|---|---|---|---|---|
| (K) | (L⊙) | (mag) | (MJ) | (km/s) | (Å) | (Å) | (Å) | (M⊙/y) | (M⊙/y) | ||
| Cha H1 | M7.5 | 2770 | -1.96 | 0.2 | 40 | 155 | 35 | 0.3 | 1 | 12 | 11.4 |
| Cha H2 | M6.5 | 2910 | -1.47 | 0.8 | 70 | 366 | 33 | 0.3 | 1.5 | 10.0 | 10.8 |
| Cha H3 | M7 | 2840 | -1.46 | 0.3 | 60 | 142 | 10 | 0.9 | 1.2 | 12 | 10.1 |
| Cha H5 | M6 | 2980 | -1.31 | 1.0 | 100 | 137 | 6.5 | 0.9 | 1.7 | 12 | 10.0 |
| Cha H6 | M7 | 2840 | -1.57 | 0.26 | 50 | 274 | 48 | 0.3 | 1 | 10.5 | 10.8 |
| Cha H7 | M8 | 2690 | -2.19 | 0.3 | 30 | – | – | 0.6 | 1.0 | – | 11.1 |
| Cha H9 | M6 | 2980 | -2.26 | 1.5 | 70 | – | – | 0.6 | 1.0 | – | 11.4 |
| Cha H10 | M7.5 | 2770 | -2.28 | 0.1 | 40 | – | – | 0.3 | 0.9 | – | 12.0 |
| Cha H11 | M8 | 2690 | -2.44 | 0.0 | 30 | – | – | 0.3 | 0.9 | – | 12.1 |
| Oph-023 | M7 | 2650 | -1.40 | 8.0 | 40 | – | – | 1.80 | 1 | – | 9.3 |
| Oph-030 | M6 | 2700 | -1.15 | 3.0 | 60 | 292 | 30 | 0.30 | 1 | 10.8 | 10.1 |
| Oph-032 | M7.5 | 2600 | -1.22 | 2.0 | 40 | 248 | 50 | 0.40 | 0.9 | 10.5 | 9.8 |
| Oph-033 | M8.5 | 2400 | -2.10 | 7.0 | 10 | – | – | 0.7 | 2.1 | – | 10.3 |
| Oph-102 | M6 | 2700 | -1.10 | 3.0 | 60 | 377 | 40 | 2.0 | 1 | 9.0 | 8.9 |
| Oph-160 | M6 | 2700 | -1.40 | 6.0 | 45 | – | – | 3.3 | 4.0 | – | 9.0 |
| Oph-164 | M6 | 2700 | -1.05 | 6.0 | 60 | – | – | 0.80 | 1.6 | – | 9.3 |
| Oph-176 | M6 | 2650 | -1.15 | 7.0 | 50 | – | – | 0.5 | 1.3 | – | 9.7 |
| Oph-193 | M6 | 2650 | -1.00 | 7.5 | 60 | – | – | 1.8 | 2.9 | – | 8.9 |
| Oph-GY10 | M8.5 | 2350 | -1.44 | 18 | 30 | – | – | 0.5 | 1.0 | – | 9.0 |
a Positive values indicate emission.
b Accretion rates from H profiles.
c Accretion rates from Pa luminosities.
3 Results
3.1 Accretion rates from H
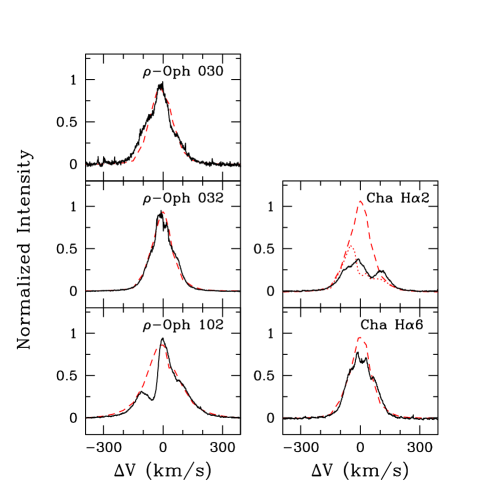
All eight observed objects have H emission, in seven cases with equivalent width Å. Of these, five (2 in Cha I and 3 in Oph) show in all our observations broad H profiles. This, as discussed by White and Basri (WB03 (2003)) and Jayawardana et al. (Jay02 (2002)), is indication of accretion-related rather than chromospheric activity. For each of these objects, we have computed an average profile, shown in Fig. 2, and compared it to the prediction of the magnetospheric accretion models developed by Muzerolle et al. (Mea01 (2001)) and recently applied to a sample of sub-stellar objects by Muzerolle et al. (Mea03 (2003)). Accretion rates derived from H profiles agree well with those obtained from veiling in TTS (e.g., Muzerolle et al. Mea98b (1998)) and in the few VLMOs for which could be estimated from veiling measurements (Muzerolle et al. Mea03 (2003)).
The underlying assumption is that the entire H (as well as the other hydrogen lines) comes from accreting matter, and that the contamination from wind/jet emission is negligible. This is not necessarily true in all strongly accreting TTS (see, for example, Bacciotti et al. Bac02 (2002)), but is probably a good approximation for our objects (see §3.4).
For all objects we have adopted a stellar mass M⋆=50 MJ, radius 0.5 R⊙ and a magnetospheric truncation radius of 2.2–3 R⋆. The results are not very sensitive to the exact values of these parameters. The fitting procedure gives for each object a value of and of the inclination angle . The resulting accretion rates are given in Table LABEL:stars; they range from M⊙/yr for Oph-102 to M⊙/yr for Oph-030. The inclination angle is deg for Cha H2, Oph-030, Oph-032, deg for Cha H6,and 30 deg for Oph-102. The fits are of acceptable quality, with the exception of Cha H2, whose broad and flat profile (clearly present in all the observations) cannot be reproduced by the current models (similar profiles are observed in few other VLMOs and discussed in Muzerolle et al. Mea03 (2003)). The fit can be somewhat improved by adopting an ad-hoc temperature profile for the accretion flow, whereby the temperature has been reduced relative to the fiducial model in the outer part of the flow near the disk. This results in less emission near the line center, the most uncertain part of the profiles given the approximations used in the radiative transfer calculations (see Muzerolle et al. Mea01 (2001)). Nevertheless, both models for Cha H2 have similar inclination and an accretion rate of the order of M⊙/yr, which we will adopt in the following. As discussed by Muzerolle et al. (Mea03 (2003)), the values of derived from the H profiles should be accurate within a factor of .
A second group of 3 objects, all in Cha I, (Cha H1, Cha H3, Cha H5) has always narrow H profiles, typical of cromospheric activity. For these objects, we estimate an upper limit to of about M⊙/yr, for which the magnetospheric accretion models predict a line emission below the detection limit.
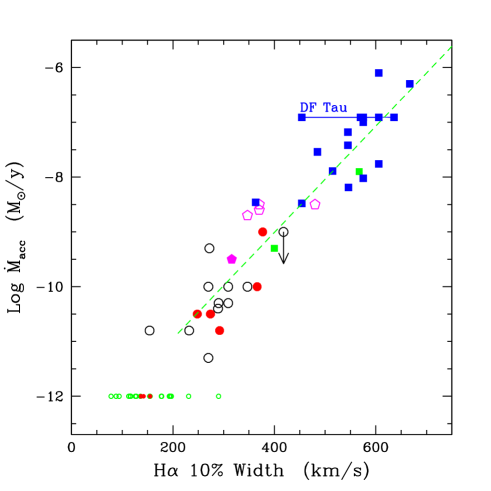
In Fig. 3 we compare our estimates of to those of other VLMOs and TTS from the literature. The figure plots as a function of the full width of H measured at 10% of the peak intensity (after continuum subtraction). Dots are VLMOs (mass M⊙), where is measured by fitting the H profiles (filled dots from this paper, open dots from Muzerolle et al. Mea03 (2003)); pentagons are VLMOs with values of high enough to produce measurable veiling in the optical (White and Basri WB03 (2003); Muzerolle et al. Mea00 (2000), Mea03 (2003); Barrado y Navascués et al. BMJ04 (2004)). The squares show the location on this diagram of a sample of more massive TTS, from which has been derived from veiling (Gullbring al. Gea98 (1998)), and the 10% H width are from high resolution H profiles obtained by Edwards et al. (Eea94 (1994)). The total sample spans a range of masses from about 0.04 to 0.8 M⊙. Fig. 3 shows that our determinations of agree with the general trend shown by other objects from the literature, and that there is continuity between measurements obtained from veiling (which are fully independent of the H width) and those derived from H profiles.
In the sub-stellar regime, the H10% width, which can be derived directly from the observations, is considered a good indicator of accretion, with the separation between accretors and non-accretors set at H10% width between 200 km/s (Jayawardana et al. 2003b ) and 270 km/s (White and Basri WB03 (2003)). Fig. 3 confirms this result. Adopting 200 km/s as a limit, one would missclassify one accreting object out of 23 (MHO-4, with M⊙/yr and H 10% width of 154 km/s; Muzerolle et al. Mea03 (2003)) and two non accretors (V927 Tau and USco CTI-O75) out of the 37 for which there are upper limits (Muzerolle et al. Mea03 (2003) and this paper). Furthermore, Fig. 3 shows that there is a rather good correlation between the H 10% width and over the whole range of mass from BDs to TTS, so that it is possible to use the observed width not only to discriminate between accretors and non-accretors but also to get an approximate estimate of the accretion rate, without performing detailed model fits. We show in Fig. 3 the best-fit relation between these two quantities for H 10% width km/s, which can be expressed as:
| (1) |
where % is the H 10% width in km/s and is in M⊙/yr.
The spread is rather large, and can be due in part to the fact that in most cases the measurements used to derive and the high-resolution H profiles have not been obtained simultaneously. We show, as an illustration of possible problems, the rather unusual case of the TTS DF Tau which has an accretion rate of about M⊙/yr, based on veiling from medium-resolution spectrophotometric data obtained in 1996 (Gullbring et al. Gea98 (1998)). High resolution profiles of several Balmer lines obtained non-simultaneously from 1988 to 1990 by Edwards et al. (Eea94 (1994)), show broad emission in all the lines, but with large discrepancies between them; in particular, the H width is smaller than that of the higher Balmer lines. One could certainly improve the correlation if larger and simultaneous sets of data for TTS were available. values derived in this way are necessarily inaccurate for individual objects, and should be used with care. Nevertheless, they can be very useful when dealing with large samples of objects.
3.2 Pa and Br as accretion indicators
Our near-IR spectroscopy does not allow us to resolve the line profiles, and we can only measure equivalent widths, listed in Table 1. Of the 9 Chamaeleon I objects, Pa is detected in only 1. For the others, we can set upper limits to the equivalent width (3) of about 0.3–0.9 Å. In Ophiucus, on the contrary, we detect Pa emission in 7 of the 10 observed objects. Br is detected only in 2 objects in Oph. Of the 5 objects with evidence of accretion from H, Pa is detected in 4, while Br is not detected in any. Fig. 4 shows the spectra of the objects with line detections.

These results suggest that Br, which is intrinsically weaker than Pa, is more difficult to detect even in highly reddened objects, where differential extinction favors lines at longer wavelengths. For this reason, we will focus in the following on the use of Pa as an accretion indicator. We have therefore converted equivalent widths into fluxes using broad-band magnitudes and then correcting for extinction for the Cha I objects, while for the Oph objects we have used the calibrated low-resolution spectra of Natta et al. (Nea02 (2002)) for the continuum and corrected for extinction the resulting line fluxes.
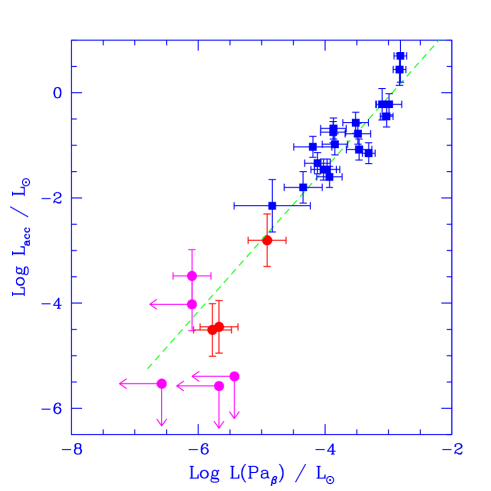
Fig. 5 shows the relation between the Pa luminosity (derived from the measured fluxes assuming a distance of 150 pc for Ophiucus and 160 pc for Cha I) and the accretion luminosity, computed from and the stellar parameters given in Table 1. According to Muzerolle et al. (Mea98 (1998)), these two quantities (rather than line flux versus ) show the tightest correlation in TTS, and we have added Muzerolle’s sample to ours. The figure shows that the trend of lower Pa luminosity for lower Lac extends to the very low values of Lacwhich characterize VLMOs. In fact, one can derive a rather good relation to estimate Lac from the Pa luminosity over the whole range of masses from few tens of Jupiter masses to about one solar mass, shown by the dashed line in Fig. 5 and given by:
| (2) |
where Lac and L(Pa) are in units of L⊙. Note that this relation is, within the uncertainties, identical to that derived by Muzerolle et al. (Mea98 (1998)) for TTS over a much narrower interval of L(Pa).
As for H we have ignored the possibility that some Pa emission may come from wind or jets, driven by accretion. In several TTS, the profiles of Pa and Br are well described by magnetospheric accretion models (Folha and Emerson FE01 (2001)), but there are some examples of Pa wind emission (Whelan et al. Whea04 (2004)). Inspection of Fig. 5 shows that, very likely, any correction for a wind/jet contribution to the Pa luminosity will be lost within the uncertainties of the individual measurements and the large scatter of the points. Nevertheless, the possibility of a contribution from outflowing matter to lines should be kept in mind when discussing individual objects.
Using the relation (2), we have derived Lac and for all the objects in our sample; is given in the last column of Table 1. The largest differences between this determination of and that from the H profile is of the order 0.7–0.8 in log, i.e., a factor 6 (see also Fig. 5).
3.3 Variability
Spectroscopic and photometric variability over a large interval of timescales is typical of pre-main sequence stars of all mass, including sub-stellar objects. By necessity, this introduces an artificial spread in correlation such as those of Fig. 3 and 5, when the accretion rate or luminosity and the line properties are not measured simultaneously. We expect that the quality of these correlations could improve significantly if simultaneous observations were available.
Another consequence of variability is the difficulty of assigning a well-defined accretion rate to any specific star. Variations of the Br flux are typically within a factor 2–3 (see, for example, Greene and Lada GL97 (1997); Luhman and Rieke LR98 (1998)); if similar variations apply to Pa (for which we could not find multiple-epoch data in the literature) this would change the estimate of Lac by a factor . In some cases, the lines become undetectable, and one would then classify the star among non-accretors.
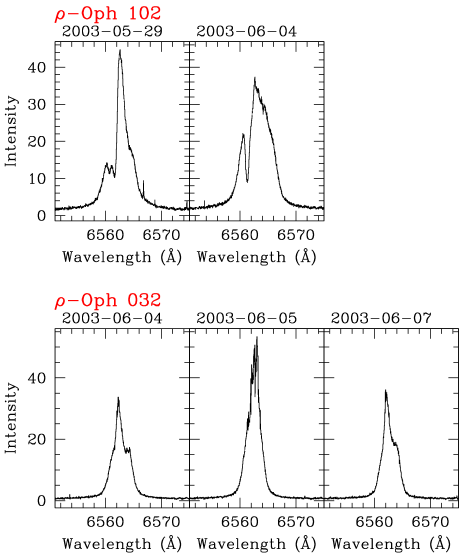
Similar uncertainties are obtained if we consider the variations of the H 10% width. In our spectra (see Fig. 6), the largest variation is seen in Oph-102, where the H 10% width varies from 335 km/s on May 29, 2003 to 411 km/s on June 4, 2003. According to eq.(1), the corresponding accretion rate would increase by a factor 5. In all the other objects the H variations are smaller, implying a maximum change of of a factor 3 at most. A comparison of the sub-stellar objects in IC 348 for which H profiles have been obtained by Muzerolle et al. (Mea03 (2003)) and Jayawardana et al. (2003b ) shows variations that would results in changes of Lac again by a factor , according to Eq.(1).
An interesting case is that of Oph-030 (GY 5), which has a strong H emission in our and Jayawardana et al. (Jay02 (2002)) spectra (but a very different profile and a 10% H width of 292 and 352 km/s respectively) but is narrow (177 km/s) and weak in the spectrum of Muzerolle et al. (Mea03 (2003)).
Some of these variations may be due to differences in the quality of the spectra (resolution, signal-to-noise etc.), since all the VLMOs are very weak, often close to the instrumental limits. Still, most of the variability is likely to be real, as suggested by very similar results in TTS. For any individual object, one should have high quality spectra and long time sequences, which could provide not an instantaneous but a “typical” accretion rate. However, if we consider a large sample of objects, these individual variations will average up and will only increase the spread of any existing correlation, but not change it systematically.
3.4 Other Optical Lines
The UVES spectral range contains a number of other emission lines (in addition to H), usually considered good indicators of mass-loss and accretion. Table LABEL:other_lines gives the equivalent width of the lines (positive values for emission) and, in some cases, as for the NaD doublet, some information on their profile. The spectrum of Cha H1 is too noisy, and we have dropped this object from the table.
The HeI lines are generally interpreted as emitted in the accretion shock at the base of the infalling matter: these lines are indeed present and measurable in all the objects where we detect accretion in H (Cha H2, Cha H6, Oph-030, Oph-032 and Oph-102), but not in Cha H3 and 5, which have narrow H profiles and no evidence of accretion. This result is consistent with our H analysis.
| Object | [OI]6300 | [OI]6363 | [NII]6583 | [SII]6716 | [SII]6731 | HeI5875 | HeI6678 | NaI5896,5890a |
|---|---|---|---|---|---|---|---|---|
| (Å) | (Å) | (Å) | (Å) | (Å) | (Å) | (Å) | ||
| Cha H2 | – | – | 0.06: | 0.06: | 0.1 | 1.6 | 0.6 | E(PCyg) |
| Cha H3 | – | – | 0.03: | 0.08 | E | |||
| Cha H5 | – | – | 0.2 | E | ||||
| Cha H6 | – | – | 0.07 | 0.08 | 1.1 | 0.3 | E | |
| Oph-030 | – | – | 1.0 | 0.3: | E | |||
| Oph-032 | – | – | 0.1: | 0.12: | 6.0 | 2.2 | E | |
| Oph-102 | 2: | 0.4: | 0.1: | 0.07 | 0.2: | 4.4 | 2.3 | E(PCyg) |
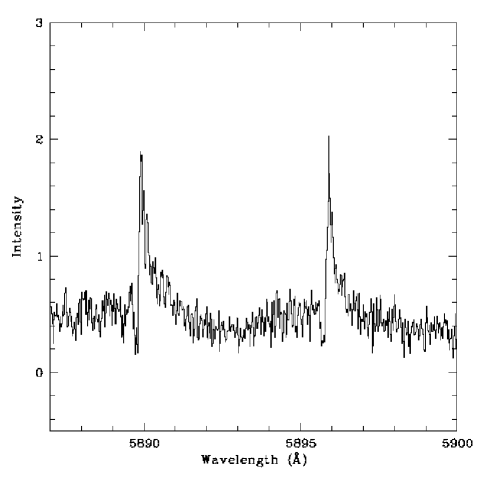
a E: both components in emission; PCyg: additional blue-shifted absorption (see Fig. 7).
Some of the objects show indications of outflows. These are particularly strong in Oph-102, which has emission in all the forbidden lines of [OI], [NII], [SII], and shows a P-Cygni profile in the NaD doublet (see Fig. 7), but also Oph-32, Cha H2 and Cha H3 have detectable emission in some of the forbidden lines, and clear emission in the NaD doublet. All these objects are good candidates for further studies of winds and jets in VLMOs. However, there is no evidence of H2 vibrationally excited emission in the IR spectra of our objects, with the possible exception of Oph-033, where, however, it is likely due to contamination from VLA 1623 (see also Williams et al. Wea95 (1995)).
Weak accretion-driven winds are expected in VLMOs, if they behave as TTS. Note, however, that even in Oph-102 the equivalent width of H is much larger than that of the [SII] lines (the ratio is 200). The weakness of the forbidden lines in comparison to H in our objects supports the assumption that the hydrogen lines form mostly in the accreting gas (see also Fernández and Comerón FC01 (2001) and references therein).
As well known the presence of Li is a strong indication of substellar nature and/or youth. The covered spectral range includes the Li i doublet at 6708 Å. We detect it in absorption in all but one objects with equivalent widths ranging between 0.2 and 0.5 Å, confirming, in combination with the late-M spectral types, that they are members of the clouds. The Li line is not detected in Cha H1; we believe this is due to the very low S/N of the spectrum which shows virtually no continuum (see also Jörgens and Günther JG01 (2001)).
4 Discussion
4.1 Accretion as a function of mass and age
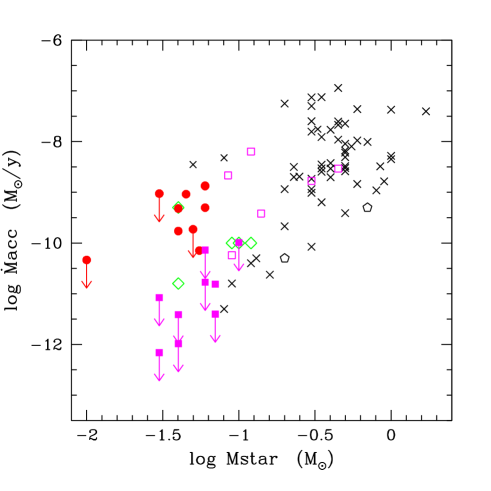
Our sample of VLMOs more than double the number of objects with measured . We plot in Fig. 8 our results, together with a compilation of data from the literature, as a function of the mass of the central object. The data include TTS and VLMOs, spanning a range of masses of about two orders of magnitude. All the masses have been redetermined self-consistently using the same evolutionary tracks (1998 unpublished update of D’Antona and Mazzitelli DM97 (1997)), and the accretion rates have been scaled to these values, when necessary. Note that we have plotted upper limits for only for objects from this paper.
Both and M⋆ have large uncertainties, discussed in detail, among others, by Muzerolle et al. (Mea03 (2003)) and in this paper. There are, however, some clear trends. First of all, Fig. 8 confirms, over a large range of masses, the trend already found by other authors (Muzerolle et al. Mea03 (2003); Rebull et al. Rea00 (2000)) of decreasing for decreasing M⋆. If, for example, we compare the median for M⋆0.1 M⊙ to that in the mass interval 1–0.3 M⊙, we find values of and M⊙/yr, respectively (neglecting upper limits to ). It is unlikely that this trend is caused by sensitivity limits. Although, as we will discuss in the following section, in many VLMOs the accretion rate is close to the model sensitivity, this is not the case of TTS (see, e.g., Muzerolle et al. Mea03 (2003)), so that the correlation we find neglecting upper limits is probably somewhat shallower than the true one.
A second effect is clearly shown in Fig. 8, namely that the accretion rate, for the same mass of the central object, is higher in younger regions. The Oph brown dwarfs have accretion rates of roughly – M⊙/yr, more than an order of magnitude larger than most objects of similar mass in Taurus, Chamaeleon and IC 348. An age dependence of is known in TTS (e.g., Calvet et al. CHS00 (2000)), and is suggested for VLMOs by the fact that the fraction of objects with narrow H profiles (non-accretors) is larger in older star forming regions (Jayawardana et al. Jay02 (2002), 2003b ). Our results confirm this trend: only 10% (1 out of 10) of the objects in our Cha I sample are accreting; if we include also the Gómez and Persi (GP01 (2001)) VLMOs, then the fraction becomes 28% (5 out of 18 objects).
The dependence of on age makes it hard to determine the exact relationship of vs. M⋆ from samples where objects in regions of very different age are collected together, as in Fig. 8. For example, the Oph BD population selected by Natta et al. (Nea02 (2002)) is particularly young, and it would be interesting to compare their accretion rates to equally young TTS in Oph, rather than to TTS in Taurus. Also, there are a few VLMOs in Taurus, Cha I and IC348 with very large accretion rates, comparable or even higher than those of the Oph VLMOs. Some of these estimates need to be confirmed, and the possibility of having detected a flare ruled out. Still, one wonders if they could be much younger than the average population of the star-forming region to which they belong.
In spite of the large uncertainties that affect individual objects, these preliminary results show that it is now possible, with the advent of 8-m class telescopes that give access to the VLMOs population, to quantify the dependence of on mass and age, overcoming, due to the large range of M⋆ that one can explore, the uncertainties of individual measurements. For this one needs larger and more homogeneous samples of stars (not only VLMOs but also TTS) in a variety of star-forming regions.
4.2 Disks and Accretion
Classical TTS show a clear correlation between accretion and the presence of a circumstellar disk. Disks are detected around a number of VLMOs, which show mid-infrared fluxes well in excess of the photospheric ones (e.g., Comerón et al. Cea98 (1998), Persi et al. Pea00 (2000), Bontemps et al. Bea01 (2001)), modeled as the emission of disks heated by radiation from the central objects (Natta and Testi NT01 (2001), Testi et al. Tea02 (2002); Natta et al. Nea02 (2002)).
Table LABEL:disks summarizes the information on the presence of a mid-IR excess in our sample objects. All 10 objects in Oph have been detected by ISOCAM at 6.7 and 14.3 m (Bontemps et al. Bea01 (2001)), and the correlation between disk and accretion, i.e., broad H and/or emission in the hydrogen IR lines, is basically confirmed by the results of this paper.
| Star | Acc. | Acc. | Acc. | 6.7 m | 14.3 m |
|---|---|---|---|---|---|
| (H) | (Pa) | (Br) | |||
| Cha H1 | N | N | N | Y | Y |
| Cha H2 | Y | Y | N | Y | Y |
| Cha H3 | N | N | N | Y | N |
| Cha H5 | N | N | N | Y | N |
| Cha H6 | Y | N | N | Y | N |
| Cha H7 | – | N | N | N | N |
| Cha H9 | – | N | N | Y | Y |
| Cha H10 | – | N | N | N | N |
| Cha H11 | – | N | N | N | N |
| Oph-023 | – | Y | N | Y | Y |
| Oph-030 | Y | Y | N | Y | Y |
| Oph-032 | Y | Y | N | Y | Y |
| Oph-033 | – | N | N | Y | Y |
| Oph-102 | Y | Y | N | Y | Y |
| Oph-160 | – | Y | Y | Y | Y |
| Oph-164 | – | Y | N | Y | Y |
| Oph-176 | – | N | N | Y | Y |
| Oph-193 | – | Y | Y | Y | Y |
| Oph-GY10 | – | N | N | Y | Y |
The Chamaeleon sample is in a way more intriguing. Three objects (Cha H1, Cha H2, Cha H9) have excess emission at 6.7 and 14.3 m(Persi et al. Pea00 (2000)), modeled by Natta and Testi (NT01 (2001)) as due to disks. Of these, Cha H2 is clearly accreting, Cha H1 and Cha H9 (for which we have no H profile) do not. Three objects have been detected at 6.7 m, but not at 14.3 m; of these, Cha H3 and Cha H5 do not show evidence of accretion in H nor in Pa or Br, while Cha H6 has broad H, but no emission in the IR lines. Finally, three (H7, H10 and H11) have no detected mid-IR excess and no IR line emission.
It appears from these results that disks are detected more easily than accretion, and that there is a population of VLMOs with evidence of disks but no detectable accretion activity. This is somewhat different from TTS, where most WTTS have no evidence of accretion but also no detectable IR excess (as some of the Cha I objects). This is probably due to the fact that even in very active VLMOs the accretion rate is close to the sensitivity limit of the various methods one can use, making it difficult to discriminate between “accretors” and “non-accretors”. On the contrary, in TTS typical accretion rates are at least two orders of magnitude higher than the sensitivity limit of veiling measurements and/or H profile fitting (Gullbring et al. Gea98 (1998); Muzerolle et al. Mea03 (2003)), and the separation between accreting and non-accreting objects is therefore much more meaningful.
One of the implications of the very low accretion rates that characterize BDs is that their disks should live long. If we assume, for example, that the disk mass scales with the mass of the central objects in BDs as in TTS, we have typical disk masses of about M⊙; with an accretion rate of M⊙/yr, as measured in Oph, the disk will live at least years, as a typical TTS. This agrees with the results of Liu et al. (Liu03 (2003)), who found no signficant difference in the fraction of disks between BDs and TTS, and that the age of the TTS with disks was similar to that of TTS without disks.
It is more difficult to use this same result to rule out “truncated” disks, as those produced by the dynamical ejection of stellar embryos predicted, e.g., by Bate et al. (BBB03 (2003)). Let us assume, for example, that the disk has an outer radius of 100 AU, and that, once ejected, loses all material outside a radius of about 10 AU. The mass left depends critically on the unknown density profile of the disk, and may range from about 1/3 (if the surface density profile was ) to about 1/10 (for ) of the original mass. A disk with mass of only M⊙will live about years, much less than a typical disk of TTSs, and also much less than the age of many BDs with infrared excess in star-forming regions (e.g., Jayawardhana et al. 2003a ). However, if the density profile is very peaked, the difference will not be significant, given the large uncertainties and spread of all the parameters involved. Only very accurate model predictions can be verified or falsified by this kind of arguments.
A final point worth mentioning is that the relation of the accretion rate with the mass and age of the central object may shed light on the physical process by which disk matter accretes onto the central star. The simplest suggestion is that the accretion rate may be related to the temperatures in the disk, which in turn are closely coupled to the luminosity of the central object. This may explain both the dependence of on M⋆ and its decrease with time, since objects of all masses, and BDs in particular, fade as they get older. However, it is not clear that the change in temperature is big enough to account for the changes in . More subtle effects can be at work, related for example to the level of chromospheric and coronal activity (and hence X-ray fluxes) of the star and resulting disk ionization (see discussion in Muzerolle et al. Mea03 (2003)).
5 Summary and conclusions
We present in this paper new optical and near-infrared spectroscopic observations of a sample of 19 very low mass objects in the regions Chamaeleon I and Oph. Our main aim was to test if accretion rates could be determined from the intensity of the hydrogen recombination lines in the infrared, namely Pa and Br. This possibility is very important when dealing with large numbers of VLMOs in young star-forming regions such as Oph, where high-resolution spectroscopy in the visual is possible for only a handful of objects.
To this purpose, we have obtained high-resolution H profiles of all the objects in our sample bright enough to be detectable with UVES on VLT. The comparison of the observed profiles with those predicted by magnetospheric accretion models (Muzerolle et al. Mea01 (2001)) shows that five objects are actively accreting, with in the range M⊙/yr, while the remaining three in Cha I have narrow and symmetric profiles, and M⊙/yr.
Pa is detected in emission in 7 of the 10 Oph objects, but only in one in Cha I. We show that the correlation between the Pa luminosity and the accretion luminosity Lac, found by Muzerolle et al. (Mea98 (1998)) for TTS in Taurus over a range of masses 0.3–1 M⊙, extends to masses about ten times lower. Whereas the relation between L(Pa) and Lac (eq.(2)) can certainly be improved when more data will be available, it is already reasonably well defined, and can be used to measure Lac, and consequently , for large samples of obscured VLMOs. The results are so far less conclusive for Br for which we have a detection in only 2 objects, none with measured accretion rate.
Using eq.(2) and the measured L(Pa), we determined for all the VLMOs in our sample, increasing the number of VLMOs with known by more than a factor of two. When plotted as a function of the mass of the central object together with all the existing data on VLMOs and TTS from the literature, our results confirm the trend of lower for lower M⋆, although with a large spread. Some of the spread is likely due to an “age” effect, namely that, for a given value of M⋆, decreases strongly with time. Our very young VLMOs in Oph have on average at least one order of magnitude higher than objects in older star forming regions. The dependence of on central mass and time needs to be better constrained by future observations. However, it is already clear that these data can provide very valuable information on the accretion mechanism in disks during the pre-main–sequence evolutionary phase.
One side product of our analysis is that the width of H measured at 10% peak intensity correlates quantitatively with over a large range of and M⋆. This supports the currently used criterion to separate accretors from non-accretors among VLMOs according to the H 10% width (White and Basri WB03 (2003)) and confirms that a value of 200 km/s (as suggested by Jayawardana et al. 2003b ) is a rather good threshold value. Furthermore, it suggests that one can use the H 10% width to obtain a quantitative estimate of over a large range of masses. Although the spread of the correlation (eq.(1)) is large, and there are a number of caveats to keep in mind, the possibility of estimating without going through rather time consuming model fits is interesting, and deserves further attention.
Finally, we would like to note that high-resolution near-infrared spectroscopy on 8-m class telescopes is becoming available. As with H for visible objects, high quality infrared line profiles can be compared to model predictions to derive accretion rates for obscured ones. The additional advantage of the IR lines is that they are likely less contaminated than H by wind/jet emission, flares and stellar activity in general; a sufficiently large sample of objects with measured H and Pa profiles will be very valuable in providing more ”calibration” points for the line intensity–accretion rate relations, and in better constraining magnetospheric accretion models.
Acknowledgements.
This work was partly supported by the MIUR-cofin grant ”Low-mass stars and brown dwarfs: formation mechanisms, mass distribution and activity”. We thank the referee (S. Mohanty) for comments that have greatly improved our paper.References
- (1) Bacciotti F., Ray T.P., Mundt R., Eislöffel J., Solf J. 2002, A&A 576, 222
- (2) Baraffe I., Chabrier G., Allard F., Hauschildt P.H. 1998, A&A 337, 403
- (3) Barrado y Navascués D., Mohanty S., Jayawardhana R., 2004, ApJ, in press
- (4) Bate R.M., Bonnell I.A., Bromm V. 2003, MNRAS 339, 577
- (5) Bontemps S., André Ph., Kaas A.A., et al. 2001, A&A 372, 173
- (6) Calvet N., Hartmann L., Strom S.E. 2000, in “Protostars and Planets IV”, eds Mannings, V., Boss, A.P., Russell, S.S., (Tucson: University of Arizona Press) p. 377
- (7) Comerón F., Rieke G.H., Claes P., Torra J., Laureijs R.J. 1998, A&A 335, 522
- (8) Comerón F., Neuhäuser R., Kaas A.A. 2000, A&A 359, 269
- (9) D’Antona F., Mazzitelli I. 1997, Mem.S.A.It. 68, 807
- (10) Edwards S., Hartigan P., Ghandour L., Andrulis C. 1994, AJ 108, 1056
- (11) Fernández M., Comerón F. 2001, A&A 380, 264
- (12) Folha D.F.M., Emerson J.P. 2001, A&A 365, 90
- (13) Greene T.P., Lada C.J. 1997, AJ 114, 2157
- (14) Gómez M., Persi P. 2001, A&A 389, 494
- (15) Gullbring E., Hartmann L., Briceño C., Calvet N. 1998, ApJ 492, 323
- (16) Jayawardhana R., Mohanty S., Basri G. 2002, ApJ 578, L141
- (17) Jayawardhana R., Ardila D.R., Stelzer B., Haisch K.E. 2003a, AJ 126, 1515
- (18) Jayawardhana R., Mohanty S., Basri G. 2003b, ApJ 592, 282
- (19) Jörgens V., Günther E. 2001, A&A 379, L9
- (20) Liu M.C., Najita J., Tokunaga A.T. 2003, ApJ 585, 372
- (21) Luhman K.L., Rieke G.H. 1998, ApJ 525, 440
- (22) Muzerolle J., Hartmann L., Calvet N. 1998, AJ 116, 2965
- (23) Muzerolle J., Hartmann L., Calvet N. 1998, AJ 116, 455
- (24) Muzerolle J., Calvet N., Hartmann L. 1998, ApJ 492, 743
- (25) Muzerolle J., Calvet N., Hartmann L. 2001, ApJ 550, 944
- (26) Muzerolle J., Calvet N., Brice o C., Hartmann L., Hillenbrand L. 2000, ApJ 535, L47
- (27) Muzerolle J., Hillenbrand L., Calvet N., Brice o C., Hartmann L. 2003, ApJ 592, 266
- (28) Natta A., Testi L. 2001, A&A 367, L22
- (29) Natta A., Testi L., Comerón F., Oliva E., D’Antona F., Baffa C., Comoretto G., Gennari S., 2003, A&A 393, 597.
- (30) Persi P., Marenzi A.R., Olofsson G., Kaas A.A., Nordh L. et al. 20023, A&A 357, 219
- (31) Rebull L.M., Hillebrand L.A., Strom S.E., Duncan D.K., Patten B.M., Pavlousky C.M., Makidon R., Adams M.T. 2000, AJ 119, 3026
- (32) Testi L., Natta A., Oliva E., D’Antona F., Comeron F., Baffa C., Comoretto G., Gennari S. 2002, ApJ 571, L155
- (33) Whelan E.T., Ray T.P., Davis C.J. 2004, A&A 417, 247
- (34) White R.J., Basri G. 2003, ApJ 582, 1109
- (35) White R.J., Ghez A. 2001, ApJ 556, 265
- (36) Wilking B.A., Greene T.P., Meyer M.R. 1999, AJ 117, 469
- (37) Williams D.M., Comeron F., Rieke G.H., Rieke M.J. 1995, ApJ 454, 144