Dark Matter Subhaloes in Numerical Simulations
Abstract
We use cosmological CDM numerical simulations to model the evolution of the substructure population in sixteen dark matter haloes with resolutions of up to seven million particles within the virial radius. The combined substructure circular velocity distribution function (VDF) for hosts of 1011 to 1014 at redshifts from zero to two or higher has a self-similar shape, is independent of host halo mass and redshift, and follows the relation . Halo to halo variance in the VDF is a factor of roughly two to four. At high redshifts, we find preliminary evidence for fewer large substructure haloes (subhaloes). Specific angular momenta are significantly lower for subhaloes nearer the host halo centre where tidal stripping is more effective. The radial distribution of subhaloes is marginally consistent with the mass profile for r0.3rvir, where the possibility of artificial numerical disruption of subhaloes can be most reliably excluded by our convergence study, although a subhalo distribution that is shallower than the mass profile is favoured. Subhalo masses but not circular velocities decrease toward the host centre. Subhalo velocity dispersions hint at a positive velocity bias at small radii. There is a weak bias toward more circular orbits at lower redshift, especially at small radii. We additionally model a cluster in several power law cosmologies of , and demonstrate that a steeper spectral index, , results in significantly less substructure.
keywords:
galaxies: haloes – galaxies: formation – methods: N-body simulations – cosmology: theory – cosmology:dark matter1 Introduction
A critical test of the CDM model is its ability to accurately predict the evolution of the distribution of “subhaloes” within dark matter haloes, or haloes within haloes. The hierarchical formation process of CDM haloes by multiple mergers (White & Rees 1978) leaves behind tidally-stripped merger remnants that survive as bound subhaloes within larger haloes (Ghigna et al. 1998). Subhaloes serve as hosts for visible galaxies within clusters, groups, or larger galaxies, and so provide a powerful and observable cosmological probe. In cases where dark matter subhaloes may have no luminous counterparts, the substructure population can be inferred from gravitational lensing studies (e.g. Mao & Schneider 1998; Metcalf & Madau 2001; Chiba 2002; Dalal & Kochanek 2002; Mao et al. 2004).
CDM models predict the abundance of substructure to be roughly self-similar, independent of halo mass (Klypin et al. 1999; Moore et al. 1999), and to follow a poisson distribution (Kravtsov et al. 2004a). Subhalo numbers predicted by the CDM model are reasonably matched by observations of clusters (Ghigna et al. 2000; Springel et al. 2001; Desai et al. 2004; see however Diemand, Moore & Stadel 2004b). However, observations measure roughly an order of magnitude fewer subhaloes in Galactic haloes than in clusters (Klypin et al. 1999; Moore et al. 1999). Thus, mass is either more smoothly distributed on small scales than predicted by CDM cosmology, or Galactic dark matter subhaloes are poorly traced by stars. An element of uncertainty in the comparisons with CDM model predictions is the possibility of significant halo to halo variation in the subhalo population that could depend on host mass, merging history, or environment. Results from the handfull of high-resolution simulations on galactic scales to date suggest that such variance in substructure numbers are significant but much too small to account for the apparent discrepancy in Galactic subhaloes (e.g. Moore et al. 1999; Klypin et al. 1999; Font et al. 2001). Even if observed Galactic dwarfs reside in subhaloes of significantly deeper potential than inferred from their stellar velocity dispersions and radial extent, which could allow the most massive satellites to match predictions (Stoehr et al. 2002; Hayashi et al. 2003; however see also Kazantzidis et al. 2004 and Willman et al. 2004), then the non-detection of the vast majority of small subhaloes remains an unsolved problem. However, semi-analytic work suggests that baryonic physics causes small haloes to remain starless, indicating that observations may be consistent with the CDM model (e.g. Bullock, Kravtsov & Weinberg 2000; Benson et al. 2002ab; Somerville 2002).
By analysing substructure in a large number of dark matter haloes, we can measure the range of halo to halo variation, and better constrain the uncertainty in the CDM subhalo distribution with the improved statistics. With better numerical resolution and a broad range in host halo masses, substructure can be used to place cosmological constraints at new mass scales. Furthermore, detailed dark matter simulations provide a theoretical CDM baseline to link subhalo properties with observable galaxy characteristics. The conditional luminosity function, which describes the number of galaxies of luminosity in hosts of a given mass, can be combined with simulated subhalo populations in order to associate subhalo properties with observable characteristics (Yang, Mo & van den Bosch 2003; van den Bosch, Yang & Mo 2003; see further Vale & Ostriker 2004). This allows one to investigate the impact of baryonic physics on the galaxy distribution.
Our simulation set is more sensitive to possible dependence of the subhalo population on host halo mass or redshift than previous works. Consequently, we can improve constraints on whether substructure properties are a function of , where is the characteristic mass of collapsing haloes defined by the scale at which the rms linear density fluctuation equals the threshold for non-linear collapse. One might expect that because low-mass haloes were mostly assembled much earlier when the universe was more dense, are at smaller , and lie where the power spectrum of mass fluctuations is steeper, that they might have significantly different subhalo distributions than more massive haloes. If subhaloes within low-mass and low-redshift haloes have a higher characteristic density (see e.g. Reed et al. 2005 and references therein), then they should be less subject to tidal stripping and disruption. Additionally, if the infall rate on to the host halo (i.e. merger rate) is different from the rate of subhalo destruction, then subhalo numbers will evolve with redshift.
The angular momentum of a cosmic (sub)halo is crucial to determine the radial distribution of its eventual stellar component (e.g. Mo, Mao & White 1998; Verde, Oh & Jimenez 2002, Van den Bosch et al. 2002) and its collapse factor compared to the parent dark matter halo (Stoehr et al. 2002). If high angular momentum material is systematically stripped from subhaloes this would further inhibit the formation of stellar discs in dense environments consistent with observations (e.g. Goto et al. 2003). Also, a high collapse factor of the baryonic component would make the velocity dispersions of the stars eventually formed lower than that associated with the parent halo. This would exacerbate the apparent difference between the observed abundance of galaxy satellites and the predicted abundance of their host haloes, as discussed in detail in Stoehr et al. (2002) and Kazantzidis et al. (2004).
The angular momentum of the dark matter component of a subhalo will be relevant to its stellar properties only if star formation continues after infall and tidal stripping, which requires that sufficient baryons remain in the subhalo. While one generally expects much of a subhalo’s gas to be stripped upon infall, some of that gas may also be able to cool and form stars. Complex processes such as starbursts after infall and redistribution of baryonic angular momentum under tidal influences may affect the final spin of the baryonic component. Simulations predict starbursts will occur in gas-rich satellites as they are tidally stirred by the central potential (e.g. Mayer et al. 2001), which may explain the continuing star formation in Galactic satellites. However, a better understanding of post-infall star formation is needed to determine whether the angular momentum of the stellar component is correlated with that of the dark matter component.
Subhaloes are particularly sensitive to resolution issues (e.g. Moore, Katz & Lake 1996). Dark matter haloes, and by extension, subhaloes, have densities that continually increase toward the halo centre, and so should be very difficult to disrupt completely unless numerical discreteness effects artificially lower the central density. A subhalo with a numerically softened cusp is more easily disrupted by the global tidal forces and interactions with other subhaloes that strip away the outer regions. Poor spatial resolution and two body relaxation lowers central densities, and so may lead to subhalo destruction, especially near host halo centres. Simulated clusters may generally suffer more from resolution issues than galaxies because of their later formation epoch, which means that cluster particles will have spent more time in low mass haloes (Diemand et al. 2004a). Also, subhaloes with highly eccentric orbits are more likely to be disrupted since they pass near to the central potential.
In this work, we present the results of substructure analyses of 16 CDM simulated haloes covering three decades in mass, from dwarfs to clusters, each with roughly a million particles. Our sample includes ten clusters extracted from one cosmological volume (CUBEHI) to study cosmological variance, and also includes a seven million particle group and a four million particle cluster. Some of our haloes are well-resolved to redshifts of three or higher, allowing investigation of mass or redshift-dependent trends. Additionally, we have modelled a cluster in power law cosmologies where Pkn to analyse the dependence of the subhalo distribution on spectral index, .
2 Numerical Techniques
2.1 The Simulations
We use the parallel K-D (balanced binary) Tree (Bentley 1975) gravity solver PKDGRAV (Stadel 2001; see also Wadsley, Stadel & Quinn 2004) to model sixteen dark matter haloes, further described in Reed et al. (2005); see Table 1. The CUBEHI run consists of a cube of 4323 particles of uniform resolution. The six “renormalized volume” runs (e.g. Katz & White 1993; Ghigna et al. 1998) consist of a single halo in a high-resolution region nested within a lower resolution cosmological volume. Initial conditions for these high resolution halo runs are created by first simulating a low resolution cosmological volume. Next, a halo of interest is identified. To minimise sampling bias, volume-renormalized haloes are selected by mass with the only additional constraint that they not lie within close proximity () to a halo of similar or larger mass. Then, the initial conditions routine is run again to add small-scale power to a region made up of high resolution particles that end up within approximately two virial radii of the halo centre, while preserving the original large scale random waves. This process is iterated in mass resolution increments of a factor of eight until the desired resolution is achieved. We have verified that the high-resolution haloes are free from significant contamination by massive particles.
Our largest halo has seven million particles and most have particles within the virial radius at redshift zero. Due to the high sensitivity of the subhalo distribution to numerical resolution effects, we only consider haloes with at least 3.5105 particles. We adopt a CDM cosmology with 0.3 and 0.7. The initial density power spectrum is normalized such that extrapolated to redshift zero is 1.0, consistent with both the cluster abundance (see e.g. Eke, Cole & Frenk 1996 and references therein) and the WMAP normalization (e.g. Bennett et al. 2003; Spergel et al. 2003). We use a Hubble constant of 0.7, in units of 100 km s-1 Mpc-1, and assume no tilt (i.e. a primordial spectral index of 1). To set the initial conditions, we use the Bardeen et al. (1986) transfer function with . For the volume-renormalized runs, we list the effective particle number of the highest resolution region rather than the actual particle number in Table 1. Numerical parameters are consistent with empirical studies (e.g. Moore et al. 1998; Stadel et al. 2001; Power et al. 2003; Reed et al. 2003).
| Mhalo | vcmax,host | Np,halo | Np,eff | vc,lim | ) | Lbox (h-1Mpc) | |||
|---|---|---|---|---|---|---|---|---|---|
| CUBEHI | 0.7-2.1 | 710-1010 | 0.6-1.6106 | 4323 | 50 | 5 | 69 | 50 | 10 clusters |
| GRP1 | 4 | 560 | 7.2 | 17283 | 40 | 0.625 | 119 | 70 | Fornax mass |
| CL1 | 2.1 | 1020 | 4.6 | 8643 | 60 | 1.25 | 119 | 70 | Cluster |
| GAL1 | 2 | 244 | 0.88 | 23043 | 20 | 0.469 | 119 | 70 | Milky Way |
| GRP2 | 1.69 | 460 | 0.38 | 8643 | 60 | 1.25 | 119 | 70 | Group |
| DWF1 | 1.88 | 130 | 0.64 | 46083 | 15 | 0.234 | 119 | 70 | 2 Dwarfs |
| 1.93 | 130 | 0.66 | |||||||
| 1.9 | 1300 | 0.54 | 4323 | 2.5 | 799 | 70 | |||
| 2 | 1110 | 0.55 | 4323 | 2.5 | 269 | 70 | |||
| 1.6 | 870 | 0.45 | 4323 | 2.5 | 99 | 70 | |||
| 2.9 | 470 | 0.82 | 4323 | 2.5 | 79 | 70 |
2.2 The Analysis
The host haloes are defined using the SO algorithm (Lacey & Cole 1994) with a tophat overdensity based on Eke et al. (1996) where the CDM virial overdensity, , in units of critical density is approximately 100. Bound subhaloes are identified using SKID (Stadel 2001; http://www-hpcc.astro.washington.edu/tools/skid.html), which uses local density maxima to identify bound mass concentrations independently of environment. SKID iteratively “slides” particles toward higher densities until a converged group of particles is found. The radial extent of each SKID halo is determined by the distribution of bound particles, and no predetermined subhalo shape is imposed. The maximum circular velocity of each subhalo, , is calculated from the measured peak of the rotation curve . For virialized host haloes, the ratio of depends primarily on , and is readily estimated from the halo density profile given in Reed et al. (2005). Typical values of are 1.5–1.6 for our dwarfs and 1.05–1.25 for our clusters at redshift zero, declining to smaller values at higher redshift for each halo. To test for self-similarity between haloes, we thus normalize the velocity distribution function (VDF) to the peak circular velocities of hosts. We note that a subhalo bound to another subhalo will sometimes be catalogued as a separate SKID subhalo, particularly when the chosen linking parameter is small. Our tests indicate that the velocity distribution function is insensitive to except for the few largest subhaloes. We set for the CUBEHI run, and for all other simulations. We consider only subhaloes of 32 or more particles in our analyses, consistent with Ghigna et al. (1998) and Springel et al. (2001). For analyses of subhalo angular momenta, we adopt an empirically motivated minimum of 144 particles per subhalo; see section 3.2. Differential plots of binned quantities use the median value of each bin, and bin sizes are variable in increments of log0.1, but increased when necessary so that no bins are empty.
2.3 A Resolution Study and the Radial Distribution of Subhaloes
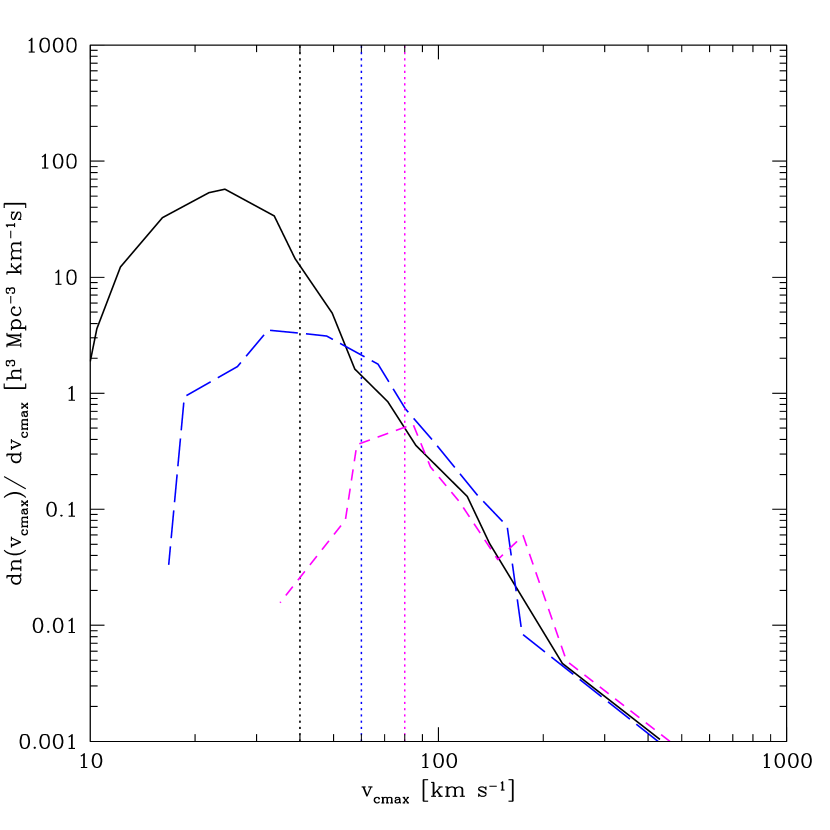
For our volume renormalized runs, GAL1, GRP1, and CL1, we have analysed 3, 2, and 1 identical lower resolution versions, respectively, where the mass resolution is varied by increments of 8. To find the minimum subhalo circular velocity down to which our results are complete, , we plot the subhalo circular velocity distribution function (VDF) for each simulation, and identify the below which the VDF slope begins to flatten due to incompleteness, as described in Ghigna et al. (2000). In Fig. 1, we plot the resolution criteria for halo GRP1, marking our conservative completeness limits. The agreement of the lower resolution versions shows that this technique is sound. Less conservative – but still apparently sound – completeness limits for our halo sample would have yielded roughly for each of our three haloes with multiple resolutions. Numerical effects on the subhalo population are likely manifested more strongly for low-redshift subhaloes, since they have been subject to potentially disrupting events for more time. This implies that measuring at should still be valid at higher redshift. We have verified that the for halo GRP1 remains valid at where the highest resolution version still has particles. Additionally, we have considered whether the completeness limits, which were obtained using subhaloes within the entire virial volume, may change at small radii, where numerical problems are expected to be stronger. We find that even when the sample is limited to , the derived from the entire virial volume as described above, remains valid.
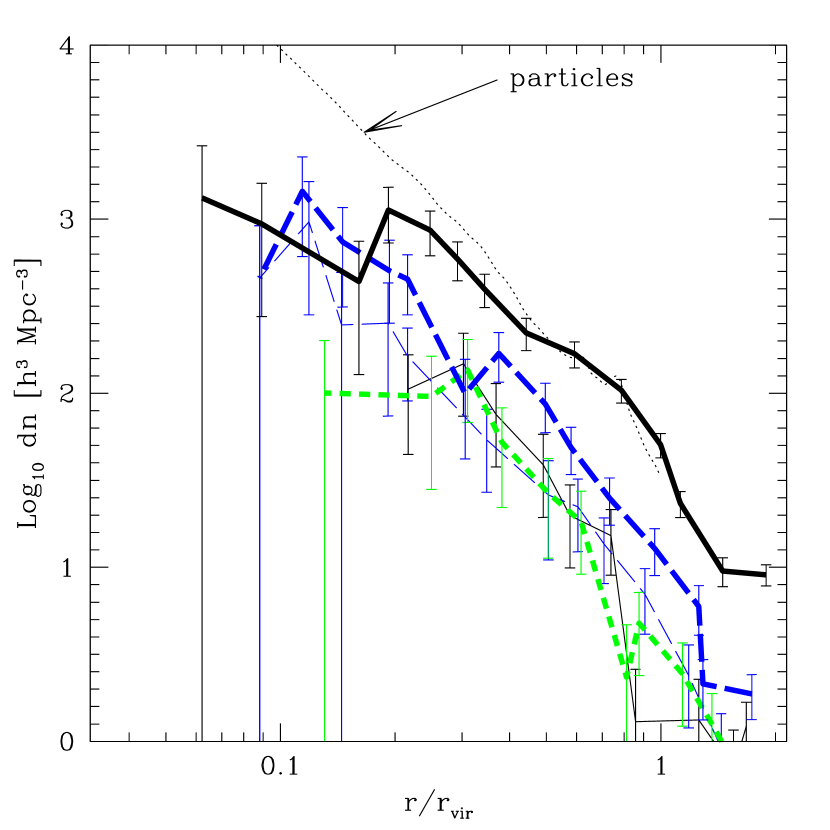
The radial distribution of the subhalo population, shown for GRP1 in Fig. 2, has a slope equal to or shallower than the slope of the density profile for each resolution at all radii. At very small radii, subhaloes are highly deficient, possibly due at least in part to artificial disruption by the tidal forces from the central mass concentration. When a subhalo migrates inward via dynamical friction to a radius where its central density is lower than the local density of the host halo, it will likely be disrupted (e.g. Syer & White 1998). Numerical disruption enhanced by the strong tides near host centres could affect subhaloes. The flattened slope of the radial subhalo distribution of GRP1 subhaloes relative to the mass profile interior to roughly 0.2 for our highest resolution, and interior to 0.3 for our lowest resolution implies that disruption and/or stripping of subhaloes is important in the halo central region. The increase in radius of the break in subhalo slope with decreasing resolution suggests that numerical disruption, if present, is worse for lower resolutions. However, we caution that the location of the break is not well defined because of poisson uncertainties. Given the uncertainties, it is not possible to reliably separate spurious from real disruption that may be present in our simulations at small radii. Thus, we have no evidence that the central substructure number density has converged with resolution. Increasing the mass resolution by a factor of eight results in roughly a factor of 2–2.5 more subhaloes at a given radius beyond roughly 0.3, though there is substantial noise in this estimate. At larger radii, where numerical effects are less important, a subhalo radial distribution that is shallower than the mass profile is favoured in our data, and is also reported by Diemand et al. (2004b), Gill, Knebe & Gibson (2004a), Stoehr et al. (2003), Gao et al. (2004ab), De Lucia et al. (2003), and Nagai & Kravtsov (2005). However, a radial subhalo slope equal to the mass profile slope is not ruled out except in the central region where numerical effects may dominate. Note that if we use only a minimum mass cut without imposing the circular velocity completeness limit, a more significant anti-bias in the radial distribution is found (see also Nagai & Kravtsov (2005)
3 Results
3.1 The Circular Velocity Distribution Function (VDF)
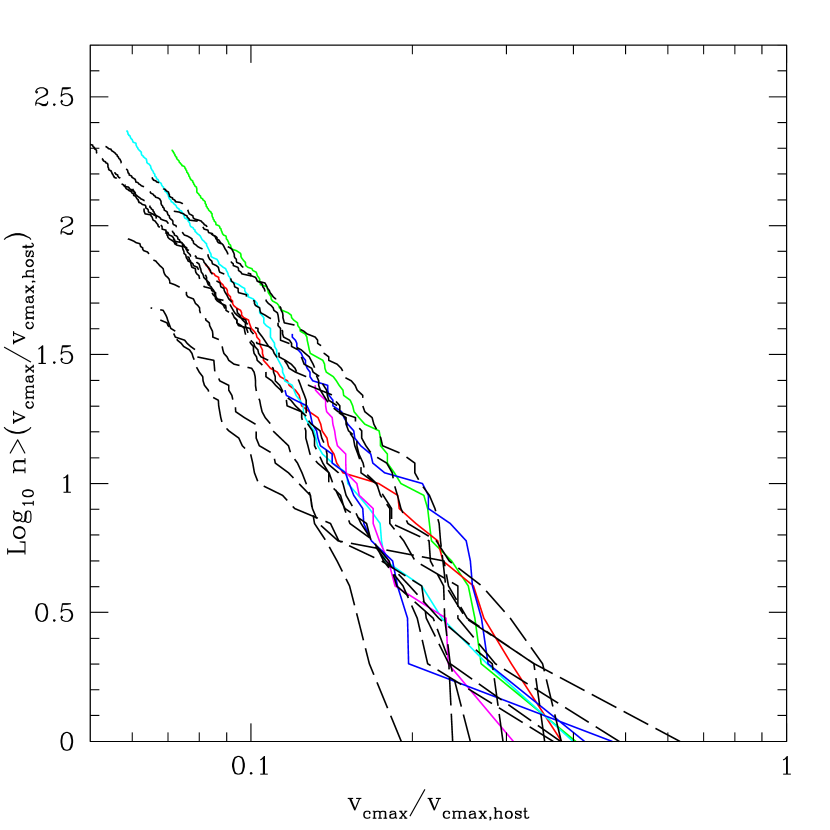
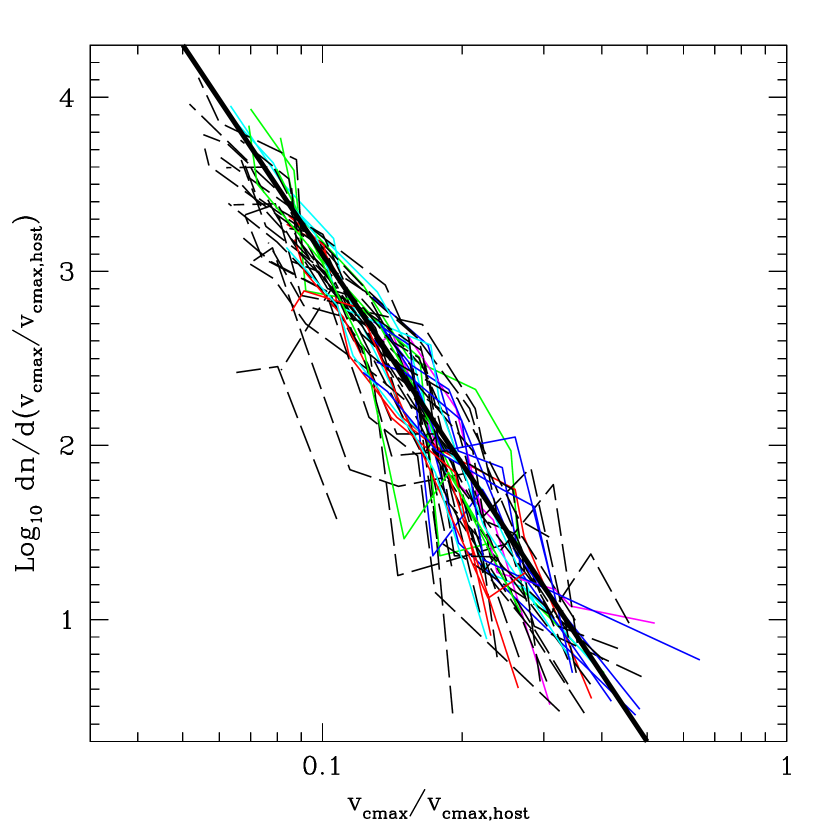
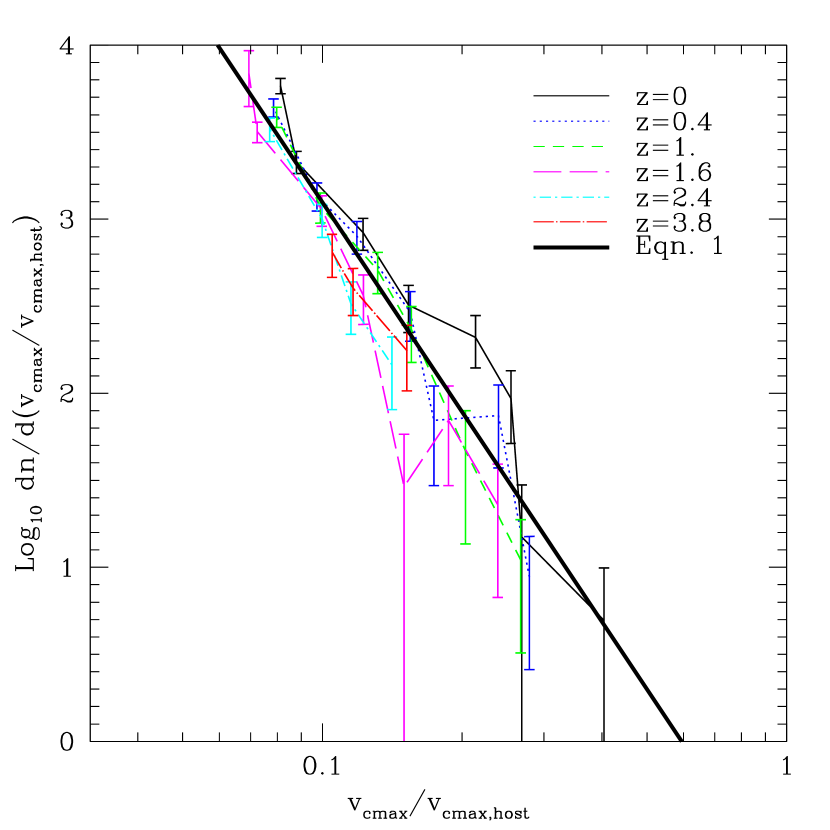
In Fig. 3, we plot the cumulative VDF for all haloes at redshift zero. Our completeness and resolution limits exclude the majority of subhaloes identified by SKID, leaving of the order of 100 subhaloes in most hosts. Fig. 4 shows the differential VDF for our entire set of subhaloes at z2 for hosts of more than particles. The subhalo VDF is well-approximated by a power law with slope and normalization given by
| (1) |
over the range of approximately 0.07 to 0.4 with halo to halo scatter of a factor of roughly two to four. When we individually consider the VDF for hosts of different mass, we find no evidence of mass dependence on the VDF amplitude or slope in our data, and similarly we detect evidence of weak or zero redshift dependence (see below). This implies that the number density of subhaloes is approximately self-similar, independent of the mass and redshift of the host halo. Here we caution that a larger halo sample would be needed to identify any weak trends (e.g. an increase in substructure abundance with halo mass, reported by Gao et al. 2004a) as they would be masked by the large halo to halo scatter. The farthest low VDF outlier halo is the largest cluster in the CUBEHI simulation at , which has approximately particles at the time. In Fig. 5, we present the VDF of our highest resolution halo to redshift . There is little or no evolution in VDF slope or normalization, although there are fewer large subhaloes at high redshift, as seen by the lack of data points in the VDF beyond large in high-redshift hosts. Thus, large subaloes are deficient until lower redshifts when they either infall on to the host or are formed as merger products of existing subhaloes.
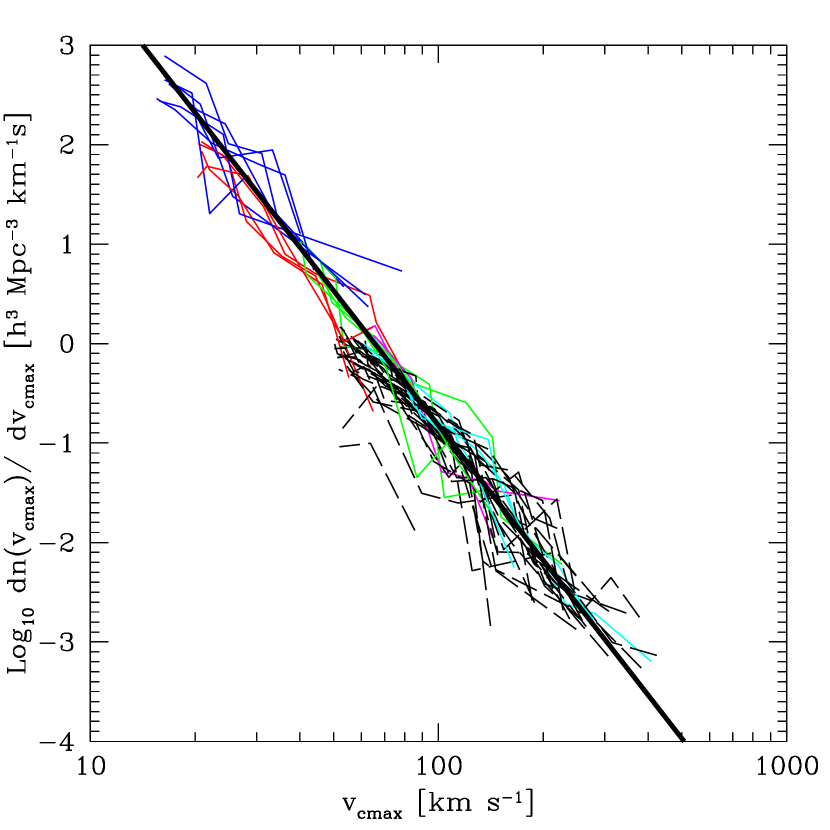
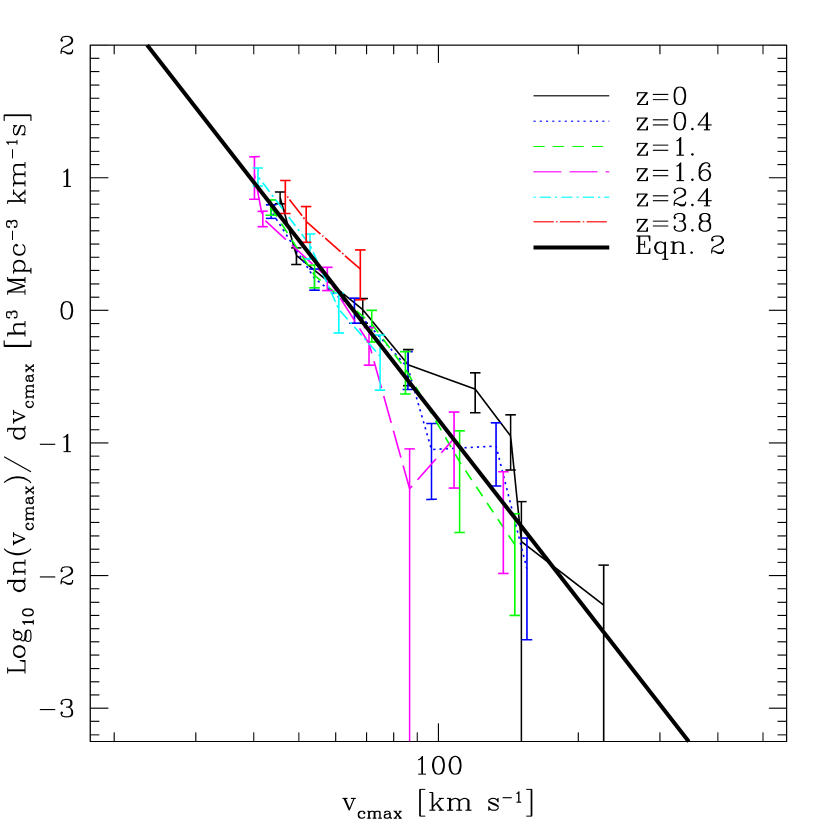
In Fig. 6, we present the non-normalized differential VDF for our entire set of subhaloes, which displays little or no redshift evolution in comoving space. The subhalo VDF is fit by
| (2) |
for subhaloes of 20–300 in hosts of 1011 to 1014 and redshifts from zero to two, with scatter of a factor of . This slope of this non-normalized VDF is steeper because lower mass galaxies in the sample have a larger ratio of . The dependence on implies that this non-normalized VDF is unlikely to hold universally. Fig. 7 shows that the non-normalized subhalo VDF for GRP1 has weak or no evolution to .
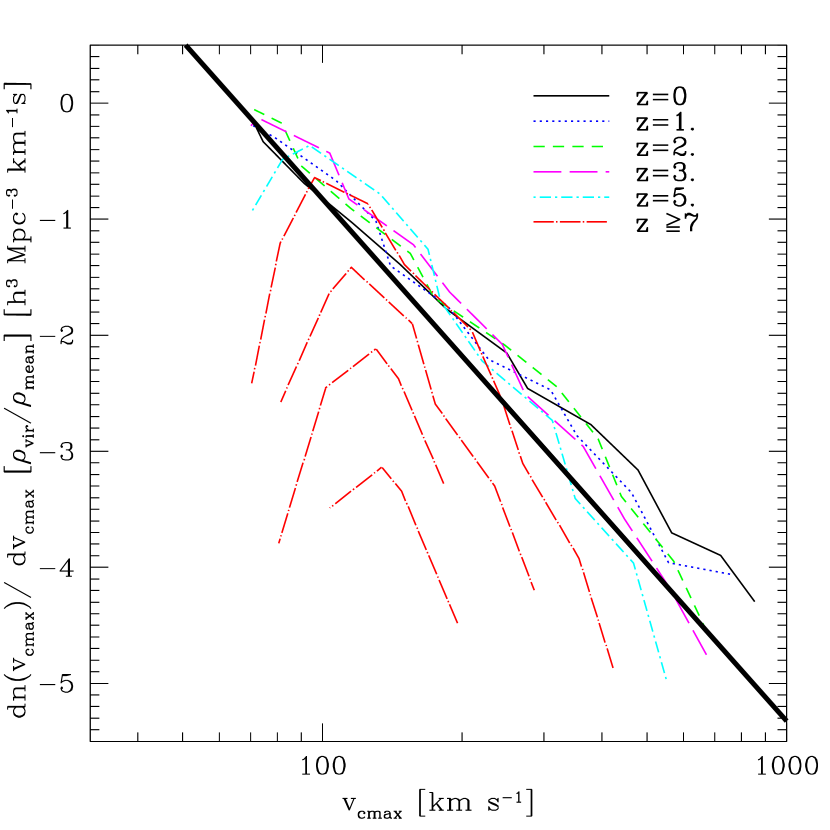
We also calculate the VDF of friends-of-friends (FOF, Press & Davis 1982; Davis et al. 1985) haloes, from which the population of subhaloes must have descended. The FOF algorithm identifies virialized haloes that are not part of larger virialized objects. In Fig. 8, we plot the VDF for all FOF haloes in the CUBEHI simulation adopting a linking length of 0.2 times the mean particle separation. We have normalized the FOF VDF by multiplying it by the mean virial overdensity, , at each redshift. Differences between the subhalo and halo VDFs are generally smaller than a factor of three until , in agreement with results by Gao et al. (2004a). At , the FOF VDF drops rapidly with increasing redshift, presumably due to the fact that it samples the steep drop-off regime of the mass function at high redshift. Higher redshift simulations are needed to test whether the lower FOF VDF at results in small subhalo numbers for extremely high-redshift hosts.
3.2 Subhalo Angular Momenta
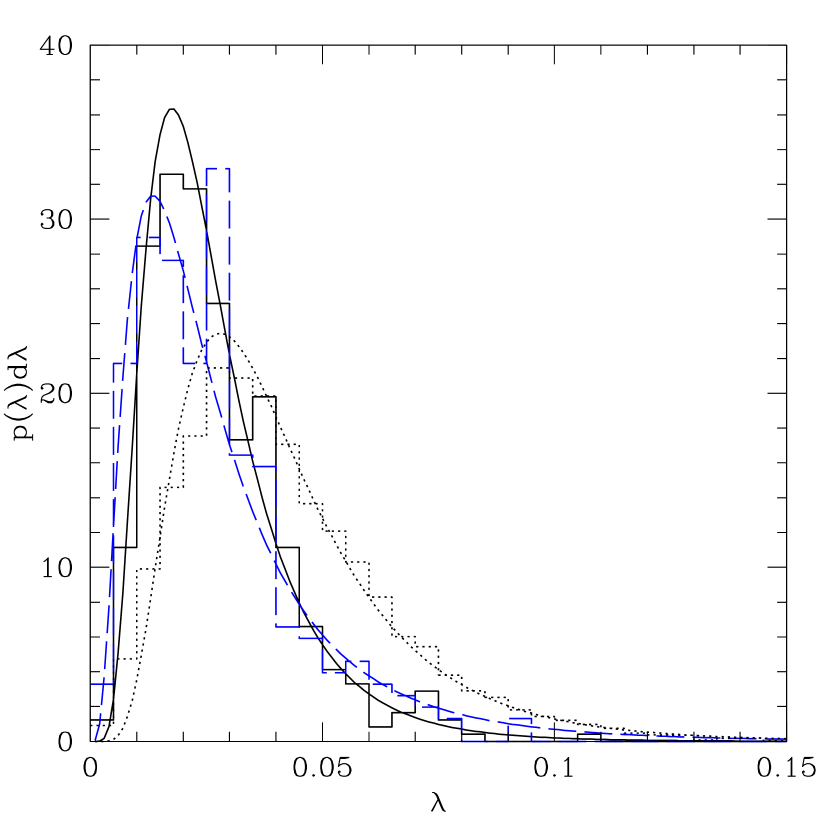
We analyse the subhalo angular momenta given by the spin parameter, (Peebles 1969), for subhaloes at redshift zero in our two highest resolution simulations, GRP1 and CL1. Angular momentum is calculated with respect to the centre of mass of the subhalo. Energy is summed over all subhalo particles. Each central subhalo and subhaloes with more than 50,000 particles (for computational speed) are excluded. In our simulations, median subhalo increases with decreasing particle number once below 100 particles, indicating an upward bias for poorly resolved haloes. We thus limit our spin analyses to subhaloes containing 144 or more particles, which results in no dependence of median spin on subhalo mass. Several studies have found the lognormal function to be a good description of halo spins
| (3) |
(Barnes & Efstathiou 1987; Ryden 1988; Cole & Lacey 1996; Warren et al. 1992; Gardner 2001; van den Bosch et al. 2002; Vitvitska et al. 2002; Colin et al. 2004; Peirani, Mohayaee & Pacheco 2004; Aubert, Pichon & Colombi 2004)) where and are fit parameters. Fig. 9 compares the histogram of subhalo spins with the best-fitting lognormal function given by () (0.0235, 0.54) and (0.0238, 0.73) for halo GRP1 and CL1, respectively. Median and arithmetic average values of and for GRP1 subhaloes, and and for CL1 subhaloes. Subhalo spins are significantly smaller than spins of a sample containing field haloes selected from the CUBEHI volume using the spherical overdensity (SO) algorithm, which has and () (0.037, 0.57) over the mass range of (144–50000) particles. Within this field halo sample and within the subhalo samples, spins have no significant mass dependence, so comparisons between differing mass scales of different simulations should be valid. Our field angular momenta are consistent with a number of recent studies that find for virialized CDM haloes (Bullock et al. 2001; van den Bosch et al. 2002; Vitvitska et al. 2002; Colin et al. 2004; Peirani et al. 2004; Aubert et al. 2004). Note that some of these studies use a slightly different definition of spin introduced by Bullock et al. (2001) that has some dependence on the density profile.
Given that our subhaloes are in high-density environments, it is likely that their spins are lowered by the removal of high angular momentum material, which should be most vulnerable to tidal stripping. We verify that stripping of outer material has the potential to lower spins by the required amounts by measuring spins for the central regions of SO haloes in the CUBEHI volume. Here we find that the central SO region containing 15 the usual virial overdensity has , which is similar to for subhaloes. This overdensity generally contains the central 15–30 of the SO mass. We have also determined that the SO haloes whose central material have the lowest spins relative to the surrounding halo material are the high-spin SO haloes that comprise the tail of the lognormal distribution. This suggests that subhaloes with initially high spins are likely to be the largest contributors to the removal of subhalo angular momentum. Interestingly, the central regions of low-spin SO haloes () generally have higher spin than the surrounding halo material.
An alternative explanation for the low spins of subhaloes may be related to the fact that (sub)halo mass growth is generally halted upon infall into a larger halo. For the case of field haloes, spins decrease over time in the absence of major mergers, particularly in the period immediately following a major merger event (e.g. Vitvitska et al. 2002; Peirani et al. 2004). If a similar decrease in spin occurs in the high density environments within haloes, then it could contribute to the low subhalo spins. More study is needed to determine whether this mechanism for lowering spin is effective for subhaloes.
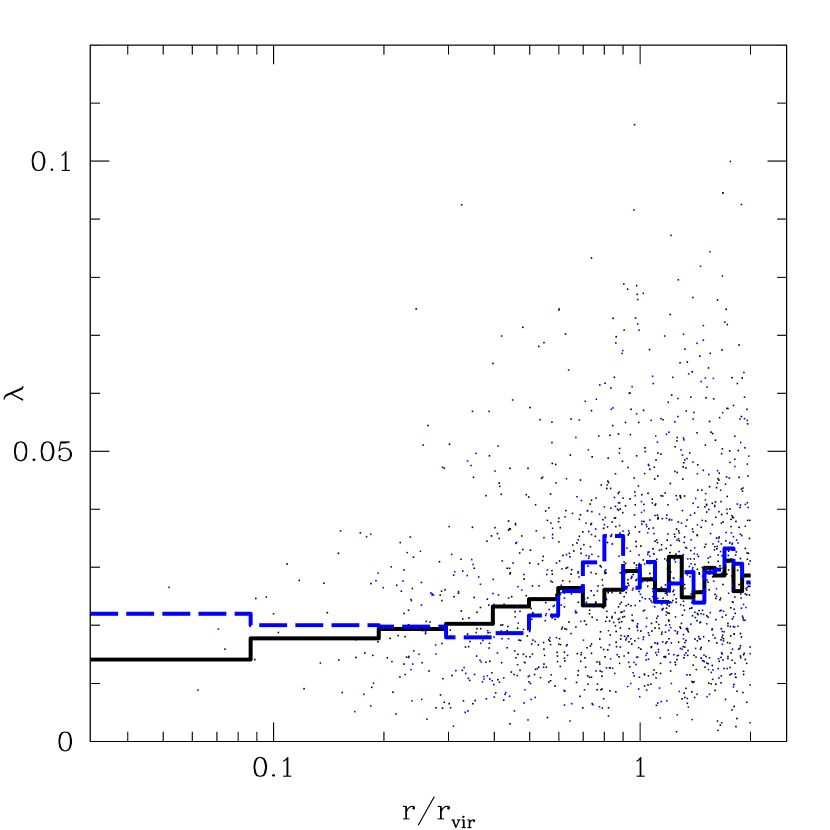
The radial dependence of subhalo spins shown in Fig. 10 shows that local environment directly affects subhalo spin. Median subhalo spin decreases with decreasing radius from near to at 0.3, where tidal effects are greater. The transition in spins from subhaloes to field haloes at is smooth, and spins of SKID haloes found between and 2 have weak or no further radial dependence. Note that the median SKID halo spin between and 2 is somewhat smaller than for SO haloes selected from the uniform volume. We have tested that when the field SO haloes of the large volume (CUBEHI) are instead selected with SKID, their spins are smaller than with SO, but only by , which is not enough to explain the small spins found in the high-density regions. This suggests that field haloes in the high-density environments just outside of larger virialized haloes have spins that are 10 lower than for the global population. Spins in high-density regions could be reduced due to a contribution from subhaloes whose orbits have previously taken them within the virial radius (Gill, Knebe & Gibson 2005), causing stripping of high angular momentum material. Additionally, tidal interactions with the massive neighbouring halo (Gnedin 2003; Kravtsov, Gnedin & Klypin 2004b) may also have some impact on spin. This relatively weak environmental dependence on field halo spins is still consistent with Lemson & Kauffmann (1999), who found no difference in spins of virialized haloes in mild over(under)-densities.
The radial trend in spins could be observable if reliable spins can be estimated for a large sample of cluster galaxies or satellites in external systems, and if spin of baryonic material can be used as a tracer of subhalo spin. Galaxies that form from low spin material should have larger collapse factors. If star formation occurs after subhalo angular momentum has been lowered, then galaxies nearer to host centres may thus have smaller radial extent than galaxies near or outside the virial radius, although complex baryonic processes related to star formation may dominate over any potential spin-induced trend in stellar distribution (see Stoehr et al. 2002; Hayashi et al. 2003; Kazantzidis et al. 2004). The central galaxy would likely deviate from this trend since it undergoes late mergers, which have been shown to increase halo angular momentum (Gardner 2001; Vitvitska et al. 2002).
A radial trend in subhalo spins is unlikely to be easily observable unless the stellar component of a galaxy is assembled subsequent to infall and stripping of high spin material. If gas infall, star formation, and disc growth all cease soon after infall, then spins of galaxies hosted by subhaloes would only reflect the spin of the original dark matter halo. If however, sufficient gas remains after accretion into another dark matter halo that there is some continuing star formation (as for Galactic satellites), then the stellar and gaseous distribution may have a smaller spin than that of the dark matter host prior to infall. Numerical simulations are needed to determine the extent that subhalo baryonic spins reflect the spins of their host dark matter subhaloes.
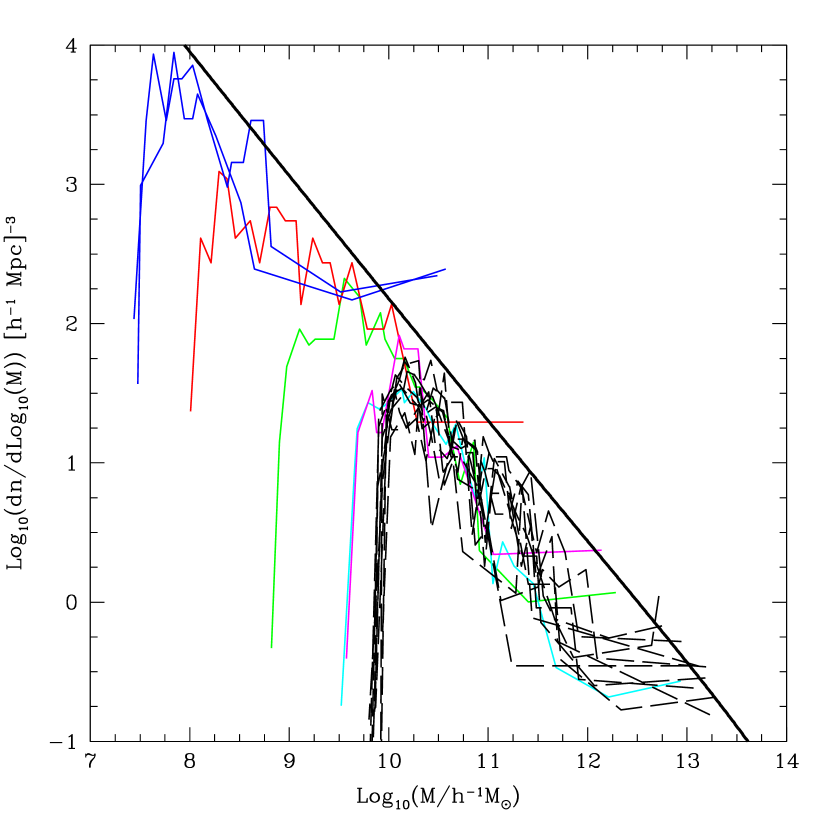
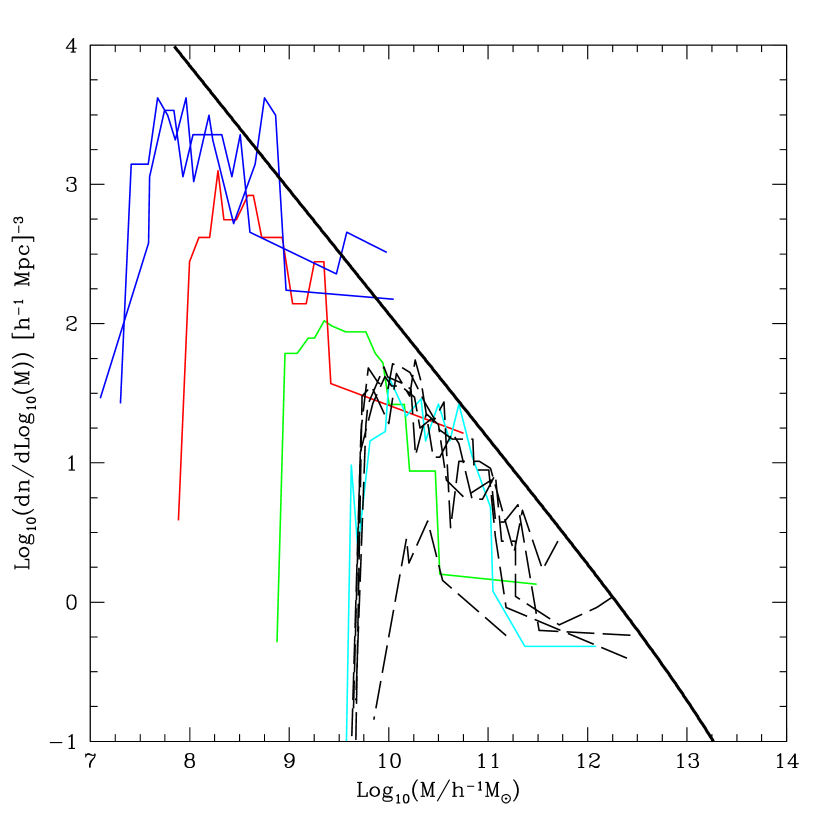
3.3 Subhalo Mass Function
We plot the subhalo mass function at (Fig. 11) and at (Fig. 12). The steep drop on the low mass end for each halo is due to exclusion of haloes with for each simulation. The subhalo mass function is independent of halo mass, a result also seen in De Lucia et al. 2004, although a weak mass-dependence such as that reported by Gao et al. 2004a is not ruled out by our data. The Sheth and Tormen (1999) function normalized by a factor equal to the virial overdensity, is plotted for reference. The Sheth and Tormen function, a modification of the Press and Schecter (1974) formalism, is an excellent match to the CUBEHI FOF mass function at low redshifts (Reed et al. 2003). The factor of approximately two to three offset between the subhalo mass function and the FOF mass function is independent of mass and redshift, which implies that the stripping efficiency of subhaloes is largely mass and redshift independent, though infall timing and evolution of the global mass function may also affect the subhalo mass function.
3.4 Radial Distribution and Subhalo Orbits
In Fig. 13, we show the distribution of subhalo versus radial position for a range of redshifts. There are no clear radial trends in for . However, Fig. 14 shows that subhaloes near the centres of their hosts tend to have lower median masses than subhaloes at larger radii, a trend consistent with e.g. Taffoni et al. (2003) (see also De Lucia et al. 2004; Taylor & Babul 2004; Kravtsov et al. 2004b; Gao et al. 2004a), indicative of tidal stripping near halo centres (e.g. Tormen, Diaferio & Syer 1998). This suggests that the morphology-radius relation seen in clusters (e.g. Whitmore & Gilmore 1991) cannot be explained by a -radius relation. We note that the region where the median mass is smallest (less than 0.3rvir is also the least numerically robust, discussed in section 2.3.
In Fig. 15, we show the circularity of subhalo orbits, , which is the angular momentum that a subhalo with a given orbital energy would have if it were on a circular orbit. Orbits are calculated from a snapshot position and velocity of each substructure applied to a static spherical approximation of the host halo potential, which is computed from the mass profile as in Ghigna et al. (1998). Our subhaloes have mean circularities between 0.6 to 0.7 where sampling is high, with a redshift zero mean for . The subhalo circularity increases weakly at small radii for lower redshifts, suggesting circularisation of orbits over time as seen in simulations by (Gill et al. 2004). Also, there are a larger number of subhaloes in the nearly circular orbits than in the most radial orbits, especially at low redshift. Both of these trends may be a result of disruption or heavy stripping of subhaloes on extremely radial orbits since they pass nearer the cluster central potential. This effect would be greatest for subhaloes with small apocentres. In Fig. 16, we present the circularity as a function of . Again, there are no strong trends, except that small subhaloes with very radial orbits appear to be relatively deficient, especially at low redshift.
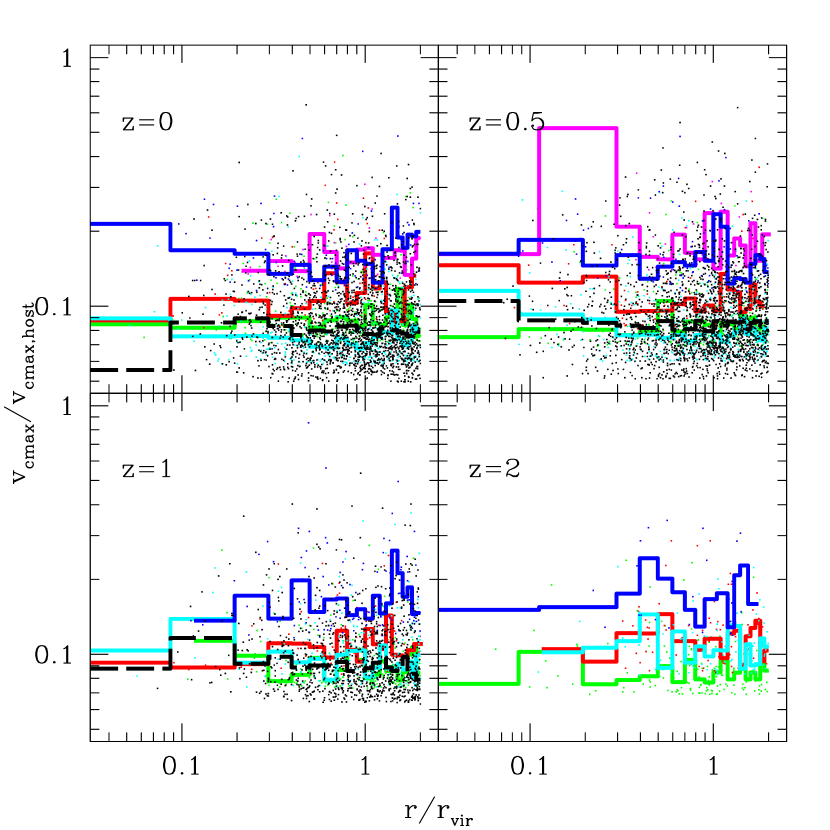
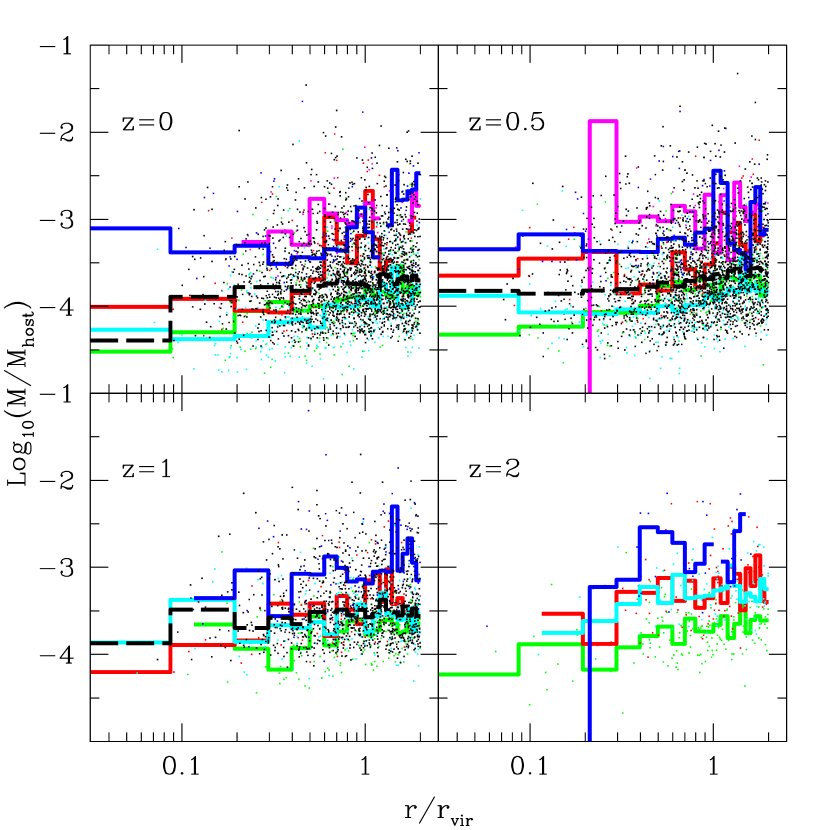
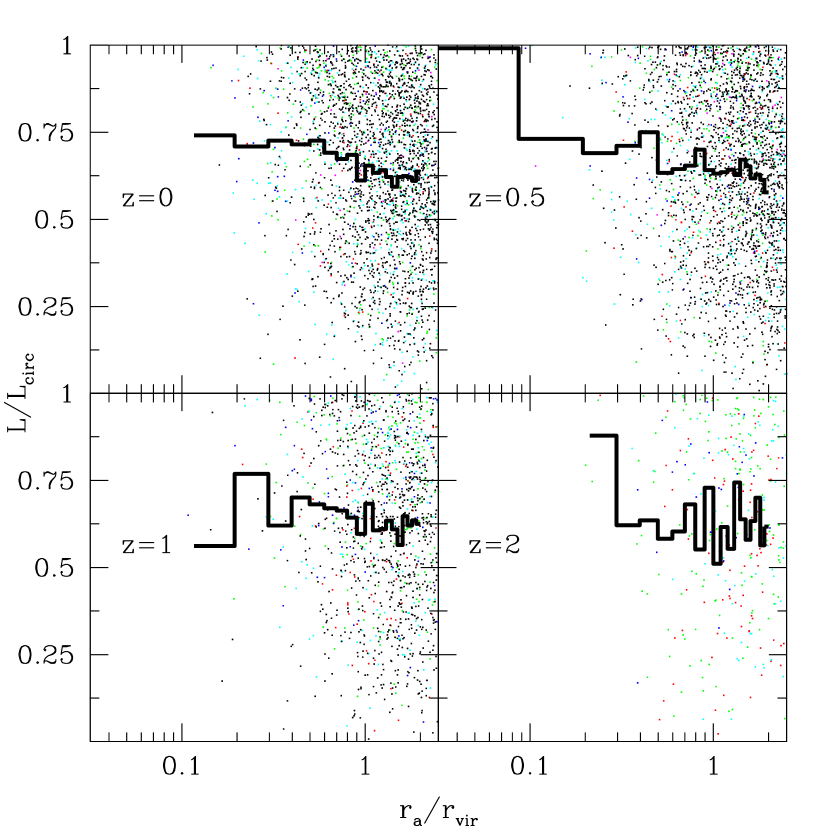
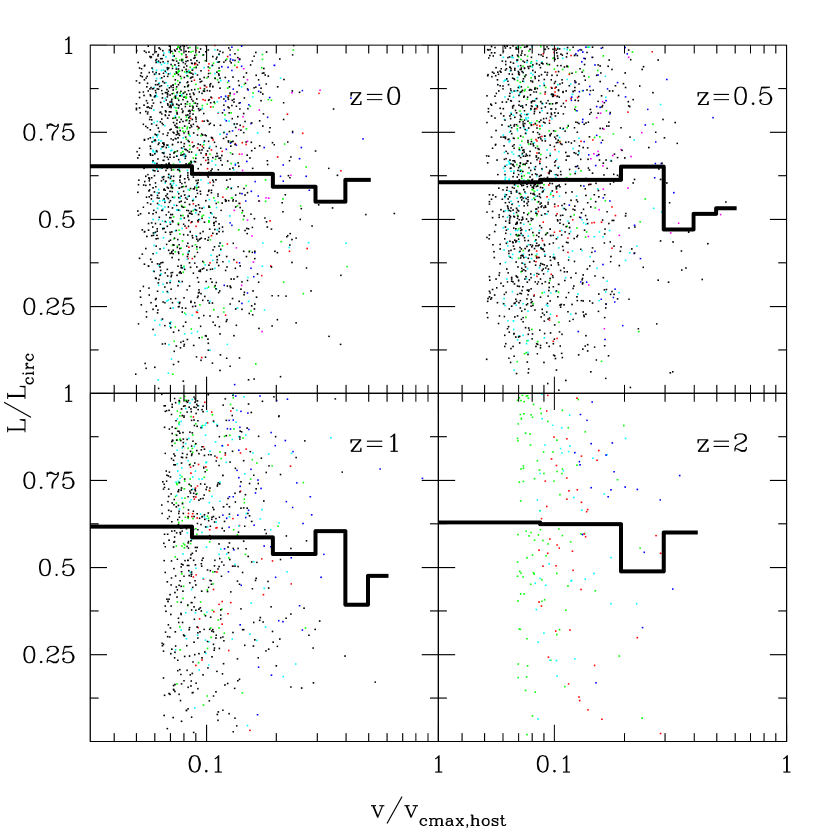
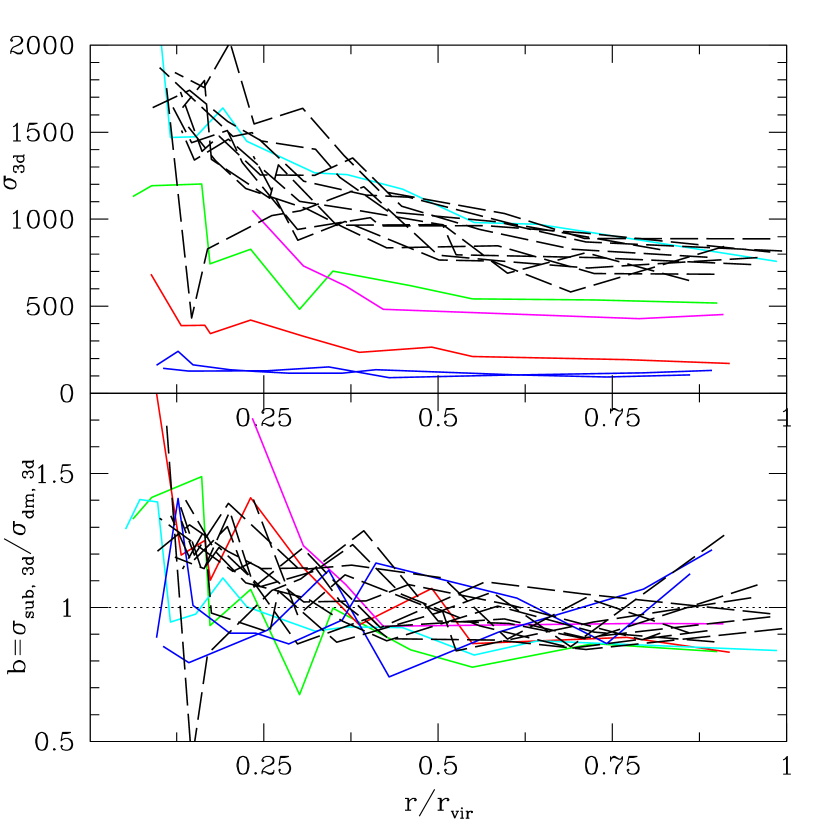
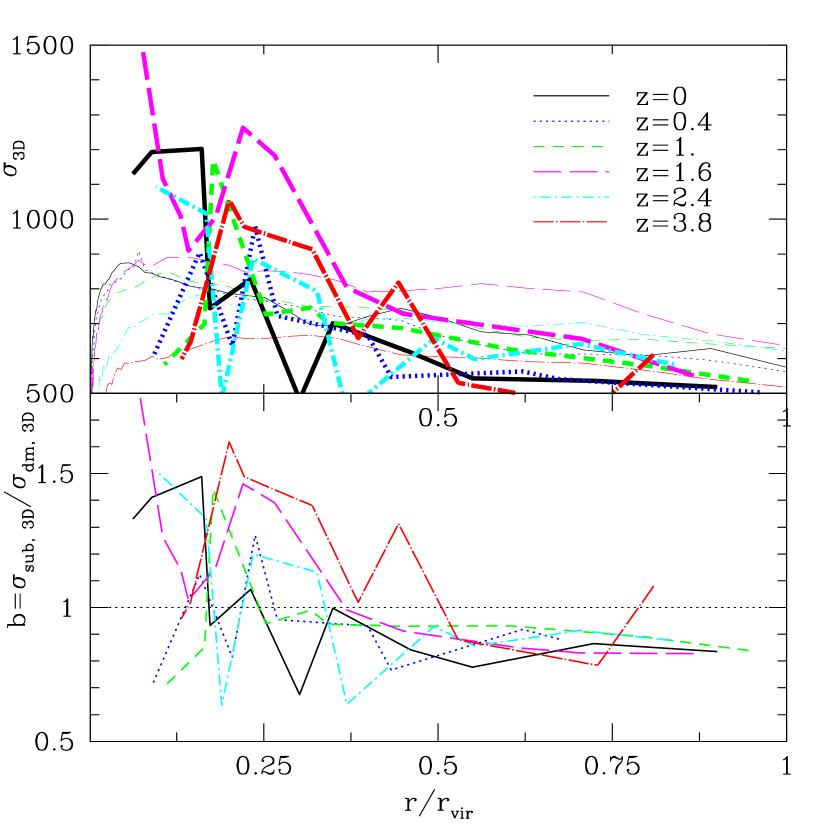
Fig. 17 shows the three dimensional velocity dispersion of subhaloes, , as a function of radius at redshift 0. The velocity dispersion is flat or slowly decreasing with radius at . At smaller radii, generally increases moderately toward the centre, reaching less than 1.5–2 . Subhalo orbital motions suggest a velocity bias b= (bottom panel of Fig. 17) that increases with decreasing radius, reaching by , similar to that found in e.g. Colin, Klypin, & Kravtsov (2000), Ghigna et al. (2000), and Diemand et al. (2004b). Diemand et al. attribute both their central velocity bias and their central spatial anti-bias to tidal destruction of slow moving subhaloes near the cluster centre. Note that in a dynamically relaxed system, a spatial anti-bias automatically results in a positive central velocity bias (see e.g. van den Bosch 2004). At radii , there is also a hint of a weak velocity anti-bias of in many haloes, although subhalo velocities are consistent with no large radius anti-bias when the range of halo to halo scatter and uncertainty due to small numbers of subhaloes is considered. In Fig. 18, we plot the subhalo for GRP1 to redshift 4 against for particles. The subhalo velocity bias and are each consistent with no redshift evolution.
3.5 Power Law Cosmologies
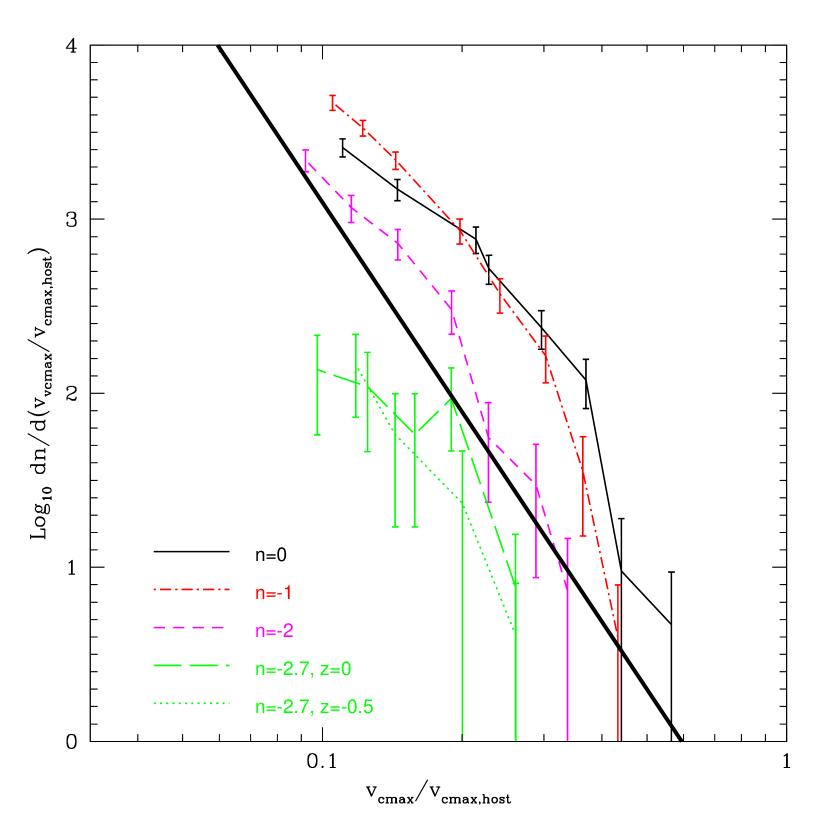
In order to examine the effects of the power spectral slope index, , we have simulated a single renormalized volume cluster with a range of values for . Here the initial density fluctuation power spectrum is given by , normalized to as in the CDM simulations. We plot the subhalo VDF for the cluster with initial conditions given by 0, -1, -2, and -2.7 in Fig. 19. There is a clear and strong trend that steeper power spectra have less substructure. This is a direct result of the fact that the shallower spectra have more small scale power relative to large scale power than the steeper spectra. Additionally, subhaloes form earlier in cosmologies with flatter power spectra, and have higher characteristic densities and steeper density profiles (e.g. Reed et al. 2005), making them less vulnerable to disruption.
4 Conclusions
(1) A “universal” subhalo VDF independent of host mass and redshift: The subhalo follows the self-similar relation: with a factor of two to four scatter.
(2) Subhalo spins decrease toward the host centre. The radial dependence of subhalo spins is likely explained by the increased vulnerability of high-spin material to tidal stripping and disruption. Galaxies that form from low angular momentum subhaloes in high-density regions after some stripping has occurred would have a larger baryonic collapse factor. If we assume the size of the stellar distribution is proportional to (as in e.g. Kravtsov et al. 2004b), then stellar systems could be 50 smaller if they form in heavily stripped central subhaloes. This would require that star formation continue after the subhalo has been stripped of high angular momentum material, as discussed previously. The circular velocity of the final stellar distribution could be lowered by a similar amount if the stars collapse to a small radius, assuming a central subhalo density slope near r-1 as found in simulations by Kazantzidis et al. (2004). Stoehr et al. (2002) proposed that the the apparent deficit of local group satellites could be explained if satellites actually reside in large subhaloes (further supported by Hayashi et al. 2003), which would allow the VDF of large Local Group satellites to match CDM predictions. The small radii of the stellar distribution would give them low stellar velocity dispersion relative to of their dark matter subhalo hosts. Baryonic spins of would be required for the gas to collapse to the required 1 of the pre-stripped virial radius of the dark subhalo (Kazantzidis et al. 2004) needed to match Local Group satellites with CDM predictions. However, only 5 of our subhaloes have spins of , and 90 have , so such a solution appears unlikely if the steep central substructure density profiles found by Kazantzidis et al. are correct.
(3) Evidence for redshift dependence of the VDF: The shape and amplitude of the subhalo VDF has little or no trend with mass or redshift. However, fewer subhaloes lie at large in high-redshift hosts. This implies that dark matter haloes are not populated with large subhaloes until lower redshifts.
(4) Could the VDF be a function of ? Though our data is consistent with only a weak or no trend of the VDF on host mass and redshift, a trend of less substructure in large haloes would not be surprising, although it remains somewhat speculative until simulations are able to probe a larger mass and redshift range. The subhalo population approximately follows some fraction of the universal halo population. Thus, at large , where the mass function is steep, the subhalo mas function should also be steep. The reason we see no such trend among redshift zero haloes in our sample may be because for our simulated haloes is never much larger than unity, below which the slope of the field mass function has little mass dependence.
A dependence of substructure internal density profiles on could also cause a trend for large hosts to have decreased substructure. Virialized haloes have density profiles that become less centrally concentrated with increasing (see e.g. Reed et al. 2005), so subhalo density profiles are likely to have a similar dependence. The lower central densities of low subhaloes should make them more vulnerable to stripping and major disruption during and after virialization, even though their hosts also have lower central densities. The potential decrease in substructure at large may be manifested in our highest redshift data (Fig. 5) where . We note however that our power law cosmology shows that the substructure abundance is also strongly dependent on the spectral slope. The fact that low-mass haloes sample steeper portions of the density power spectrum might cancel out any substructure dependence on , though the range of spectral slopes present over our halo mass range is quite small. Also, because low mass haloes generally form earlier, one might expect them to have less substructure because their subhaloes have been subject to tidal stripping and disruption for longer periods of time.
(5) Is there a central subhalo “anti-bias”? The slope of the subhalo number density is marginally consistent with that of the mass density for r0.3 , although a subhalo distribution that is shallower than the dark matter profile is favoured. More high-resolution simulations are needed to conclusively demonstrate a subhalo anti-bias at large radii. At smaller radii, subhaloes are deficient, but artificial numerical effects cannot be excluded. It is not surprising that more tidal stripping has occurred for subhaloes at small host radii, as reflected in the mass-radius trend of Fig. 14 and seen also by e.g. Gao et al. (2004a). One would also expect that the removal of sufficiently large masses would lead to a radial trend in , although such a radial trend may be masked by the preferential destruction of low haloes at small radii in our results. In any case, since subhaloes are likely to have steep cuspy density profiles down to less than 1 upon initial infall, as suggested by numerous studies of the density profiles of virialized haloes (e.g. Reed et al. 2005), then their centres will be highly resistant to tidal disruption. Thus, any appearance of subhalo “anti-bias” in current generation simulations is likely to be simply a manifestation of a radial trend in subhalo mass (or ). The imposition of an arbitrary minimum mass (or minimum ) as required by resolution constraints can give the false impression of “missing” central subhaloes (see also Gao et al. 2004b for a detailed discussion).
(6) Subhaloes have no strongly preferred orbits. Orbital properties show no strong trends with respect to radius, redshift, or . However, the subhaloes on the most highly eccentric orbits become less abundant over time, likely due to disruption or heavy stripping by the central potential of the host, but this only affects a small fraction of total subhaloes. Subhaloes with small apocentres are most strongly affected. This likely has an artificial numerical cause wherein tidally affected subhaloes either lose enough material that they drop below resolution constraints, or are completely disrupted due to the effective density ceiling imposed upon simulated subhaloes. Our results also suggest that subhaloes have a positive velocity bias at small radii and little or no velocity bias at large radii. It is not clear how the addition of baryons in the form of gas and stars would affect orbital kinematics and distribution of the subhalo population.
(7) Cosmological variance is too small to account for “missing” satellites. The subhalo VDF has a halo to halo cosmological variance of a factor of roughly two to four. This means that the apparent problem of overpredicted local group satellites cannot be solved by invoking cosmological variance.
Acknowledgments
We would like to thank the referee for insightful suggestions which have improved this work. We thank Lucio Mayer for assistance with one of the runs. We are grateful to Frank van den Bosch, Felix Stoehr, and Stelios Kazantzidis for helpful suggestions upon reading a draft of this paper. DR has been supported by the NASA Graduate Student Researchers Program and by PPARC. FG is a David E. Brooks Research Fellow. FG was partially supported by NSF grant AST-0098557 at the University of Washington. TRQ was partially supported by the National Science Foundation. Simulations were performed on the Origin 2000 at NCSA and NASA Ames, the IBM SP4 at the Arctic Region Supercomputing Center (ARSC) and at CINECA (Bologna, Italy), the NASA Goddard HP/Compaq SC 45, and at the Pittsburgh Supercomputing Center. We thank Chance Reschke for dedicated support of our computing resources, much of which were graciously donated by Intel.
References
- (1) Aubert D., Pichon C., Colombi S., 2004, MNRAS, 352, 376
- (2) Bardeen, J.M., Bond, J.R., Kaiser, N., Szalay, A.S., 1986, ApJ, 305, 15.
- (3) Barnes J. E., Efstathiou G., 1987, ApJ, 319, 575
- (4) Bennett C. L. et al. , 2003, ApJS, 148, 1
- (5) Benson A., Lacey C., Baugh C., Cole S., Frenk C., 2002a, MNRAS, 333, 156B.
- (6) Benson A., Frenk C., Lacey C., Baugh C., Cole S., 2002b, MNRAS, 333, 177B.
- (7) Bentley J. L., 1975, Communication of the ACM 18, 9
- (8) Bullock J. S., Kravtsov A. V., Weinberg D. H., 2000, ApJ, 539, 517.
- (9) Bullock J. S., Dekel A., Kolatt T., Kravtsov A., Klypin A., Porcianni C., Primack J., 2001, ApJ, 555, 240
- (10) Chiba M., 2002, ApJ, 565, 17
- (11) Cole S., Lacey C., 1996, MNRAS, 281, 716
- (12) Colin P., Klypin A., Kravtsov K., 2000, ApJ, 539, 561
- (13) Colin P., Klypin A., Valenzuela O., Gottlober S., 2004, ApJ, 612, 50
- (14) Dalal N., Kochanek C. S., 2002, ApJ, 572, 25
- (15) Davis, M., Efstathiou, G., Frenk, C.S., White, S.D.M., 1985, ApJ, 292, 381
- (16) De Lucia G., Kauffmann G., Springel V., White S. D. M., Lanzoni B., Stoehr F., Tormen G., Yoshida N., 2004, MNRAS, 348, 333
- (17) Desai V., Dalcanton J. J., Mayer L., Reed D. S., Quinn T., Governato F., 2004, MNRAS, 351, 265
- (18) Diemand J., Moore B., Stadel J., Kazantzidis S., 2004a, MNRAS, 348, 977
- (19) Diemand J., Moore B., Stadel J., 2004b, MNRAS, 352, 535
- (20) Eke, V.R., Cole, S., Frenk, C.S., 1996, MNRAS, 282, 263
- (21) Font A. S., Navarro J. F., Stadel J., Quinn T., 2001, ApJ, 563, L1
- (22) Gao L., White S.D.M., Jenkins A., Stoehr F., Springel V., 2004a, MNRAS, 355, 819
- (23) Gao L., De Lucia G., White S.D.M., Jenkins A., 2004b, MNRAS, L1
- (24) Gardner J. P., 2001, ApJ, 557, 616
- (25) Ghigna S., Moore B., Governato F., Lake G., Quinn T., Stadel J., 1998, MNRAS, 300, 146
- (26) Ghigna S., Moore B., Governato F., Lake G., Quinn T., Stadel J., 2000, 544, 616
- (27) Gill P., Knebe A., Gibson B., Dopita M., 2004, MNRAS, 351, 410
- (28) Gill P., Knebe A., Gibson B., 2004a, MNRAS, 351, 399
- (29) Gill P., Knebe A., Gibson B., 2005, MNRAS, 356, 1327
- (30) Gnedin O., 2003, ApJ, 582, 141
- (31) Goto T., Yamauchi C., Fujita Y., Okamura S., Sekiguchi M., Smail I., Bernardi M., Gomez P., 2003, MNRAS, 346, 601
- (32) Hayashi, E., Navarro, J., Taylor, J., Stadel, J., Quinn, T, 2003, ApJ, 584, 541
- (33) Katz N., White S., 1993, ApJ, 412, 478
- (34) Kazantzidis S., Mayer L., Mastropietro C., Diemand J., Stadel J., Moore B., 2004, ApJ, 608, 663
- (35) Klypin A., Kravtsov A., Valenzuela O., and Prada F., ApJ, 522, 82, 1999.
- (36) Kravtsov A., Berlund A., Wechsler R., Klypin A., Gottlober S., Allgood B., Primack J., 2004a, ApJ, 609, 35
- (37) Kravtsov A., Gnedin O., Klypin A., 2004b, ApJ, 609, 482
- (38) Lacey C., Cole S., 1994, MNRAS, 271, 676
- (39) Lemson G., Kauffmann G., 1999, MNRAS, 302, 111
- (40) Mao S., Schneider P, 1998, MNRAS, 295, 587
- (41) Mao S., Jing Y., Ostriker J., Weller J., 2004, ApJ, 604, L5
- (42) Mayer L., Governato F., Colpi M., Moore B., Quinn T., Wadsley J., Stadel J., Lake G., 2001, ApJ, 547, L123
- (43) Metcalf, R., Madau, P., 2001, ApJ, 563, 9
- (44) Mo H., Mao S., White S. D. M., 1998, MNRAS, 295, 319
- (45) Moore B., Katz N., Lake G., 1996, ApJ, 457, 455
- (46) Moore B., Governato F., Quinn T., Stadel J., Lake G., 1998, AJ, 499, L5
- (47) Moore B., Ghigna S., Governato F., Lake G., Quinn T., Stadel J., Tozzi P., 1999, ApJ, 524, L19.
- (48) Nagai D., Kravtsov A., 2005, ApJ, 618, 557
- (49) Peebles J., 1969, ApJ, 155, 393
- (50) Peirani S., Mohayaee R., Pacheco J., 2004, MNRAS, 348, 921
- (51) Power, C., Navarro, J. F., Jenkins, A., Frenk, C. S., White, S. D. M., Springel, V ., Stadal, J., & Quinn, T., 2003, MNRAS, 338, 14
- (52) Press W.H., Schechter P., 1974, ApJ, 187, 425
- Press & Davis (1982) Press, W. H. & Davis, M. 1982, ApJ, 259, 449
- (54) Reed, D., Gardner, J., Quinn, T., Stadel, J., Fardal, M., Lake, G., & Governato, F., 2003, MNRAS, 346, 565
- (55) Reed, D., Governato, F., Verde, L., Gardner, J., Quinn, T., Merritt, D., Stadel, J., & Lake, G., 2005, MNRAS, 357, 82
- (56) Ryden B. S., 1988, ApJ, 329, 589
- (57) Sheth R. K., Tormen G., 1999, MNRAS, 308, 119
- (58) Spergel D., et al. , 2003, ApJS, 148, 175
- (59) Somerville R., 2002, ApJ, 572, L23
- (60) Springel V., White S. D. M., Tormen G., Kauffmann G., 2001, MNRAS, 328, 726
- (61) Stadel, J, 2001, PhDT.
- (62) Stoehr F., White S. D. M., Tormen G., Springel V., 2002, MNRAS, 335, 84
- (63) Stoehr F., White S. D. M., Springel V., Tormen G., Yoshida N., 2003, MNRAS, 345, 1313
- (64) Syer D., White S. D. M., 1998, MNRAS, 293, 337
- (65) Taffoni G., Mayer L., Colpi M., Governato F., 2003, 341, 434
- (66) Taylor J., Babul A., 2004, MNRAS, 348, 811
- (67) Tormen G., Diaferio A., Syer D., 1998, MNRAS, 299, 728
- (68) Vale A., Ostriker J., 2004, MNRAS, 353, 189
- (69) van den Bosch F. C., Abel T., Croft R., Hernquist L., White S., 2002, ApJ, 576, 21
- (70) van den Bosch F., Yang X., Mo H., 2003, MNRAS, 340, 771
- (71) van den Bosch F., Norberg P., Mo H., Yang X., 2004, MNRAS, 352, 1302
- (72) Verde L., Oh S. Peng, Jimenez R., 2002, MNRAS, 336, 541
- (73) Vitvitska M., Klypin A., Kravtsov A., Wechsler R., Primack J., Bullock J., 2002, ApJ, 581, 799
- (74) Wadsley J., Stadel J., Quinn T., 2004, NewA, 9, 137
- (75) Warren M., Quinn P., Salmon J., Zurek W, 1992 ApJ, 399, 405
- (76) White S. D. M., Rees M. J., 1978, MNRAS, 183, 341
- (77) Whitmore B., Gilmore D., 1991, ApJ, 367, 64
- (78) Willman B., Governato F., Dalcanton J., Reed D., Quinn T., 2004, MNRAS, 353, 639
- (79) Yang X., Mo H., van den Bosch F., 2003, MNRAS, 339, 1057