µm properties of X-ray selected AGN
Abstract
We examine the µm to X-ray color of X-ray–selected AGN as a function of X-ray obscuration and optical classification in the Chandra Deep Field South. The sample consists of the Chandra hard–band detections with – keV flux erg s-1 cm-2. A deep µm mosaic obtained with Spitzer provides mid–infrared fluxes for the sample. Since obscured AGN locally have higher µm/– keV ratios than unobscured AGN, and since X-ray background models predict a large population of obscured AGN, we expect to find many X-ray–hard, IR–bright AGN. Instead, we find that the µm to X-ray flux ratio does not depend on X-ray hardness in the full sample, nor does it differ between narrow–line and broad–line AGN. We identify nearly Compton–thick AGN, and find they have similar µm to X-ray flux ratios compared to the full sample. We consider AGN in the narrow redshift spikes at ; for these AGN, there is some evidence that the flux ratio increases with X-ray hardness. The redshift slice also shows an odd trend, which is also prominent in the full sample: a group of X-ray–hard AGN with very low µm to X-ray flux ratios.
1 Introduction
The hard spectrum of the X-ray background, which peaks at – keV, implies the existence of a large population of obscured active galactic nuclei (AGN) (Madau et al., 1994; Comastri et al., 1995; Gilli et al., 2001). Finding and understanding these obscured AGN is crucial to understanding the accretion history of the universe. These AGN are predicted to be particularly bright in the mid–infrared, as soft X-ray and ultraviolet emission is absorbed by the intervening material and re-emitted by dust. With ISO, Fadda et al. (2002) reported elevated mid–infrared emission from obscured AGN, and Franceschini et al. (2002) found the majority of ISO–detected AGN to be obscured.
Spitzer can test these ideas about the obscuration of AGN and the interplay of the infrared and X-ray backgrounds. In this letter, by studying the Chandra Deep Field South (CDFS), we present a first look at the Spitzer mid–infrared properties of AGN.
2 The Data and Catalogs
We present deep new observations of the CDFS at µm obtained with the Multiband Imaging Photometer for Spitzer (MIPS) (Rieke et al., 2004). These data were obtained with guaranteed time under program 81; the relevant AORs are 8950528, 8951296, 8954112, 8957696, 8958208, 8958464, 8958976, 8959488, 8960000, 8960512, 8961024, and 8961536. Slow scan–map mode was used, achieving an average integration of s. The data were reduced using the DAT package of the MIPS instrument team (Gordon et al., 2004). The resulting mosaic completely overlaps the ′ by ′ Chandra field. The completeness limit, determined by adding artificial sources, is mJy (Papovich et al., 2004). This flux limit is comparable to the noise, which, scaling from Dole et al. (2004), is mJy at the CDFS exposure depth (accounting for detector and confusion noise (Dole et al., 2004).) Thus, the full mosaic is one of the deepest, widest–field µm maps yet obtained.
Sources were extracted from the µm mosaic as described by Papovich et al. (2004). In the arcmin2 region having X-ray exposure times exceeding megaseconds, we detect µm sources brighter than the completeness limit. In the arcmin2 region having Ms X-ray coverage, we detect such µm sources. (The X-ray depth of coverage varies across the field because the observations comprising the full Chandra exposure have different roll angles.)
Two papers currently in preparation will publish µm fluxes for X-ray sources in CDFS (Rigby et al., 2004a, b); most of these sources are within the main sample of this letter.
The Chandra 1 megasecond CDFS is one of the deepest X-ray observations to date. Two reductions and source catalogs exist in the literature. The first is by the CDFS team, who find sources detected jointly by SExtractor and wavdetect (Giacconi et al. 2002, hereafter G02). The second is the CDF North team’s reduction, using the same processing and source extraction as for the North (Alexander et al. 2003, hereafter A03). Their source catalog has sources. A03 compare these two catalogs, finding sources in common. Because the Spitzer cosmological surveys will also target the CDF North, in this paper we use the A03 catalog, to facilitate future comparisons between the North and South fields.
The astrometry of the CDFS Chandra catalogs is excellent. A03 registered their astrometry to the frame of the R-band ESO Imaging Survey (Arnouts et al., 2001); the median separation between X-ray and R–band positions is ″ (A03). Using the same R–band catalog,111From CDS, at http://vizier.u-strasbg.fr we registered our µm mosaic to their astrometric frame by adding a ″ global shift.
The other catalog used in this paper is that of Szokoly et al. 2004 (hereafter S04), who present secure spectroscopic redshifts for X-ray–selected sources in the CDFS. They classify their sources in two ways: based on optical spectra, and based on X-ray luminosity and hardness.
3 Sample Selection
We select hard band (– keV) detections in the CDFS from the catalog of A03; there are . Selecting hard band detections (rather than soft or any-band detections) reduces contamination from non–active galaxies. To further maximize the AGN fraction, we require the hard–band flux to exceed erg s-1 cm-2, which reduces the sample to sources. This is our main sample. None of these sources is classified by S04 as a star or a non–active galaxy. Almost all of these sources are likely to be AGN (see Figure 2 of Barger et al. (2003)); 65 have been identified as AGN by their X-ray hardness and luminosity (which requires a known redshift), and 39 have been identified as AGN by optical spectroscopy.
Because the soft band of Chandra (– keV) is more sensitive than the hard band, sources in our main sample generally have a well–measured soft-band flux or a well–constrained limit.
For the main sample, we seek redshifts as available from S04. S04 targeted optical counterparts to X-ray sources from the G02 catalog (and thus associate redshifts with G02 X-ray sources), whereas we use the A03 X-ray catalog. As a result, it is necessary to associate the A03 and S04 catalogs, which we do by matching sources whose coordinates are separated by less than ″. Such a large separation is necessary to match sources at large off–axis angles, where Chandra centroiding is difficult. Since the only spectra in the S04 catalog are counterparts to X-ray sources, the source density is small ( arcmin-2), so the probability of false matches with the A03 X-ray catalog is small. In the main sample, AGN have secure redshifts and optical classifications.
For each X-ray source in our main sample, we search for a µm counterpart from our catalog. To claim detection, we require the fractional flux uncertainty to be and the coordinates (X-ray and µm) to be offset by ″. (This small separation is sufficient to match sources over most of the field, and is necessary to prevent false matches, since the µm source density is high.) No X-ray source has multiple µm sources within the permitted offset. Given the µm source density reported above, for the main sample of X-ray sources, by chance we expect false µm counterpart using the P-statistic (see e.g. Lilly et al. (1999)). The result of the counterpart search is that of the sources in the main sample have µm counterparts. For sources not detected at µm, we take the flux upper limit to be the completeness limit ( mJy).
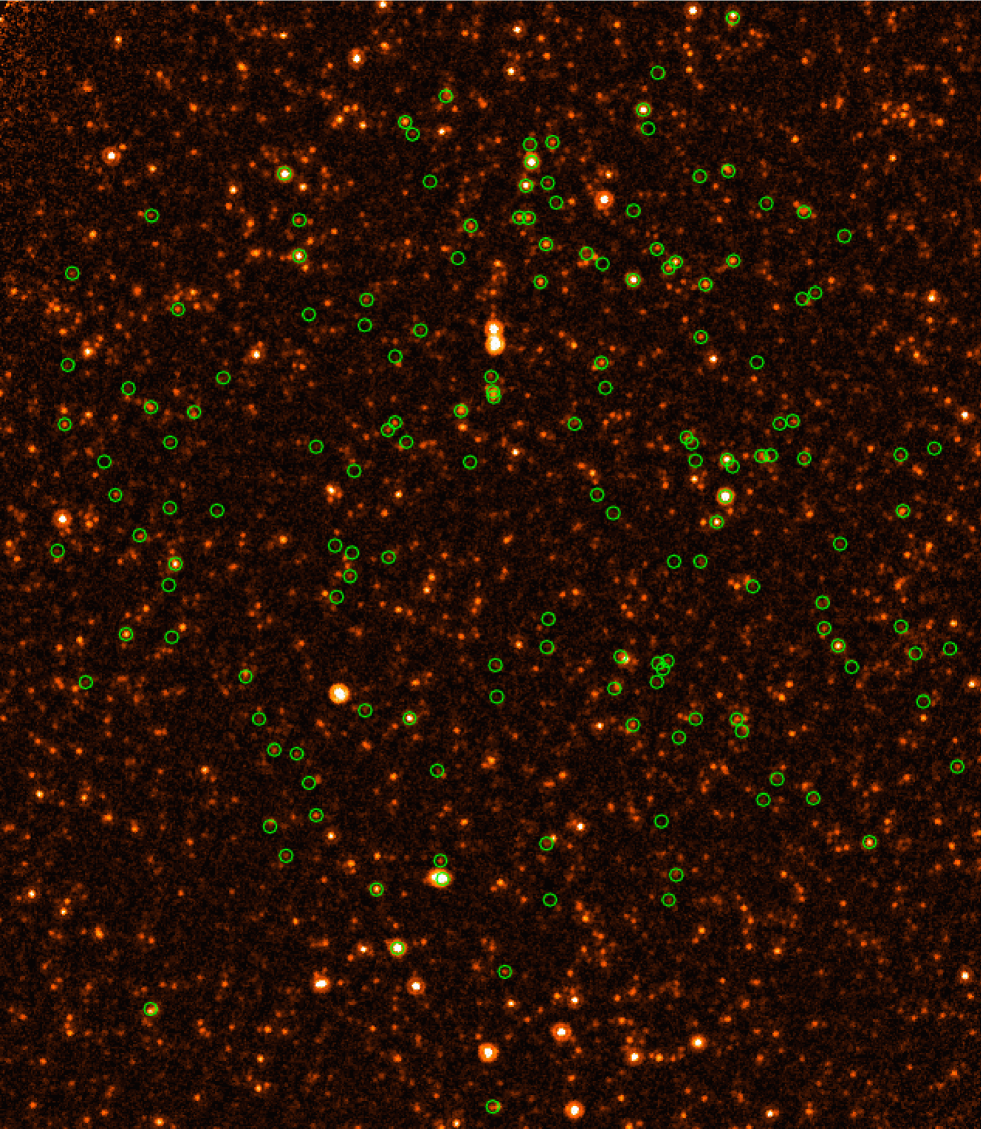
Figure 1 displays the section of the µm mosaic that overlaps the Chandra field, with the main sample X-ray positions overlaid.
4 Comparing X-ray and µm colors
AGN are traditionally classified by optical spectroscopy. However, for distant sources, nuclear emission can be overwhelmed by stellar emission, especially for low–luminosity AGN (Moran et al., 2002). Obscuration or lack of the narrow lines may also play a role (Maiolino et al., 2003). Consequently, of X-ray selected AGN in the CDFS are not classified as active by optical spectroscopy (S04). Because of this, many authors have argued that X-rays are a better way to select AGN than optical spectroscopic surveys.
Further, X-rays may be a more effective way to classify AGN (Hasinger et al., 2001). AGN with harder X-ray spectra are generally measured to have thicker columns of absorbing gas than do X-ray–soft AGN. Similarly, in unification models, optical Type 2 AGN are drawn from the same population of objects as Type 1 AGN, but they are viewed through thicker columns of obscuring gas and dust. Thus, X-ray hardness can estimate the obscuration of AGN when optical spectroscopy cannot.
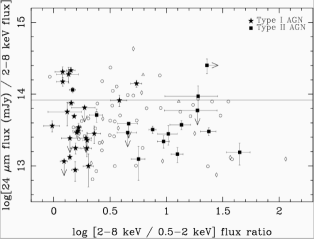
Figure 2 compares optical and X-ray classification of the CDFS AGN. The x-axis is an indicator of spectral hardness: the ratio of the – keV flux to the – keV flux, which we define as H/S [flux(– keV)/flux(– keV)]. Sources with broad emission lines (optically–selected Type 1 Seyferts and QSOs) cluster toward the X-ray–soft side of the figure. These objects are well–separated in X-ray hardness from the sources with optical high–excitation narrow emission lines (optically–selected Type 2 AGN), which span a range of higher X-ray hardness. This clear separation validates the use of the hard/soft X-ray flux ratio H/S as a tool to classify AGN, as also found by Mainieri et al. (2002). Indeed, S04 also used X-ray hardness to classify these CDFS AGN, using the same Chandra data and very similar energy bands to this work, but a counts ratio rather than a flux ratio; their division between Type 1 and Type 2 AGN lies at H/S in our Figure 2, and agrees well with the boundary between optically classified Type 1 and 2 AGN.
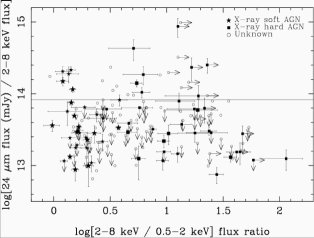
In Figure 3, we now examine how H/S affects the behavior of the µm to X-ray flux ratio, defined as 24/X [(µm flux density, mJy)/(– keV flux, erg s-1 cm-2)]. There is a factor of spread in both the H/S and 24/X flux ratios. The spread in H/S reflects the range of X-ray hardness found in AGN. The reasons for the spread in the 24/X flux ratio we discuss below.
The horizontal line in Figures 2 and 3 is the 24/X color of a source with hard X-ray flux at the sample cutoff, and µm flux at the completeness limit. Since the sample is X-ray selected, we are reasonably complete to colors above the line, while we may be missing sources with colors below the line (because the µm flux may fall below the detection limit.)
Figures 2 and 3 show that overall, the µm- keV flux ratio does not depend on the hardness of the AGN. There is no global trend of the 24/X flux ratio with H/S. Nor does the 24/X ratio differ significantly between the X-ray–classified hard and soft AGN in Figure 3, nor between the optically–classified Type 1 and Type 2 AGN in Figure 2.
Fadda et al. (2002) found that – keV XMM sources were twice as likely to have µm counterparts compared with – keV sources; however, this result was based on just IR–detected hard X-ray sources. The authors used the IR/X-ray spectral slope to classify sources as Type 1 or Type 2 AGN or dominated by star formation, and then applied these classifications to estimate the AGN contribution to the IR background. (They did find some X-ray–soft AGN with high IR/X ratios, which they attributed to host galaxy contamination.) As discussed above, our full sample (Figure 3) contradicts the Fadda et al. (2002) result that the mid–IR flux of AGN is a strong function of hardness.
5 Discussion
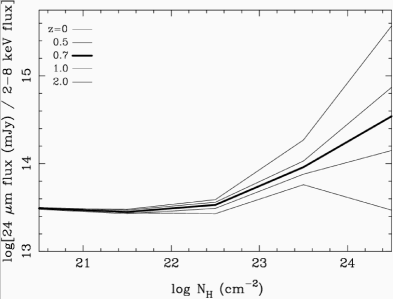
To understand the behavior of the 24/X flux ratio, in Figure 4 we present the flux ratios predicted by local AGN templates with a range of obscuration (Silva et al., 2004). These templates were obtained by interpolating nuclear infrared photometric data of a sample of 33 Seyferts. Each infrared SED was normalized to the absorption–corrected hard X-ray luminosity, and then averaged within bins of absorbing NH. Using these empirical templates, Silva et al. (2004) derived the contribution of AGN to the mid-IR background and successfully matched the observed fraction.
In Figure 4, at as the obscuring column increases, the predicted 24/X ratio increases (since the µm flux rises due to reprocessing and the – keV flux falls dramatically due to absorption.) This effect grows weaker with increasing redshift because of K-corrections: as the – keV band samples progressively higher rest–frame energies, it is less absorbed for a given column. Generally in the deep X-ray surveys, Type 1 AGN have N cm-2, whereas Type 2 have N cm-2 (Gilli, 2003).
A basic conclusion from Figure 4 is that local AGN with cm-2 cannot produce 24/X for . When X-ray–soft AGN are observed to have such high 24/X ratios (as seen for a minority of sources in Figure 3), this suggests that the µm flux is dominated by star formation in the host galaxy, not by accretion. (Some of the harder sources with high 24/X may also be star–formation dominated.) Using this rule of thumb, we see that star formation does not dominate most of the sources in Figure 3; their 24/X ratios are consistent with AGN power. (See also Alonso-Herrero et al. (2004).)
To disentangle the effects of redshift and compare the distant AGN to local templates, in Figure 5 we plot all hard–band detected AGN in the redshift range . This range encompasses the prominent and redshift spikes (S04), which allows us to restrict the redshift range (and thus the spread in K-correction) while maximizing the sample size.
We first examine the X-ray–soft AGN in Figure 5. Their 24/X ratios agree well with the local templates, which predict 24/X for AGN with N cm-2 at this redshift. The spread in template SEDs predicts a scatter in the flux ratio of about in log units, which is consistent with the data.
We now examine the 24/X ratio for the hard (H/S) AGN. We propose two possible interpretations of the trends in Figure 5:
- •
-
•
The 24/X ratio does indeed increase with hardness in this subsample, as expected from reprocessing: H/S have higher 24/X than the H/S AGN. However, there are several strange exceptions: AGN with very hard X-ray flux ratios and very low 24/X.
This population of X-ray–hard AGN with low 24/X is also seen in the full redshift sample (Figure 3), where there are such sources. Their 24/X ratios are – dex lower than predicted by the templates. These sources are surprising within the unification paradigm: the hardness ratios indicate large column density, which unification scenarios associate with a dusty molecular torus; this column should absorb the X-ray radiation, thus increasing the 24/X ratio relative to lower–column AGN. Additionally, dust in the torus should absorb a large fraction of the UV continuum and re-emit that energy in the mid–infrared, further increasing 24/X. In the X-ray–hard µm–faint sources in question, this expectation is not observed. Thus, these sources merit further investigation; there may be a real difference between these AGN and local AGN (for example in their dust properties or absorbing geometries.) Though the average 24/X value for the X-ray–hard AGN may be higher than it appears in Figure 3 due to selection effects, the sources with low 24/X still beg explanation.
While the H/S X-ray flux ratio is a useful diagnostic, the more fundamental parameter is the amount of obscuring column. For the very hard (H/S) AGN with known redshifts, we examine the X-ray spectral information derived by Gilli (2003). Ten of the spectra are fit by N cm-2, while only fits require N cm-2. Those five nearly Compton–thick AGN have 24/X values spanning to , which is the same range populated by the other AGN (soft and hard).
Could we have missed the majority of the highly obscured, high 24/X AGN? Since Compton–thick AGN should be fainter at – keV than less obscured AGN, it is quite possible that the most obscured AGN are the faintest in our survey. The faint (hard flux erg s-1 cm-2) AGN are less likely to have known spectroscopic redshifts and reliable X-ray spectral fits. Since they are faint in the hard band and undetected in the soft, they have lower limits on H/S that permit but do not require extreme hardness. Several such objects have high 24/X. Thus, these AGN are good candidates for being highly obscured. If they are, they would populate the high H/S, high 24/X region of Figure 3 where obscured AGN are expected, but not seen.
6 Conclusions
We present the first look at the µm to X-ray colors of X-ray–selected AGN. The expectation that harder AGN should be relatively brighter at µm is not confirmed. Rather, there is large scatter and no trend in 24/X color with X-ray hardness in our sample of AGN (with dynamic range of 100 in both flux ratios). In addition, the 24/X colors of optically-identified Type 1 and 2 AGN are indistinguishable.
In a narrow redshift slice (picked to minimize differential K-corrections), we see hints that 24/X may increase with X-ray hardness (though this effect is not seen in the full sample). However, in both the restricted–redshift and full samples, we identify AGN with unusual colors: very hard X-ray flux ratios and surprisingly low 24/X ratios. These AGN merit further investigation.
X-ray spectral fits to of the X-ray–hard AGN find column densities of cm-2, most toward the lower end of this range. Thus, only a handful are nearly Compton–thick (N). Even these sources do not distinguish themselves in 24/X color from the lower–column AGN.
Thus, while this initial survey has not yet confirmed expectations for a population of X-ray–obscured, infrared–bright AGN, we have raised new questions: What explains the factor of range in µm to – keV flux ratio? Why do many of the hardest AGN have very low 24/X ratios compared with local templates? And if hard X-ray selection and µm follow–up finds few Compton–thick AGN, what is a better way to search? Future surveys and follow–up observations are clearly needed to address these questions.
References
- Alexander et al. (2003) Alexander, D. M., et al. 2003, AJ, 126, 539
- Alonso-Herrero et al. (2004) Alonso-Herrero et al. 2004, this issue
- Arnouts et al. (2001) Arnouts, S., et al. 2001, A&A, 379, 740
- Barger et al. (2003) Barger, A. J., et al. 2003, AJ, 126, 632
- Comastri et al. (1995) Comastri, A., Setti, G., Zamorani, G., Hasinger, G. 1995, A&A, 296, 1
- Dole et al. (2004) Dole, H., et al. 2004, this issue
- Fadda et al. (2002) Fadda, D., Flores, H., Hasinger, G., Franceschini, A., Altieri, B., Cesarsky, C. J., Elbaz, D., & Ferrando, P. 2002, A&A, 383, 838
- Franceschini et al. (2002) Franceschini, A., Fadda, D., Cesarsky, C. J., Elbaz, D., Flores, H., Granato, G. L. 2002, ApJ, 568, 470
- Giacconi et al. (2002) Giacconi, R., et al. 2002, ApJS, 139, 369
- Gilli (2003) Gilli, R. 2003, to appear in New X-ray Results from Clusters of Galaxies and Black Holes, ed. C. Done et al. (astro-ph/0303115)
- Gilli et al. (2001) Gilli, R., Salvati, M., & Hasinger, G. 2001, A&A, 366, 407
- Gordon et al. (2004) Gordon, K.D. et al. 2004, PASP, submitted
- Hasinger et al. (2001) Hasinger, G., et al. 2001, A&A, 365, L45
- Lilly et al. (1999) Lilly, S. J., et al. 1999, ApJ, 518, 641
- Madau et al. (1994) Madau, P., Ghisellini, G., & Fabian A.C. 1994, MNRAS, 267, L17
- Mainieri et al. (2002) Mainieri, V., Bergeron, J., Hasinger, G., Lehmann, I., Rosati, P., Schmidt, M., Szokoly, G., & Della Ceca, R. 2002, A&A, 393, 425
- Maiolino et al. (2003) Maiolino, R., et al. 2003, MNRAS, 344, L59
- Moran et al. (2002) Moran, E. C., Filippenko, A. V., & Chornock, R. 2002, ApJ, 579, 71
- Papovich et al. (2004) Papovich, C., et al. 2004, this issue
- Rieke et al. (2004) Rieke, G. H., et al. 2004, this issue
- Rigby et al. (2004a) Rigby, J. R., et al. 2004, in preparation
- Rigby et al. (2004b) Rigby, J. R., et al. 2004, in preparation
- Silva et al. (2004) Silva, L., Maiolino, R., Granato, G. L. 2004, MNRAS, submitted (astro-ph/0403381)
- Szokoly et al. (2004) Szokoly, G. P., et al. 2004, ApJS, submitted (paper at astro-ph/0312324, catalog at http://www.mpe.mpg.de/CDFS)