Sub-millimeter detections of Spitzer Space Telescope galaxy populations
Abstract
We present sub-millimeter statistical detections of galaxies discovered in the Spitzer Early Release Observations (to Jy at m, Jy at m) through a stacking analysis of our reanalysed SCUBA 8mJy survey maps, and a Spitzer identification of a new sub-millimeter point source in the 8mJy survey region. For sources detected at m or m ( and sources respectively), we detect positive skews in the sub-millimeter flux distributions at confidence using Kolmogorov-Smirnov tests, at both m and m. We also marginally detect the Spitzer m galaxies at m at confidence, and place limits on the mean sub-millimeter fluxes of the m and m sources. Integrating the sub-millimeter fluxes of the Spitzer populations, we find the m galaxies contribute nW m-2 sr-1 to the m background, and nW m-2 sr-1 to the m background; similar contributions are made by the m-selected sample. We infer that the populations dominating the m and m extragalactic background light also contribute around a quarter of the m background and the majority of the m background.
1 Introduction
The early pioneering sub-millimeter surveys in lensing clusters (Smail, Ivison & Blain 1997) and in blank fields (Hughes et al. 1998, Barger et al. 1998) demonstrated the feasibility of deep extragalactic surveys exploiting the favorable K-corrections in the sub-millimeter. Deep m imaging has now resolved around half of the m extragalactic background (Hughes et al. 1998, Blain et al. 1999, Cowie, Barger & Kneib 2002). These galaxies are often called SCUBA galaxies after the instrument with which they were first detected (Holland et al. 1999). The m SCUBA beam makes identifications at other wavelengths difficult; nevertheless, of m sources are identifiable in Jy GHz imaging (Ivison et al. 2002). These radio identifications have led to optical identifications, morphologies and ultimately spectroscopic redshifts in multiwavelength follow-up campaigns (e.g. Chapman et al. 2003). Furthermore, the non-detection of SCUBA galaxies in hard X-ray imaging (e.g. Alexander et al. 2003) suggests that the bulk of the population has far-infrared luminosities dominated by star formation. The morphologies, redshifts, clustering and molecular gas contents are so far consistent with at least some of the SCUBA population being the progenitors of giant elliptical galaxies (e.g. Dunlop 2002), though other alternatives are still viable (Efstathiou & Rowan-Robinson 2003) and the SCUBA population is heterogeneous (e.g. Ivison et al. 1998, 2000). Finally, the K-correction effects in the sub-millimeter make the sub-millimeter extragalactic background sensitive to contributions from the far-infrared luminous energy densities at all redshifts . The populations which contribute to the m extragalactic background are necessarily also significant contributors to the cosmic history of dust-shrouded star formation.
Following the IRAS mid-infrared surveys of the local Universe (e.g. Rush, Malkan & Spinoglio 1993), the mid-infrared was first made accessible to deep extragalactic surveys by the Infrared Space Observatory (ISO, Kessler et al. 1996) which conducted a suite of surveys with a variety of depths and areal coverages (e.g. Genzel & Cesarsky 2000 and refs. therein, Rowan-Robinson et al. 2004). The rapid upturn in the m extragalactic source counts clearly demonstrated the existence of a strongly evolving population of obscured starbursts and active galaxies (e.g. Serjeant et al. 2000, Franceschini et al. 2001, Gruppioni et al. 2002). It has also been argued that the populations dominating the m extragalactic background light, which are resolved by ISO, are also largely the same populations which dominate the unresolved m background (Elbaz et al. 2002). If correct, this is a significant breakthrough in determining the populations which dominated the far-infrared luminous energy density throughout the relatively recent history of the Universe (e.g. ).
Finding the population that supplies the luminous energy density at requires understanding the sub-millimeter background light. However, it has been difficult to find sub-millimeter source counterparts in the mid-infrared. Very few sub-millimeter-selected sources have been detected by ISO in the mid-infrared (e.g. Eales et al. 2000, Webb et al. 2003b, Sato et al. 2002). The reverse procedure of looking for mid-infrared sources in the sub-millimeter via stacking analyses have not fared much better. Serjeant et al. (2003a) found no excess m flux at the locations of m sources in the HDF North. Lyman break galaxies, in contrast, are detectable statistically (e.g. Peacock et al. 2000, Webb et al. 2003a). If SCUBA galaxies are extreme star-forming galaxies in the most massive high-redshift halos, then their anomalously faint K-band identifications imply heavy obscuration in the observed-frame near-infrared (Serjeant et al. 2003b), suggesting that SCUBA galaxies may be detectable in Jy-level mid-infrared imaging.
The Spitzer Space Telescope (hereafter Spitzer, Werner et al. 2004) is an enormous advance over ISO in terms of mapping speed, sensitivity, and wavelength coverage. It may now be possible to resolve the bulk of the extragalactic background light at m in exposures of the order minutes, an equivalent depth achieved at m in hours with ISO by Sato et al. 2003. In this paper we present statistical sub-millimeter detections of galaxies selected in a new Spitzer survey. The Spitzer identifications of previously-published sub-millimeter sources are discussed by Egami et al. (2004). Identifications of MAMBO sources are discussed by Ivison et al. (2004).
2 Observations
The Spitzer Early Release Observations survey is one of the first extragalactic surveys conducted by Spitzer. Besides the pragmatic goal of characterising the survey capabilities of the facility, the survey has the science goals of making the first constraints on the populations which dominate the extragalactic backgrounds in the shorter wavelength Spitzer bands, and the links between these galaxies and other known populations. Accordingly, the survey field was selected to lie in the Lockman Hole, an area with abundant multi-wavelength survey coverage, and in particular with galaxies from the m 8mJy survey catalog (Scott et al. 2002, Fox et al. 2002, Ivison et al. 2002; see below).
The Spitzer imaging is described by Egami et al. (2004) and Huang et al. (2004). In summary, IRAC (Fazio et al. 2004) imaged a field for s per sky pixel at all four bands, resulting in median depths of Jy, Jy, Jy and Jy at m, m, m and m respectively, and sources were extracted to . MIPS (Rieke et al. 2004) observed the field in photometry mode at m for s per sky pixel, resulting in a typical depth of Jy. Source confusion and blending make the MIPS completeness and reliability more problematic than for SCUBA or IRAC. MIPS source catalogs were extracted to Jy ( complete, reliable) and to Jy ( complete, reliable). We conservatively assume the catalogs are all extragalactic, as expected at these flux densities; the deletion of any (hypothetical) contaminant population of galactic stars with negligible sub-millimeter fluxes would improve the confidence levels of our statistical detections.
The SCUBA 8mJy survey data (which covers all our Spitzer field) is described in detail by Scott et al. (2002). We have reanalysed this data, modelling the intra-night SCUBA gain variations, improving the extinction corrections using improved fits to the GHz skydips monitored at the Caltech Sub-millimeter Observatory, and removing the cross-talking m bolometers A7 and A16 (see Mortier et al. 2004). Additional sources are detectable in the zero-sum chopped/nodded sub-millimeter maps. After point source detection using noise-weighted PSF convolution (Serjeant et al. 2003a) including the effect of negative chop/nod positions, the median depth (total flux) in the Spitzer Early Release Observations field is mJy at m, and mJy at m.
3 Results
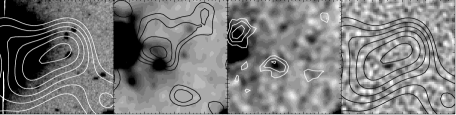
Our reanalysis of the SCUBA 8mJy survey uncovered new candidate sub-millimeter sources (Mortier et al. 2004). Figure 1 shows the Spitzer identifications of the most significant of these, at , (J2000), detected with a m flux of mJy. At m the source is not detected, though the m flux at its position is mJy (); there is also a hint of positive flux at significance at m (Greve et al. 2004) at the position of this source. There are hints that the source is extended at m, suggesting a blend of more than one source, and indeed there are two candidate identifications in the Spitzer imaging. The probabilities of a random association ( where is the surface density of catalogued objects brighter than the identification at distance ) are and for the brighter and fainter m flux respectively. Interestingly, the low-significance contours of m emission are coincident with the brighter of the two candidates. The Spitzer fluxes of this source are , , , Jy and Jy at m, m, m, m and m respectively. The fluxes of the second candidate identification are Jy and Jy at m, and m, but the source is not detected at longer wavelength Spitzer bands. While deblending the fluxes from the two identifications is beyond the scope of this paper, it is interesting to note that either identification would have a sub-millimeter:Spitzer flux ratio which is redder than in the population as a whole, derived below.
The sub-millimeter sources are already known to have Spitzer identifications (Egami et al. 2004), so we construct a mask to remove the sources at these positions from the stacking analysis. At m we masked a radius ( the SCUBA FWHM, i.e. the FWHM of point sources in our PSF-convolved maps) around the m point sources from Scott et al. (2002), as well as the new point sources from our reanalysis (Mortier et al. 2004). At m the masking radius was , which we also applied to new m sources from our reanalysis. We also masked regions with high noise levels, arbitrarily selected as mJy at m, or mJy at m, and also masked all regions in the sub-millimeter maps without Spitzer data. The unmasked area at m (m) is () arcmin2 for the IRAC catalogues. For MIPS, the corresponding area is () arcmin2.
The sub-millimeter maps give the best-fit point source flux at each location (equation A4 of Serjeant et al. 2003a), so we measure the values of the sub-millimeter images at the Spitzer galaxy positions. Figure 2 shows the sub-millimeter signal-to-noise ratios (equation A6 of Serjeant et al. 2003a) at the positions of the Spitzer Early Release Observations source catalogs at m and m, which lie in the unmasked regions. These figures also show histograms for the whole of the unmasked maps. Note the clear positive skews in the sub-millimeter fluxes at the Spitzer source positions, relative to the maps as a whole. We used Kolmogorov-Smirnov tests to determine the confidence level of these relative positive skews, listed in table 1. There are significant detections at m and m, and marginal detections at m. No significant skew was found at m or m.
We also calculated the mean fluxes in the sub-millimeter maps at the positions of the Spitzer galaxies. These are almost all positive and are listed in table 1. This statistic is less efficient than the Kolmogorov-Smirnov test (which does not just use the first moment), so the uncertainties on the mean fluxes are larger than suggested by the Kolmogorov-Smirnov confidence levels. The Spitzer galaxies are individually undetected in the sub-millimeter, so one must be careful in interpreting the stacking analysis; for example, we do not use the noise-weighted mean fluxes because they can give false positives, as noted by Serjeant et al. 2003a. Also, many fluctuations in the sub-millimeter maps are blends (e.g. Scott et al. 2002), so is there a risk of overestimating the flux of any given Spitzer galaxy by also counting its neighbors? The answer is no, as Peacock et al. (2000) showed: for a Poissonian sampling of the sub-millimeter map, the expected total sub-millimeter flux from all neighbors equals the mean flux of the map, which is exactly zero for the chopped, nodded SCUBA maps. (The chopped/nodded PSF is also zero-sum, so the PSF-convolved images are still zero-sum.) Blending slightly degrades the uncertainty on the mean, but it does not affect the mean fluxes. Another demonstration of this is to note that the total flux of any given source is exactly zero in these chopped, nodded maps. Even confusing sources within the same SCUBA beam will have no net effect, provided that there are also similar sources uniformly distributed over the rest of the map.
The histograms of the whole map in figure 2 effectively act as the control sample. Nevertheless, as a test of the stacking analysis methodology, we performed the same tests on simulated Spitzer catalogs of the same size as the observed catalogs, with a Poissonian distribution in the unmasked regions. No positive skews in the sub-millimeter flux distributions were detected relative to the maps as a whole. These simulations also verified that the mean sub-millimeter flux around randomly chosen positions is consistent with zero.
4 Discussion
Although our Spitzer m and m catalogues are small ( and respectively), we can use our statistical detections to obtain constraints on the contribution to the sub-millimeter extragalactic background light from the Spitzer populations, by multiplying the mean sub-millimeter flux of a single Spitzer galaxy (table 1) with the observed surface density of Spitzer galaxies. At m, the integrated contribution from the m population is nW m-2 sr-1, and from the (overlapping) m population nW m-2 sr-1. This is already comparable to the total m extragalactic background reported by Lagache et al. (2000) of nW m-2 sr-1. At m the Spitzer contributions can, within the uncertainties, account for all the observed nW m-2 sr-1 extragalactic background: nW m-2 sr-1 from the m-selected sample, and nW m-2 sr-1 from the m galaxies. Our sub-millimeter faint source density is consistent with those in the deepest m maps (Cowie et al. 2002).
The sub-millimeter:Spitzer flux ratios in sub-millimeter point sources (Egami et al. 2004, see above) are much higher than average in the population (table 1). Despite the commonality between the SCUBA and Spitzer galaxy populations, sub-millimeter galaxies are not at all representative of the Spitzer population. The sub-millimeter background independently suggests the same result: if the m population had sub-millimeter:Spitzer flux ratios as high as SCUBA galaxies (e.g. median for the Egami et al. (2004) sample), the Jy m sources alone would over-predict the m background by . Our weak sub-millimeter detection of the m population is less surprising in that context. One possible interpretation is that the SCUBA population has fewer (or more heavily obscured) active nuclei than the Spitzer population as a whole.
Is our stacking analysis signal due to dusty galaxies, or to high- galaxies, or both? Our samples are too small to distinguish these possibilities, but stacking analyses of subsets show that either option is credible. Almost all the m galaxies are detected at m, and as with the m population as whole (table 1) this subset ( galaxies) is detected statistically. The remaining m galaxies are not detected in the stacking analyses (e.g., only confidence in the m signal:noise maps), so the redder galaxies are more likely to be sub-millimeter emitters. The lack of a stacking signal at m and m is at least in part due to dilution of the signal from the high density of bluer galaxies detected at these wavelengths. The red colors could be due to heavy obscuration, but the colors also become redder quickly with increasing redshift. Simpson & Eisenhardt (1999) show that or selects redshifts . There are galaxies satisfying either criteria, with detections in the relevant bands, and these galaxies are detected in the stacking analysis (e.g. confidence at m); the corresponding foreground galaxies are not detected (e.g. only confidence at m). Further work on larger samples is needed to discriminate between high-redshift and high-obscuration sub-populations.
The sub-millimeter backgrounds are sensitive to contributions from the far-infrared luminous energy densities throughout the redshift range of favorable K-corrections. It follows that the Spitzer m and m-selected galaxies are necessarily significant contributors to the comoving volume averaged star formation density. Many of the m and m galaxies are challenging targets for 8-10m-class optical/near-infrared spectroscopy, but redshift surveys of these populations, together with 2-D and 3-D clustering, would discriminate between competing semi-analytic descriptions of galaxy evolution, and determine whether (or which) SCUBA/Spitzer galaxies are the sites of the assembly of giant ellipticals. Finally, it is worth stressing that the conclusions in this paper could only have been reached with co-ordinated multi-wavelength surveys.
References
- (1) Alexander, D.M., et al. 2003, AJ, 125, 383
- (2) Blain, A.W., Kneib, J.-P., Ivison, R.J., & Smail, I. 1999, ApJ, 512, L87
- (3) Barger, A.J., et al., 1998, Nature, 394, 248
- (4) Chapman, S.C., Blain, A.W., Ivison, R.J., & Smail, I. 2003, Nature, 422, 695
- (5) Cowie, L.L., Barger, A.J., & Kneib, J.-P. 2002, AJ, 123, 2197
- (6) Dunlop, J.S., 2002 in ASP conference proceedings vol. 283, eds. T. Shanks and N. Metcalfe, San Francisco: Astronomical Society of the Pacific (astro-ph/0203183)
- (7) Eales, S., et al., 2000, AJ, 120, 2244
- (8) Efstathiou, A., & Rowan-Robinson, M., 2003, MNRAS, 343, 322
- (9) Egami, E., et al., 2004, ApJS, this issue
- (10) Elbaz, D., Cesarsky, C.J., Chanial, P., Aussel, H., Franceschini, A., Fadda, D., Chary, R.R., 2002, A&A, 384, 848
- (11) Fazio, G.G., et al., 2004, ApJS, this issue
- (12) Fox, M., et al., 2002, MNRAS, 331, 839
- (13) Franceschini, A., Aussel, H., Cesarsky, C.J., Elbaz, D., Fadda, D., 2001, A&A, 378, 1
- (14) Genzel, R., Cesarsky, C.J., 2000, ARA&A, 38, 761
- (15) Greve, T.R., et al. 2004, MNRAS, in preparation
- (16) Gruppioni, C., Lari, C., Pozzi, F., Zamorani, G., Franceschini, A., Oliver, S., Rowan-Robinson, M., Serjeant, S., 2002 MNRAS 335, 831
- (17) Holland, W.S., et al. 1999, MNRAS, 303, 659
- (18) Huang, J-S., et al, 2004, ApJS, this volume
- (19) Hughes, D.H., et al. 1998, Nature, 394, 241
- (20) Ivison, R.J., Smail, I., Le Borgne, J.-F., Blain, A.W., Kneib, J.-P., Bézecourt, J., Kerr, T.H., & Davies, J.K. 1998, MNRAS, 298, 583
- (21) Ivison, R.J., Smail, I., Barger, A., Kneib, J.-P., Blain, A.W., Owen, F.N., Kerr, T.H., & Cowie, L.L. 2000, MNRAS, 315, 209
- (22) Ivison, R.J., et al. 2002, MNRAS, 337, 1
- (23) Ivison, R.J., et al., 2004, ApJS, this volume
- (24) Kessler, M.F., Steinz, J.A., Anderegg, M., et al., 1996, A&A, 315, L27
- (25) Lagache, G., Haffner, L.M., Reynolds, R.J., Tufte, S.L., 2000, A&A 354, 247
- (26) Mortier, A., et al., 2004, in preparation
- (27) Peacock, J., et al., 2000, MNRAS, 318, 535
- (28) Rieke, G.H., et al., 2004, ApJS, this volume
- (29) Rowan-Robinson, M., et al., 2004, MNRAS submitted (astro-ph/0308283)
- (30) Rush, B., Malkan, M.A., Spinoglio, L., 1993, ApJS, 89, 1
- (31) Sato, Y., Cowie, L.L., Kawara, K., Taniguchi, Y., Sofue, Y., Matsuhara, H., Okuda, H., 2002, ApJ, 578, L23
- (32) Sato, Y., et al., 2003, A&A, 405, 833
- (33) Scott, S.E., et al. 2002, MNRAS 331, 817
- (34) Serjeant, S., et al., 2000, MNRAS 316, 768
- (35) Serjeant, S., et al., 2003a, MNRAS, 344, 887
- (36) Serjeant, S., et al., 2003b, MNRAS, 346, L51
- (37) Simpson, C., Eisenhardt, P., 1999, PASP, 111, 691
- (38) Smail, I., Ivison, R.J., & Blain, A.W. 1997, ApJ, 490, L5
- (39) Webb, T.M., et al., 2003a, ApJ, 582, 6
- (40) Webb, T.M., et al., 2003b, ApJ, 587, 41
- (41) Werner, M., et al., 2004, ApJS, this volume


Sub-millimeter stacking analysis of Spitzer source catalogs
| Wave- | m | m | m | m | m | m | ||||
|---|---|---|---|---|---|---|---|---|---|---|
| length | K-S (S:N) | K-S (Flux) | mJy | K-S (S:N) | K-S (Flux) | mJy | ||||
| m | ||||||||||
| m | ||||||||||
| m | ||||||||||
| m | ||||||||||
| ma | ||||||||||
| mb |