Extragalactic Source Counts at 24 Microns in the Spitzer First Look Survey
Abstract
We present the Spitzer MIPS 24 m source counts in the Extragalactic First Look Survey main, verification and ELAIS-N1 fields. Spitzer’s increased sensitivity and efficiency in large areal coverage over previous infrared telescopes, coupled with the enhanced sensitivity of the 24 m band to sources at intermediate redshift, dramatically improve the quality and statistics of number counts in the mid-infrared. The First Look Survey observations cover areas of, respectively, 4.4, 0.26 and 0.015 sq.deg. and reach 3 depths of 0.11, 0.08 and 0.03 mJy. The extragalactic counts derived for each survey agree remarkably well. The counts can be fitted by a super-Euclidean power law of index from 0.2 to 0.9 mJy, with a flattening of the counts at fluxes fainter than 0.2 mJy. Comparison with infrared galaxy evolution models reveals a peak’s displacement in the 24 m counts. This is probably due to the detection of a new population of galaxies with redshift between 1 and 2, previously unseen in the 15 m deep counts.
Subject headings:
galaxies: statistics — infrared: galaxies1. Introduction
The mid- and far-infrared regions of the electromagnetic spectrum probe the population of starburst galaxies obscured by dust. Counting galaxies as a function of mid and far-infrared fluxes therefore puts new limits on the inferred geometry of the Universe. Moreover, using counts at different wavelengths and extragalactic background light measurements, it is possible to constrain models of galaxy evolution (Franceschini et al. 2001; Xu et al. 2003; Lagache, Dole & Puget 2003; Chapman et al. 2003; Chary & Elbaz 2001). Source counts studies have generally been done in the optical, due to the advantage of good sensitivity and resolution of optical instruments, but optical counts are biased by dust obscuration and the task of correcting for dust extinction is difficult (Calzetti 1997). The optical counts reveal a strong evolution of the population of blue galaxies as a function of redshift to (Metcalfe et al. 1995; Lilly et al. 1996). At longer near-infrared wavelengths, where the light observed samples the old stellar population, the galaxy counts show a passive luminosity evolution (Gardner et al. 1993; Yan et al. 1998).
Counts from mid- and far-infrared deep surveys also point to a strong evolution. IRAS unveiled a new population of luminous infrared galaxies (LIGs; ) which emit the bulk of their energy beyond 60 m (e.g. Soifer et al. 1987). The IRAS galaxy counts revealed an excess of faint sources compared to no-evolution models (Hacking et al. 1987). The deep ISOCAM survey at 15 m discovered a population of dust-obscured galaxies at with LIG-like luminosities (Elbaz et al. 2002; Elbaz et al. 1999; Flores et al. 1999). The source counts derived from the deep surveys cover the flux density range 0.05-4 mJy, showing a significant super-Euclidean slope from 3 to 0.4 mJy and a change of slope at flux densities fainter than 0.4 mJy. The European Large Area ISO Survey (ELAIS; Oliver et al. 2000) has provided source counts in the flux density range 0.45-150 mJy, linking the IRAS counts to the deep ISOCAM counts (Gruppioni et al. 2002).
The Spitzer Space Telescope (Werner et al. 2004) was launched on August 25, 2003 and its three cryogenically-cooled science instruments combine to provide imaging and spectroscopy from 3 to 180 m with orders-of-magnitude improvements in capability over previous infrared telescopes. Compared to the 15 m band whose sensitivity is enhanced for sources in the redshift range 0.5-1.5 due to the prominent polycyclic aromatic hydrocarbon (PAH) features, the Spitzer 24 m band makes it possible to explore the Universe up to . Coupled with better sensitivity and increased efficiency in large areal coverage, the 24 m observations with Spitzer dramatically improve the quality and statistics of number counts in the mid-infrared. The First Look Survey111http://ssc.spitzer.caltech.edu/fls/ (FLS) was the first survey undertaken by Spitzer. The purpose of this survey is to characterize the mid-infrared sky at previously unexplored depths and includes an extragalactic, galactic, and ecliptic component.
In this Letter, we present source counts at 24 m in the Spitzer FLS main and verification surveys as well as in the ELAIS-N1 region which has deeper observations. The surveys are described in Section 2. We present the data reduction and flux extraction method in Section 3. In Section 4, we describe the sample selection and the 24 m counts. Finally, in Section 5, we discuss our results and their implications.

2. Description of the Surveys
The extragalactic component of the Spitzer FLS covers a 4.4 square degrees region near the ecliptic pole (17h 18m 00s +59∘ 30′ 00′′, J2000) and was observed by Spitzer in December 2003 for a total of 62.6 hours of MIPS (Rieke et al. 2004) and IRAC (Fazio et al. 2004) imaging. A 0.26 square degree verification survey within the main field (17h 17m 00s +59∘ 45′ 00′′, J2000) with exposure times four times that of the main survey was taken to allow accurate characterization of the completeness and reliability of source detections in the main field. In addition, deeper observations were carried out in the ELAIS-N1 region (16h 10m 01s +54∘ 30′ 36′′, J2000) as part of the Director’s Discretionary Time to test the confusion limit at 24 m (Storrie-Lombardi et al. 2004). The main characteristics of the three surveys are given in Table 1.
| Name | Area | Depth (3) | Completeness (80%) | |
|---|---|---|---|---|
| (sq.deg.) | (s) | (mJy) | (mJy) | |
| Main | 4.388 | 84 | 0.11 | 0.23 |
| Verification | 0.259 | 349 | 0.08 | 0.16 |
| ELAIS-N1 | 0.015 | 4268 | 0.03 | 0.09 |

3. Data Reduction
The FLS data were processed using the S8.9 version of the Spitzer Science Center (SSC) pipeline (see Spitzer Observer Manual222http://ssc.spitzer.caltech.edu/documents/som/). Further corrections for illumination variations and scan mirror dependent flats were derived from the data and applied to the individual frames (Fadda et al. 2004a). Saturated sources and bright cosmic rays can produce a flux drop every fourth column associated with the readouts. We identified the affected frames and applied an additive correction to the columns with low flux. The frames were coadded using the SSC software Mopex333http://ssc.spitzer.caltech.edu/postbcd/ to obtain a mosaic with half the original pixel scale (1.27”). The projection is done using a linear interpolation and takes into account the distortion corrections. The initial projection utilizes bad pixel masks produced by the pipeline. Further pixels affected by cosmic rays are flagged using a multiframe temporal outlier detection and the images are re-projected using these improved masks.

Given the resolution of MIPS at 24 m (the PSF FWHM measures 5.9”), typical extragalactic sources appear as point sources. For this reason, we can perform source extraction using a PSF fitting algorithm (StarFinder; Diolaiti et al. 2000). The StarFinder code has been developed to analyse adaptive optics images of very crowded stellar fields. We find that this extraction method performs remarkably well in the case of the 24 m images because of the good sampling of the PSF. Compared to the IRAF package DAOPHOT, this method performs a better evaluation of the PSF on the image as it evaluates the background emission over the entire frame and iteratively estimates the PSF after each extraction (see Aloisi et al. 2001). We compared the flux measurements obtained with StarFinder and SExtractor (Bertin & Arnouts 1996) in the region observed in both the shallow and verification surveys. The scatter in the difference between the shallow and deep flux measurements of faint sources is larger for the SExtractor aperture corrected fluxes (see Figure 1). The aperture used for SExtractor is 3FWHM (70% of the PSF total flux). The relative error of the flux extracted by StarFinder is also shown in Figure 1. StarFinder permits a more reliable flux measurement as it recovers 90% of the flux directly and deblends sources more efficiently than SExtractor. In the case of deep fields, deblending is essential for obtaining reliable counts. Point source fluxes were corrected to total fluxes using MIPS 24 m calibrators. The main field contains several extended sources such as nearby galaxies and bright IRAS sources. We identified 79 extended sources by visual inspection and measured their fluxes inside suitable apertures after subtracting surrounding point sources.
The spacecraft astrometry (known to better than 1”) was used to coadd the frames. A simple offset correction (of the order of 1” in right ascension) was applied to the final mosaic by matching sources to the VLA counterparts (Condon et al. 2003).
4. The 24 Micron Extragalactic Source Counts
For each field, we considered the part of the mosaic which showed the most uniform coverage (number of frames coadded). We also removed a 0.24 sq.deg. area in the main field that contains cirrus emission which can affect the flux measurement of sources. We counted sources in the remaining areas (4.15, 0.26, 0.015 sq.deg.) with uniform coverage (median of 23, 93, 139 frames) for the main, verification and ELAIS-N1 surveys, respectively.
An essential step to produce reliable counts is to discriminate stars from extragalactic sources. The star contamination at 24 m is expected to be low as we are sampling the tail of the Rayleigh-Jeans energy distribution and we are observing at high galactic latitude. Stars are identified on the basis of their optical counterparts. For stars brighter than R=19, we rely on the star classification of the Sloan Digital Sky Survey (SDSS; Hogg et al. 2004). At fainter magnitudes, we used the stellarity index measured with SExtractor on a deep R-band image (Fadda et al. 2004b). This index is reliable to beyond which we expect a negligible contribution of stars at 24 m. We find 8% stellar contribution for fluxes brighter than 0.3 mJy in the main field, 3% in the flux range 0.2-0.3 mJy in the verification survey, and 4% in the 0.1-0.2 mJy range.
The completeness of the main survey was estimated using the verification region for which both shallow and deep observations were taken. Using the deeper verification counts, we find that the counts in the main survey are 100% complete to a flux of 0.28 mJy (80% complete at 0.23 mJy). Similarly, using the deep ELAIS-N1 counts, we were able to measure a completeness limit of 0.21 mJy (80% complete at 0.16 mJy) for the verification survey. Simulations for completeness and reliability measurements for the ELAIS-N1 field can be found in Storrie-Lombardi et al. (2004). The completeness limits of each survey are listed in Table 1. The 3 limiting depth, also given in Table 1, were computed by measuring the noise (standard deviation) in the mosaic. To compute the total limiting flux, we assumed a Gaussian PSF with 5.9” FWHM normalized to the flux measured in the central pixel.
5. Discussion and Conclusions
The extragalactic (solid line) and stellar counts (dotted line) are shown in Figure 2. The counts from the three surveys agree remarkably well, as shown by the Kolmogorov-Smirnov test. The probability that the two flux distributions (ELAIS-N1 vs. verification and verification vs. main) are not the same is less than 20% and 15%, respectively. The counts flatten at fluxes fainter than 0.2 mJy. For fluxes between 0.1 and 0.9 mJy, all counts can be fitted by super-Euclidean power-laws:
| (1) |
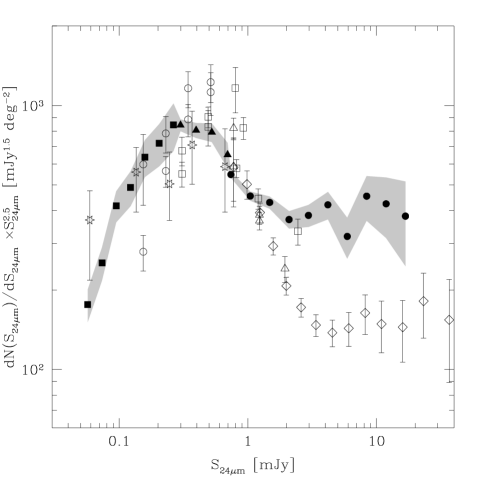
The differential counts, normalized to the expected differential counts in an Euclidean Universe, are shown in Figures 3 and 4. At faint fluxes (0.1 mJy), the average closest-neighbor separation is 17”, i.e. 0.12 sources per beam. This value is less than the estimated number of sources per beam at the 5 confusion level (Takeuchi & Ishii 2004, assuming a slope of 1.5 below 0.1 mJy).
The predictions from the infrared galaxy evolution models of Franceschini et al. (2001; F01), Rodighiero et al. (2004), and Lagache, Dole & Puget (2003; LDP03) are displayed in Figure 3. The LDP03 model considers two populations of galaxies: non-evolving normal spirals and starburst galaxies whose luminosity density evolves with redshift. The F01 model uses three populations evolving differently: non-evolving normal spirals, a fast evolving population which includes type-II AGNs and starburst galaxies, and type-I AGNs. The type-I AGNs evolution is based on the results from optical and X-ray observations. The F01 model has recently been updated (Rodighiero et al. 2004) with a different normalization to take into account the corrected counts from the reanalysis of the ELAIS-S1 (Gruppioni et al. 2002) and the Lockman Hole (Rodighiero et al. 2004) fields. These models fit, besides the counts, redshift distributions and the cosmic infrared background spectrum.
The deep ISOCAM 15 m counts (Elbaz et al. 1999, Rodighiero et al. 2004, Gruppioni et al. 2002, Metcalfe et al. 2003), transformed to 24 m, are overplotted on the Spitzer FLS 24 m counts in Figure 4. The 15 to 24 m flux transformation was done using template spectral energy distributions (SEDs) of three infrared luminous galaxies with (ULIG), (LIG) and (starburst) , taken from Chary & Elbaz (2001). The 24 m/15 m flux ratio remains fairly constant in the redshift region 0.1-1.2 except around where the PAH emission bands at m enter the 24 m filter while the silicate absorption feature enters the 15 m filter. The median value we used to transform the ISOCAM counts is 1.2. The IRAS 25 m counts, appearing in Figure 3, are taken from Hacking & Soifer (1991) and, for the brightest fluxes, are based on the revised IRAS bright galaxy sample of Sanders et al. (2003). These counts were transformed to 24 m counts using the same set of template SEDs (25 m/24 m flux ratio of 1.8).
The 24 m counts confirm the existence of the rapidly evolving dust-obscured population discovered by ISOCAM (Elbaz et al. 1999). The main difference between the model predictions and the data, which is reflected also in the direct comparison with the transformed ISOCAM counts, is a shift in the turn-around of the Euclidean-normalized counts. The peak in the 24 m counts (at 0.2 mJy) is fainter than what is predicted by the models. It is highly improbable that this difference is due to problems in flux measurement and/or calibration. The 24 m calibration is accurate at the level of a few percent while the uncertainty associated with flux measurements is less than 10% (see Section 3). The possibility of a systematic under-evaluation of fluxes of slightly extended sources (which we extract as point-sources with StarFinder) is also discarded by the good agreement with aperture measurements of faint sources.
It is possible that the two bands are sampling the same population of dust-obscured galaxies at , but the 15 m band is missing many objects around and all the galaxies at . In fact, only 60% of the cosmic infrared background at 15 m has been resolved by the ISO observations (Elbaz et al. 2002). This hypothesis is consistent with the shift observed in the peak of the 24 m counts to fainter fluxes compared to the peak observed in the 15 m counts. Crucial information about the redshift distribution of the 24 m sources will come from deep spectroscopic observations and photometric redshift studies.
References
- Aloisi et al. (2001) Aloisi, A., Clampin, M., Diolaiti, E., Greggio, L., Leitherer, Claus, Nota, A., Origlia, L., Parmeggiani, G., Tosi, M. 2001, AJ, 121, 1425
- Beichman et al. (2003) Beichman, C.A., Cutri, R., Jarrett, T., Stiening, R., Skrutskie, M. 2003, AJ, 125, 2521
- Bertin & Arnouts (1996) Bertin, & Arnout 1996, A&AS, 117, 393
- Calzetti (1997) Calzetti, D. 1997, AJ, 113, 162
- Cesarsky et al. (1996) Cesarsky et al. 1996, A&A, 315, 32
- Chapman et al. (2003) Chapman, S., Helou G., Lewis G., & Dale D. 2003, ApJ, 588, 186
- Chary & Elbaz (2001) Chary, R., & Elbaz, D. 2001, ApJ, 556, 562
- Condon et al. (2003) Condon, J.J., Cotton, W.D., Yin, Q.F. et al. 2003, AJ, 125, 2411
- Diolaiti et al. (2000) Diolaiti, E., Bendinelli, O., Bonaccini, D., Close, L., Currie, D., Parmeggiani, G. 2000, A&AS, 147, 335
- Dole, Lagache, & Puget (2003) Dole, H., Lagache, G. & Puget, J.-L. 2003, ApJ, 585, 617
- Elbaz et al. (2002) Elbaz, D. et al. 2002, A&A, 384, 848
- Elbaz et al. (1999) Elbaz, D., Cesarsky, C.J., Fadda, D., et al. 1999, A&A, 351, L37
- (13) Fadda, D. et al. 2004a, in preparation
- (14) Fadda, D., Jannuzi, B., Ford, A., & Storrie-Lombardi, L.J. 2004b, AJ, in press, astro-ph/0403490
- Fazio et al. (2004) Fazio, G. 2004, this volume
- Flores et al. (1999) Flores, H. et al. 1999, ApJ, 517, 148
- Franceschini et al. (2004) Franceschini, A. et al. 2004, in preparation
- Franceschini et al. (2001) Franceschini, A., Aussel, H., Cesarsky, C.J., Elbaz, D., & Fadda, D. 2001, A&A, 378, 1
- Gardner et al. (1993) Gardner, J.P., Cowie, L.L., Wainscoat, R.J. 1993, ApJ, 415, 9
- Glazebrook et al. (1994) Glazebrook, K., Peacock, J.A., Collins, C.A., & Miller, L. 1994, MNRAS, 266, 65
- Gruppioni et al. (2002) Gruppioni, C., Lari, C., Pozzi, F., Zamorani, G., Franceschini, A., Oliver, S., Rowan-Robinson, M., & Serjeant, S. 2002, MNRAS, 335, 831
- Hacking & Soifer (1991) Hacking, P.B., & Soifer, B.T. 1991, ApJ, 367, L49
- Hacking et al. (1987) Hacking, P.B., Houck, J.R., Condon, J.J. 1987, ApJ, 316, 15
- Hogg et al. (2004) Hogg, D.W., Blanton, M.R., Finkbeiner, D.P., Padmanabhan, N., & Schlegel, D.J. 2004, in preparation
- Kessler et al. (1996) Kessler, M.F., et al. 1996, A&A, 315, 27
- Lagache, Dole & Puget (2003) Lagache, G., Dole, H. & Puget, J.-L. 2003, MNRAS, 338, 555
- Lari et al. (2002) Lari, C., Pozzi, F., Gruppioni, C., Aussel, H., Ciliegi, P., Danese, L., Franceschini, A., Oliver, S., Rowan-Robinson, M., & Serjeant, S. 2002, MNRAS, 325, 1173
- Lilly et al. (1996) Lilly, S., Le Fèvre, O., Hammer, F., Crampton, D. 1996, ApJ, 460, L1
- Metcalfe et al. (1995) Metcalfe, N., Shanks, T., Fong, R., Roche, N. 1995, MNRAS, 273, 257
- Metcalfe et al. (2003) Metcalfe, L. et al. 2003, A&A, 407, 791
- Oliver et al. (2000) Oliver, S. et al. 2000, MNRAS, 316, 749
- Rieke et al. (2004) Rieke, G. et al. 2004, this volume
- Rodighiero et al. (2004) Rodighiero, G., Lari, C., Fadda, D., et al. 2004, A&A, submitted
- e.g. Soifer et al. (1987) Soifer, B.T., Neugebauer, G., Houck, J.R. 1987, ARA&A, 25, 187
- Sanders et al. (2003) Sanders, D., Mazarrella, J., Kim, et al. 2003, AJ, 126, 160
- Storrie-Lombardi et al. (2004) Storrie-Lombardi, L.J. et al. 2004, ApJ, in preparation
- Takeuchi & Ishii (2004) Takeuchi, T.T., & Ishii, T.T. 2004, ApJ, 604, 40
- Werner et al. (2004) Werner, M. et al. 2004, this volume
- Xu et al. (2003) Xu, C.K., Lonsdale, C.J., Shupe, D.L., Franceschini, A., Martin, C., & Schiminovich, D. 2003, ApJ, 587, 90
- Yan et al. (1998) Yan, L., McCarthy, P.J., Storrie-Lombardi, L.J., Weymann, R.J. 1998, ApJ, 503, 19