Spitzer 24micron Observations of Optical/Near-IR Selected Extremely Red Galaxies: Evidence for Assembly of Massive Galaxies at ?
Abstract
We carried out the direct measurement of the fraction of dusty sources in a sample of extremely red galaxies with (mag and mag, using 24 data from the Spitzer Space Telescope. Combining deep 24, - and -band data over an area of 64 sq.arcmin in ELAIS N1 of the Spitzer First Look Survey (FLS), we find that 50% of our ERO sample have measurable 24 flux above the 3 flux limit of 40Jy. This flux limit corresponds to a SFR of 12/yr at , much more sensitive than any previous long wavelength measurement. The 24-detected EROs have 24-to-2.2 and 24-to-0.7 flux ratios consistent with infrared luminous, dusty sources at , and an order of magnitude too red to be explained by an infrared quiescent spiral or a pure old stellar population at any redshift. Some of these 24-detected EROs could be AGN, however, the fraction among the whole ERO sample is probably small, 10-20%, as suggested by deep X-ray observations as well as optical spectroscopy. Keck optical spectroscopy of a sample of similarly selected EROs in the FLS field suggests that most of the EROs in ELAIS N1 are probably at . The mean 24 flux (167Jy) of the 24-detected ERO sample roughly corresponds to the rest-frame 12 luminosity () of at . Using the correlation between IRAS and infrared luminosity , we infer that the of the 24-detected EROs is and at respectively, similar to that of local LIRGs and ULIGs. The corresponding SFR would be roughly /yr. If the time scale of this starbursting phase is on the order of yr as inferred for the local LIRGs and ULIGs, the lower limit on the masses of these 24-detected EROs is . It is plausible that some of the starburst EROs are in the midst of violent transformation to become massive early type galaxies at the epoch of .
1 Introduction
Optical/near-IR colors, such as or have been commonly used in wide-area surveys to select old stellar populations at (Cimatti et al. 2002; McCarthy et al. 2001; McCarthy 2004 for the review of this subject). Near-IR observations, which sample cool low-mass stars, are sensitive to old stellar populations. The ( of 5.3 corresponds to the calculated color of a passively evolving elliptical galaxy at . Therefore, in principle, the color criterion of (mag or (mag (EROs) should select early type galaxies at . However, these color selections are also sensitive to dust-reddened, star-forming systems, and examples of both passively evolving ellipticals and dusty starburst EROs have been found (Soifer et al. 1999; Hu & Ridgway 1994; McCarthy, Persson & West 1992; Graham & Dey 1996). This indicates that the optical/near-IR SEDs of these sources are sufficiently degenerate that these color criteria cannot effectively distinguish between them. In addition, a small fraction of EROs (10-20%) could also be AGN, as shown by deep Chandra data and optical spectroscopy (Alexander et al. 2002; Yan, Thompson & Soifer 2004). The relative contribution of these two galaxy types — old stellar populations and dust-reddened, star-forming galaxies — is a critical issue for many surveys whose goal is to determine the evolution of the mass function and the formation of massive galaxies. Deep optical spectroscopy indicates that a large fraction (30-50%) of EROs have emission lines (Cimatti et al. 2002; Yan, Thompson & Soifer 2004; McCarthy et al. 2004); however, it remains unclear what fraction of EROs are truly dust obscured galaxies.
MIPS 24 data from the Spitzer Space Telescope (Rieke et al. 2004; Werner et al. 2004) offer the first opportunity to directly address this critical issue. Dusty, star-forming galaxies are clearly distinguished from early-type galaxies at mid-IR wavelengths. Between , the MIPS data is especially discriminating as strong, rest-frame 612m polycyclic aromatic hydrocarbon (PAH) dust features redshift into the 24-band. In this Letter, we present our initial study of the 24 properties of the ()mag selected EROs in ELAIS N1. Throughout the paper, we adopt km/s/Mpc, , , and the Vega system for optical/NIR magnitudes.
2 Data
2.1 Spitzer 24 Observations and Data Reduction
The primary dataset used in this Letter is in the ELAIS N1 field, which is a part of the Spitzer First Look Survey (FLS)111For details of the FLS observation plan and the data release, see http://ssc.spitzer.caltech.edu/fls.. The field was observed in a photometry mode mosaic, and the raw data were processed and stacked by the data processing pipeline at the Spitzer Science Center (SSC). Source catalogs at 24 were generated using StarFinder (Diolaiti et al. 2000), which measures profile-fitted fluxes for point sources. The complete description of the 24 data reduction and source catalog can be found in Fadda et al. (2004b) and Marleau et al. (2004). To aid in the interpretation of the results from ELAIS N1, we also analyzed the FLS verification strip (FLSV). The data presented here covers 64 sq.arcmin in ELAIS N1 and 256 sq.arcmin in the FLSV. Table 1 summarizes the salient characteristics of all data used in this paper.
2.2 Optical, Near-IR Imaging and Keck Spectroscopy
All -band observations were taken at the Kitt Peak National Observatory. Final stacked images and source catalogs have been publicly released (Fadda et al. 2004a). The -band data were obtained using the Wide-Field Infrared Camera (WIRC) on the Palomar 200-inch telescope. The data in Elais N1 covers . A detailed description of the WIRC observations and data reduction will included in a separate paper by Choi et al. (2004). Finally, high-resolution, optical spectra of a -selected galaxy sample within the FLS region were obtained using the Keck, Deep Imaging Multi-Object Spectrograph (DEIMOS) (Faber et al. 2003). A total of redshifts were measured, of which 112 (52 EROs) are included in the analysis in this paper.
3 Results and Implications
3.1 The 24 detected EROs
To merge the R/K and source catalogs, we used a simple positional matching method with a match radius, which corresponds to combined astrometric uncertainty from the and data. Due to the relatively low source density (7arcmin-2), the likelihood of spurious matches is small (3%), consistent with the fact that we find only one multiple match out of 65. In addition, we test the robustness of each match by comparing the probability of the measured separation based on the astrometric uncertainties to the probability of a spurious detection based on the 24 source density. The probability ratios above unity imply to be likely real matches, and we found that all but two matches meet this criteria. We retained these two matches since the visual inspection suggests that they could still be associated with physical offset centroids. Bright stars were rejected using -band images. Stellar contamination in our sample is expected to be small since the field is at the galactic latitude of 41∘, and 24 data samples the tail of the Rayleigh-Jeans energy distribution.
Since the - and -band data have similar seeing, () colors were measured using a fixed diameter aperture. The ERO catalog with (mag and mag (6) consists of 129 galaxies over 64 sq.arcmin in ELAIS N1. Figure 1 shows the vs. distribution for all sources (black crosses. The (mag and mag limits are shown as solid horizontal and solid vertical lines, and sources with 24 detected counterparts are indicated as red open circles. We find that 24 detected sources have slightly redder () colors than non-detected sources, consistent with the expectation that 24 emission is an indicator of dust extinction.
Of the 129 EROs, 65 (506%) have 24 emission with flux greater than 40Jy. The fraction of 24 detected EROs becomes slightly higher for redder sources, with 56% and 67% for (mag and (mag respectively. However, the errors of these fractions are large due to the shallow band limit. Deeper data would be needed to reduce the uncertainties. In figure 2a, we show the 24 flux distributions of both the total and ERO samples. We find that 70% of the 24 EROs have Jy and that the mean 24 flux of the ERO sample is 167Jy. Figure 2b shows vs. 24 flux for all detected sources (solid squares) and for the EROs (large open circles). We find that amongst the 24 detected sources, is weakly correlated with , with large scatter. This is expected since these two bands sample light from different physical origins, stellar photosphere versus dust emission. This also explains why many faint sources have fairly bright 24 fluxes. For bright () and 24-faint sources, the mid-infrared data is deep enough to detect the emission from normal galaxy populations at low redshifts.


3.2 The Nature of the EROs with 24 Emission
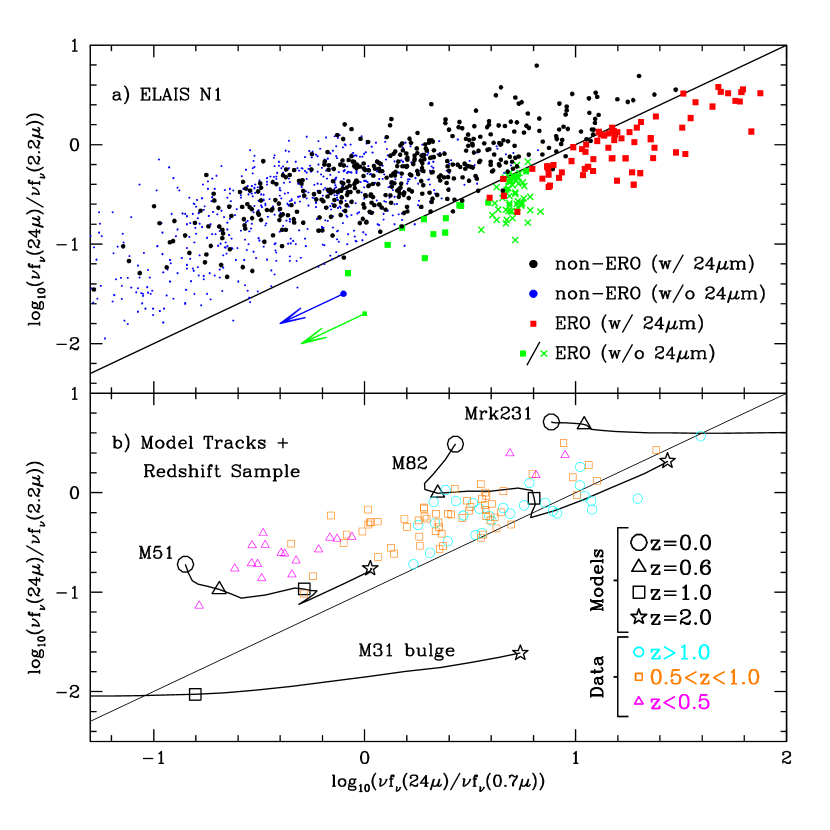
What types of galaxies are the 24 detected EROs? In Figure 3a, we present a 24-to-0.7 and 24-to-2.2 color-color diagram showing that 24-detected EROs (red squares) are clearly separated from EROs without 24 emission (green points), as well as the general non-ERO population (black and blue). This suggests that the MIR/Optical and MIR/NIR colors of 24-detected EROs are unique, distinguishing them from other populations. Figure 3b presents the expected colors as a function of redshift for various SED templates, assuming no evolution. The SEDs for M51 (normal spiral), M82 (starburst) and Mrk231 (dusty AGN) are taken from Silva et al. (1998), Fadda et al. (2002), and Chary & Elbaz (2001). In the case of M31’s bulge (old stellar population), we use the near-IR J, H, K, IRAS 12, 25, 60 and 100m fluxes, all within a 4 diameter aperture of the central nucleus (Soifer et al. 1986) and merge this with a 10 Gyr theoretical SED from Bruzual & Charlot. 222ftp://gemini.tuc.noao.edu/pub/charlot/bca5 For comparison, a sample of 112, 24 sources from the FLSV with known spectroscopic redshifts are marked to show the actual redshift range of the 24 EROs in ELAIS N1. Of these 112 redshifts, 10 are 24-detected EROs with , and the optical spectra of these 10 sources all have [OII]3727Åemission line.
Comparing Figure 3a & 3b, we reach the following conclusions: 1) 24-detected EROs in ELAIS N1 with (mag, mag, and )Jy are infrared bright sources at . They have colors similar to starbursts like M82 at , or dust reddened AGN like Mrk231 at . Their colors are too red to be explained by any normal spiral or old stellar populations at any redshifts. 2) The likely redshift range of these 24 EROs is , as predicted from the model SEDs of M82 and Mrk231. This is further confirmed by comparison to the Keck spectroscopic sample from the FLSV. 3). The remaining half of the ERO population are probably galaxies with old stellar populations at , as suggested by the tracks in Figure 3b.
Half of the ELAIS N1 ERO sample have 24 dust emission. The key question is what their infrared luminosities are. In the previous section, we conclude that the 24-detected EROs have colors similar to M82, however, Figure 3a does not set any constraints on either their luminosities or masses. We have a total of 112 redshifts for objects with 24 counterparts (the FLSV 3 flux limit is 90Jy). In Figure 4, we present the observed 24 luminosity versus redshift for the spectroscopic FLSV sample. At the observed 24 luminosity roughly corresponds to the rest-frame IRAS 12 luminosity, within a factor of 2. The Spitzer 24 filter is narrower than the IRAS 12 filter, but ignoring this difference, a crude conversion of the observed Spitzer 24 flux can be made to place a lower limit on the rest-frame IRAS 12 luminosity. We can infer the total infrared luminosity of 24 sources at by using the correlation between the 12 luminosity () and the infrared luminosity , (Soifer et al. 1989; Chary & Elbaz 2001). The mean flux (167Jy) of the 24-detected EROs in ELAIS N1 implies the at and at , similar to that of local LIRGs and ULIGs. The corresponding SFR is /yr, using (Kennicutt 1998). We emphasize that the 3 flux limit of 40Jy in ELAIS N1 corresponds to a SFR of 12/yr, more sensitive than the deepest 1.4GHz observation (Smail et al. 2002). In comparison, the SFR derived from the rest-frame [OII]3727Åemission line for EROs is roughly a few /yr (Yan, Thompson & Soifer 2004; Cimatti et al. 2003). Our results are consistent with very deep 1.4GHz (rms Jy) measurements (Smail et al. 2002).

3.3 Summary & Implications
Spitzer 24 data in ELAIS N1 have revealed that 50% of EROs with (mag and mag have detectable 24 emission above 40Jy. The colors and inferred redshifts of the 24-detected EROs suggest that they are infrared-luminous, dusty sources at . Their mean 24 flux (167Jy) corresponds to at and to at . Some of these 24-detected EROs could be AGN. The one mega-second Chandra observation in the HDF and optical spectroscopy suggest that the fraction of EROs likely to be AGN is small, around 10-20% (Alexander et al. 2002; Yan, Thompson & Soifer 2004). These dusty AGN can be identified when we combine this current analysis with the IRAC data. Our result suggests that a significant fraction of EROs are extremely active starbursts (LIRGs or ULIGs). If the time scale of this starbursting phase is on the order of /yr, as inferred from local LIRGs and ULIGs (Sanders & Mirabel 1996), we can set a lower limit to the mass of these 24-detected EROs as SFR. If the EROs without detectable 24 are indeed massive systems with old stellar populations at as measured by several recent surveys (Glazebrook et al. 2004; Bell et al. 2003), one plausible connection between the starburst and early-type ERO populations is that the former may be in the process of transforming into the latter, as initially postulated by Kormendy & Sanders (1992). In the hierarchical clustering paradigm, it could be interpreted that our deep 24 observations are capturing a massive galaxy population in the midst of violent transformation – possibly in the process of assembly via mergers/starbursts at the epoch of . The accurate determination of the stellar and dynamical masses of these starburst EROs at will be critical for the resolution of this question. Finally, the measurement of volume averaged mass density at would require a better understanding of the physical source of the integrated K-band light — whether from dusty systems or from old stars.
Our result is consistent with what has been found with HST morphological studies of EROs. Yan & Thompson (2003) and Moustakas et al. (2004) have found that close to 50% of EROs with have morphologies consistent with disk or later type galaxies in the observed 8100–8500 Å wavelength, and less than % show clean bulge type profiles. With the HST/ACS/NICMOS images in the FLSV region, we will be able to investigate the morphologies of these infrared luminous EROs, and to determine if indeed they are starbursting mergers at .
This work is based in part on observations made with the Spitzer Space Telescope, which is operated by the Jet Propulsion Laboratory, California Institute of Technology under NASA contract 1407. Support for this work was provided by NASA. The spectroscopic data presented herein were obtained at the W.M. Keck Observatory, which is operated as a scientific partnership among the California Institute of Technology, the University of California, and the National Aeronautics and Space Administration. The Observatory was made possible by the generous financial support of the W.M. Keck Foundation. We also wish to recognize and acknowledge the very significant cultural role and reverence that the summit of Mauna Kea has always had within the indigenous Hawaiian community. We are most fortunate to have the opportunity to conduct observations from this mountain.
| Filter | 24 | ||
|---|---|---|---|
| FWHM () | 1.0 | 1.0 | 5.5 |
| Pixel Scale (/pixel) | 0.26 | 0.25 | 2.55 |
| Exp. Time (sec) | 1800 | 1800aaFLSV/9000bbELAISN1 | |
| 3 Limits | |||
| mag | mag | Jy |
References
- Alexander (2002) Alexander, D.M. et al. 2002, AJ, 123, 1149
- bell (2003) Bell, E. et al. 2003, ApJS, 149, 289
- Choi (04) Choi, P., et al. 2004, in prep.
- Daddi et al. (2000) Daddi, E., et al. 2000, A&A, 361, 535
- Diolaiti (2000) Diolaiti, E.; et al. 2000, A&A, 147, 335
- Chary (2001) Chary, R. & Elbaz, D. 2001, ApJ, 556 562
- cimatti (2002) Cimatti, A., et al. 2002, A&A, 381, 68
- cimatti (1998) Cimatti, Andrea; et al. 1998, ApJ, 499L, 21
- dey (1999) Dey, A. et al. 1999, ApJ, 519, 610
- faber (2003) Faber, S.M., et al. 2003, SPIE, 4841, 1657
- fadda (2004) Fadda, D., Jannuzi, B., Ford, A., & Storrie-Lombardi, L.J., 2004, AJ, in press [astro-ph/0403490]
- fadda (2004) Fadda, D. et al. 2004b, ApJS, in this volume.
- glazebrook (2004) Glazebrook, K. et al. 2004, ApJL, in print. astroph/0401037
- Graham (1996) Graham, J. & Dey, A. 1996, ApJ, 471, 720
- Hu (1994) Hu, E.M., & Ridgway, S.E. 1994, AJ, 107, 1303
- kormendy (1992) Kormendy, J. & Sanders, D., 1992, ApJL, 390, 53
- marleau (2004) Marleau, F. et al. 2004, ApJS, this volume.
- mccarthy (2001) McCarthy, P.J., et al. 2001, ApJ, 560, L131
- mccarthy (2004) McCarthy, P.J., 2004, AR&AA, 2004, submitted.
- mccarthy (1992) McCarthy, P.J., Persson, S.E., West, S.C. 1992, ApJ, 386, 52
- moustakas (2003) Moustakas, L. et al. 2003, ApJL, in press
- rieke (2004) Rieke, G. et al. 2004, in the same volume
- Roche et al. (2002) Roche, N.D., Almaini, O., Dunlop, J., Ivison, R.J., Willott, C.J. 2002, MNRAS, 337, 1282
- sanders (1996) Sanders, D. & Mirabel, I.F. 1996, AR&A, 34, 749
- Silva (1998) Silva, L., Granato,G.L., Bressan, A., Danese, L. 1998, ApJ, 509, 103
- Smail (2002) Smail, I. et al. 2002, ApJ, 581, 844
- Soifer et al. (1999) Soifer, B.T., et al. 1999, AJ, 118, 2065
- Soifer et al. (1989) Soifer, B.T., Boehmer, L., Neugebauer, G., Sanders, D.B., 1989, AJ, 98, 766
- Soifer et al. (19860) Soifer, B.T., et al. 1986, ApJ, 304, 651
- Werner (2004) Werner, M. et al. 2004, in the same volume
- yan (2003) Yan, L. & Thompson, D.J. 2003, ApJ, 586, 765
- yan (2004) Yan, L., Thompson, D.J., & Soifer, B.T. 2004, AJ, 2004, 127, 1274