Mid-Infrared Galaxy Morphology Along the Hubble Sequence
Abstract
The mid-infrared emission from 18 nearby galaxies imaged with the IRAC instrument on Spitzer Space Telescope samples the spatial distributions of the reddening-free stellar photospheric emission and the warm dust in the ISM. These two components provide a new framework for galaxy morphological classification, in which the presence of spiral arms and their emission strength relative to the starlight can be measured directly and with high contrast. Four mid-infrared classification methods are explored, three of which are based on quantitative global parameters (colors, bulge-to-disk ratio) similar to those used in the past for optical studies; in this limited sample, all correlate well with traditional -band classification. We suggest reasons why infrared classification may be superior to optical classification.
1 Introduction
The morphological classification scheme introduced by Hubble (1926, 1936), based on blue-light images, has been modified periodically over the years (e.g., Sandage 1961; de Vaucouleurs 1959; Kormendy 1979; Buta 1995) but remains a fundamental method by which astronomers continue to sort and compare galaxies. From a contemporary viewpoint, the scheme is useful because it closely follows the fundamental distinction between galaxies with and without significant amounts of interstellar matter. Within each major class (spirals and irregulars on the one hand, ellipticals and lenticulars on the other), the subclass reflects the history of each galaxy, although the details are still a topic of active study. Furthermore, within the spiral-irregular branch, subclass is closely correlated with the number and luminosity of young stars relative to old stars.
Hubble morphological classification is essentially a visual exercise which is sometimes assigned a numerical index (such as the index in the RC3; de Vaucouleurs et al. 1991) in order to facilitate comparisons with various quantitative global parameters. Despite the essentially qualitative process, there is general agreement among many human classifiers Naim et al. (1995).
Different classification schemes have been developed over the years, such as spectral (absorption versus emission line; Morgan & Mayall, 1957; Bromley et al., 1998), ultraviolet Marcum et al. (2001), and near-infrared Jarrett (2000); Block & Puerari (1999). Detailed comparisons have also been made between the optical classifications and various global galaxy parameters, such as: color (blue versus red; Buta et al., 1994; de Vaucouleurs, 1960); light distribution via the bulge-to-disk-ratio van den Bergh (1976), concentration index (Okamura et al. 1984; Abraham et al. 1994), and galaxy asymmetry Abraham et al. (1996); and trained neural network schemes Odewahn et al. (1996). These various methods often show good correspondence among them Roberts & Haynes (1994), but there are significant and systematic differences among at least some (Connolly et al. 1995; Kochanek, Pahre, & Falco 2000). So far, no alternate scheme appears to be as directly tied to the composition and history of a galaxy as Hubble’s.
In this paper, we revisit the morphological classification scheme using images with resolution and sensitivities similar to those used for traditional optical classifications—but at mid-infrared wavelengths. While some nearby galaxies could be resolved by previous infrared space missions operating at these wavelengths, and equal or better spatial resolution can be obtained from the ground, the combined wide-field coverage and sensitive infrared imaging detectors of the IRAC instrument on Spitzer Space Telescope permits us to explore an entirely new region of parameter space for imaging nearby galaxies. These images demonstrate a new approach to galaxy classification based on the properties of the galaxy interstellar medium relative to its starlight.
2 Sample
The 16 galaxies presented here are a small but representative subset of a sample of about 100 scheduled to be observed. These galaxies were drawn from a complete sample from Ho, Filippenko, & Sargent (1997), which contains nearly 500 galaxies in the northern sky at mag. A subsample of approximately 100 galaxies was drawn from it under the constraints: (1) the galaxies should have small sizes (less than arcmin), so that they would fit in the instantaneous instrument field-of-view; and (2) the two-parameter space of luminosity and morphological type is fully spanned. The galaxies were randomly drawn within these constraints. Several low surface brightness galaxies were added to the subsample, as the parent sample was judged to be missing such galaxies. The sample will be more fully described in a future paper. It is fortunate that the sample to date nearly fully spans the classical morphological sequence (Sa and Sab are missing). Two additional galaxies (NGC 3031 and NGC 300) were observed for Early Release Observations; the first one is in the parent sample, while the latter is southern and is not. Both observations are described elsewhere in this issue (Willner et al. 2004; Helou et al. 2004), and are only included in the color and bulge-to-disk-ratio plots. We adopt the RC3 optical classifications de Vaucouleurs et al. (1991) throughout this paper for comparison purposes, with the exception of NGC 5363: it is mis-classified as I0?, but is most likely intended to be the type S0pec. We have adopted E/S0pec for it.
3 Observations
The data were taken with the InfraRed Array Camera (IRAC; Fazio et al., 2004) on the Spitzer Space Telescope Werner et al. (2004) during the first four IRAC campaigns of normal operations (2003 December – 2004 March). Sixteen galaxies (catalog ads/sa.spitzer#0004431104) were imaged, each using five exposures of either 12 or 30 seconds each on the source in all four detectors. The standard pipeline BCD (Basic Calibrated Data, version 8.9–9.5) products were used in the reductions. The first 5.8 µm image had an additional “first-frame delta skydark” subtracted from it, which was based on an independent dataset. The bias level for the 5.8 µm images was significantly variable such that the median value of the background plus bias (which was iteratively determined via a sigma-clipping algorithm) had to be subtracted from each individual frame before mosaicing.
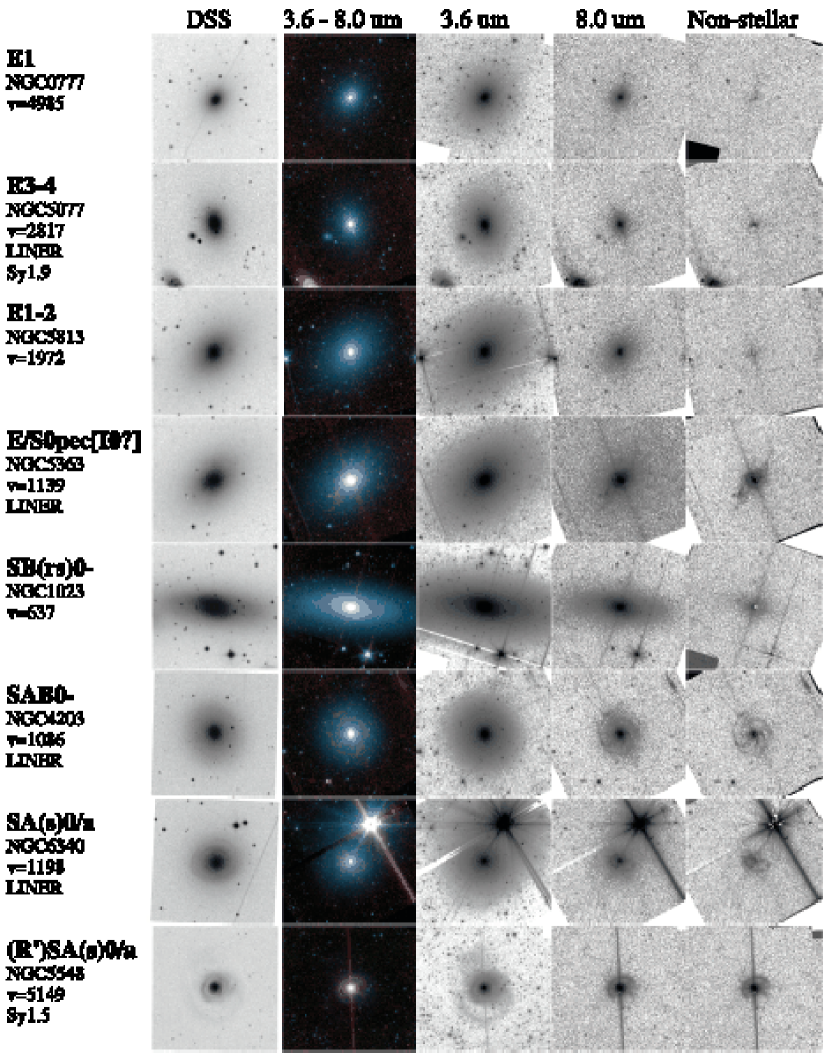
A mosaic of each target in each bandpass was made using custom software operating under the iraf environment and using the wcstools package. Optical distortion was removed in the process, and the images were subpixellated to arcsec, which is a linear reduction by a factor of in each dimension. A first iteration mosaic was constructed using a median combination of the individual frames. Each separate BCD frame was then compared with the mosaic, and differences much larger than the amount expected from the known noise were assumed to be cosmic rays or other artifacts. Pixels affected were flagged as invalid, and the resulting cleaned frames were then combined into the final mosaic. The resulting 3.6 and 8 µm images are shown in Figure 1. The 4.5 and 5.8 µm images look similar to 3.6 and 8.0 µm, respectively.
Quantitative data in this paper are given in instrumental magnitudes relative to Vega. The existing calibration of IRAC data is based on point source observations Fazio et al. (2004). Extended sources will have aperture corrections different from those for point sources, and the correct values are still unknown. In particular, for the elliptical galaxy NGC 777, which shows the least evidence for any dust emission, we assume a pure stellar spectrum matching that of an M0 III star. This stellar class is chosen in the mid-infrared, since the -band light of old stellar populations has been shown to be dominated by the M giants Frogel et al. (1978). The resulting corrections, representing the ratio of point source flux in a 12.2 arcsec aperture to that in an infinite aperture, are mag. These corrections agree within mag with preliminary estimates based on the flux at arcsec for observations of Fomalhaut, except for 5.8 µm, where the galaxy magnitudes implied by the Fomalhaut data are mag fainter. If NGC 777 does have dust emission after all, then the other galaxies will have larger emission than derived here.
4 Analysis
For each galaxy, the color is nearly constant with radius and is consistent with stellar photosphere emission. Dust emission is likely to be important at longer wavelengths. The stellar emission was subtracted from the and m images using the and m images suitably scaled to match the theoretical colors of M0 III stars: mag (M. Cohen and T. Megeath, private comm.). The resultant images are referred to as “non-stellar emission” and are shown in Figure 1.
Surface photometry was measured on the galaxies using the IRAF task ELLIPSE, following the methodology of Pahre (1999). The full fitting was first done on the m image, then the flux at each isophote was measured for the other wavelengths using the isophotal shapes defined from the m image. Circular aperture magnitudes were also measured for each galaxy. Corrections for flux lost due to the PSF were applied to the surface brightness and aperture magnitude profiles in the manner described in Pahre (1999). One-dimensional models of bulge, exponential disk, and the two combined were fit to the isophotal surface brightness profiles and the circular aperture magnitude curves of growth. The values from the two approaches were averaged, and half the difference is taken as the uncertainty.
The morphological types, photometric parameters, and model fits for each model are tabulated in Table 1. The near-IR and mid-IR colors in the table were measured within matched apertures defined by the mag arcsec-2 isophote from the 2MASS XSC. Uncertainties are tabulated for the model fits to ; uncertainties for the true colors are currently heavily dominated by the systematic effects both of the stellar calibration and the extended source calibration based on NGC 777 adopted here.
5 Infrared Galaxy Classification
5.1 Morphology of the m Emission
The classification is based simply on the visual appearance at 8 µm or perhaps even better, on the visual appearance of non-stellar emission at 8 µm, as shown in Figure 1. The reason is easy to see: the dust emission tracks interstellar matter, which is predominantly resident in spiral arms. Arm/interarm contrast is significantly higher in 8 µm images than in visible images. While not directly shown here, we note that ultraviolet light also shows high contrast, but can be affected significantly by dust obscuration.
5.2 Infrared Colors of the Stellar Population
The IRAC color varies systematically with galaxy morphological type as shown in Figure 2. This is probably a population age effect: young A0V stars have color of zero, an intermediate-age population matches the bluer color of a K0 III star (-0.06 mag), and an old stellar population matches the yet bluer colors for later-type K2 III-M0 III stars of to mag. While this is a rather simplistic exploration of the intrinsic colors of the stellar population, it does highlight a general feature of the color: that it becomes redder for galaxies of increasingly late types.
The amount by which the color changes with galaxy type is mag. This is similar to the slope for the optical color , but significantly smaller than other optical colors , , and Buta & Williams (1995). While this might imply that IR classification based on is more prone to the effects of photometric errors, the optical colors are affected by the systematic error of internal reddening and hence by inclination effects. For this reason, we argue that IR colors are more representative of the properties of the underlying stellar populations.
The near-infrared color shows significantly more scatter than the IRAC-only colors. Part of this is due to the larger photometric errors from the 2MASS measurements, which range from 0.02 to 0.11 mag. Another part of the large scatter may lie in imperfect matching of the isophotal aperture between 2MASS and IRAC.
5.3 Infrared Colors of the Non-Stellar Emission
The IRAC color varies with galaxy type even more strongly than (Figure 2). This is because the m filter is detecting the warm dust, probably emitting mostly via the PAH emission features at and m (Gillett, Forrest, & Merrill 1973).Galaxies of increasing morphological type show increasing ratios of PAH emission at m to stellar mass at m, hence this color becomes redder with . The fraction of 8 µm light from non-stellar emission ranges from 10% for the early-type galaxies to % for the late types.
5.4 Infrared Bulge-to-Disk Ratios
Since starlight at m very nearly follows the Rayleigh-Jeans limit of blackbody emission for K, the colors of both early- and late-type stars are all nearly the same. There is virtually no dust extinction at this wavelength either, as any standard extinction law predicts only a few percent of the extinction compared to optical wavelengths. The m light therefore traces the stellar mass distribution free of dust obscuration effects.
The bulge-to-disk-ratios for the galaxies progressively decrease with galaxy morphological type, demonstrating that there is an increasing stellar mass fraction in the disk component of the later-type galaxies. Unlike optical wavelengths, this effect cannot be ascribed to the emission of a small number of luminous young stars which have little total mass. Since the m light is virtually all stellar, the bulge-to-disk-ratios we derive here will match the -band.
6 Discussion of Individual Objects
Galaxy NGC 5548 has a powerful AGN of type Sy 1.5 in its nucleus, which appears very red relative to the starlight (Figure 1). It has been studied extensively as part of the agnwatch project Peterson et al. (2002). No correction for the nuclear emission was done, hence the galaxy is plotted as an open symbol in Figure 2.
A number of other galaxies show much weaker evidence, via both spatially resolved point source nuclei and reddening trends in , for active nuclei (see Willner et al. 2004 for the case of M 81). Spatial and spectral separation of AGN will be the subject of a future contribution.
Lenticular early-type galaxies NGC 5363, 1023, and 4203 all show evidence of spatially resolved dust emission at m, and are discussed in a companion paper Pahre et al. (2004).
Nearly edge-on spiral NGC 5746 is classified by RC3 as SAB(rs)b/sp?, which reflects considerable uncertainty due to its prominent dust lane. The IRAC images easily penetrate the obscuration and demonstrate that it is SB(r)ab, with the presence of a large inner ring and an apparent bar roughly perpendicular to the plane of the sky.
7 Summary
IRAC images offer powerful new tools for studying both the stellar and interstellar components of nearby galaxies. Both the relative amounts of these components and their spatial distributions can be used to classify galaxies. Early indications from this limited sample are that such classifications correlate well with the traditional Hubble scheme. Three of four classification schemes suggested are strictly quantitative and therefore can be applied without personal biases; the fourth could probably be made quantitative through Fourier analysis techniques.
The principal advantages of a mid-infrared classification scheme are:
-
1.
The mid-IR traces both interstellar matter and starlight without the effects of extinction.
-
2.
The mid-IR dust emission, particularly the PAH feature at m, is a clear tracer of the presence of interstellar matter. The emission shows high contrast against stellar emission at the same wavelength.
-
3.
The colors of stellar photospheres in the mid-IR vary only a small amount with population age or mass function, and hence the stellar emission is a direct tracer of stellar mass. The bulge-to-disk-ratios measured at and m therefore sample the mass ratio of the stellar content, not a mixture of stellar content and recent massive star formation activity.
-
4.
The stellar photospheric component is straightforward to model based on the and m images, and hence provides a simple framework for separating the stellar from the ISM emission at and m.
The mid-IR emission is a more natural tracer of the underlying astrophysics that gives rise to the galaxy sequence, namely the star formation rate per unit stellar mass. Future work may include a quantitative investigation of the properties of galactic potentials, bars, and spiral arms. As Figure 1 demonstrates, such galaxy features can be imaged strikingly well at mid-infrared wavelengths.
References
- Abraham, Valdes, Yee, & van den Bergh (1994) Abraham, R. G., Valdes, F., Yee, H. K. C., & van den Bergh, S. 1994, ApJ, 432, 75
- Abraham et al. (1996) Abraham, R. G., van den Bergh, S., Glazebrook, K., Ellis, R. S., Santiago, B. X., Surma, P., & Griffiths, R. E. 1996, ApJS, 107, 1
- van den Bergh (1976) van den Bergh, S. 1976, ApJ, 206, 883
- Block & Puerari (1999) Block, D. L. & Puerari, I. 1999, A&A, 342, 627
- Bromley et al. (1998) Bromley, B. C., Press, W. H., Lin, H., & Kirshner, R. P. 1998, ApJ, 505, 25
- Buta (1995) Buta, R. 1995, ApJS, 96, 39
- Buta et al. (1994) Buta, R., Mitra, S., de Vaucouleurs, G., & Corwin, H. G. 1994, AJ, 107, 118
- Buta & Williams (1995) Buta, R. & Williams, K. L. 1995, AJ, 109, 543
- Connolly et al. (1995) Connolly, A. J., Szalay, A. S., Bershady, M. A., Kinney, A. L., & Calzetti, D. 1995, AJ, 110, 1071
- Fazio et al. (2004) Fazio, G. G., et al. 2004, ApJS, this issue
- Frogel et al. (1978) Frogel, J. A., Persson, S. E., Matthews, K., & Aaronson, M. 1978, ApJ, 220, 75
- Gillett, Forrest, & Merrill (1973) Gillett, F. C., Forrest, W. J., & Merrill, K. M. 1973, ApJ, 183, 87
- Helou et al. (2004) Helou, G. X., et al. 2004, ApJS, this issue
- Ho, Filippenko, & Sargent (1997) Ho, L. C., Filippenko, A. V., & Sargent, W. L. W. 1997, ApJS, 112, 315
- Hubble (1926) Hubble, E. P. 1926, ApJ, 64, 321
- Hubble (1936) Hubble, E. P. 1936, Realm of the Nebulae (New Haven: Yale University Press)
- Jarrett (2000) Jarrett, T. H. 2000, PASP, 112, 1008
- Kochanek, Pahre, & Falco (2000) Kochanek, C. S., Pahre, M. A., & Falco, E. E. 2000, ApJ, submitted (astro-ph/0011458)
- Kormendy (1979) Kormendy, J. 1979, ApJ, 227, 714
- Marcum et al. (2001) Marcum, P. M., et al. 2001, ApJS, 132, 129
- Morgan & Mayall (1957) Morgan, W. W., & Mayall, N. U. 1957, PASP, 69, 409
- Naim et al. (1995) Naim, A., et al. 1995, MNRAS, 274, 1107
- Odewahn et al. (1996) Odewahn, S. C., Windhorst, R. A., Driver, S. P., & Keel, W. C. 1996, ApJ, 472, L13
- Okamura, Kodaira, & Watanabe (1984) Okamura, S., Kodaira, K., & Watanabe, M. 1984, ApJ, 280, 7
- Pahre (1999) Pahre, M. A. 1999, ApJS, 124, 127
- Peterson et al. (2002) Peterson, B. M., et al. 2002, ApJ, 581, 197
- Pahre et al. (2004) Pahre, M. A., Ashby, M. L. N., Fazio, G. G., & Willner, S. P. 2004, ApJS, this issue
- Roberts & Haynes (1994) Roberts, M. S. & Haynes, M. P. 1994, ARA&A, 32, 115
- Sandage (1961) Sandage, A. 1961, The Hubble Atlas of Galaxies (Washington: Carnegie Institution)
- de Vaucouleurs (1959) de Vaucouleurs, G. 1959, Handbuch der Physik, 53, 275
- de Vaucouleurs (1960) de Vaucouleurs, G. 1960, AJ, 65, 51
- de Vaucouleurs et al. (1991) de Vaucouleurs, G., de Vaucouleurs, A., Corwin, H. G., Buta, R. J., Paturel, G., & Fouque, P. 1991, Third Reference Catalogue of Bright Galaxies (Springer-Verlag: New York)
- Werner et al. (2004) Werner, M. W., et al. 2004, ApJS, this issue
- Willner et al. (2004) Willner, S. P., et al. 2004, ApJS, this issue
![[Uncaptioned image]](/html/astro-ph/0405594/assets/x2.png)

| Galaxy | Type | ||||||||||
|---|---|---|---|---|---|---|---|---|---|---|---|
| name | km s-1 | arcsec | mag | mag | mag | mag | |||||
| NGC 777 (catalog ads/sa.spitzer#0004431104) | E1 Sy2 | -5.0 | 4985 | 51.1 | 0.840 | 8.508 | 0.092 | -0.165 | 0.004 | 14.320 | 2.634 |
| NGC 5077 (catalog ads/sa.spitzer#0004478976) | E3-4;LINER Sy1.9 | -5.0 | 2817 | 57.2 | 0.700 | 8.309 | 0.106 | -0.130 | 0.062 | 13.848 | 10.153 |
| NGC 5813 (catalog ads/sa.spitzer#0004490496) | E1-2 | -5.0 | 1972 | 90.6 | 0.770 | 7.592 | 0.079 | -0.137 | -0.016 | 0.875 | 0.114 |
| NGC 5363 (catalog ads/sa.spitzer#0004484352) | E/S0pec[I0?] | -3.5 | 1139 | 102.5 | 0.740 | 6.991 | 0.084 | -0.126 | 0.521 | 4.745 | 1.879 |
| NGC 1023 (catalog ads/sa.spitzer#0004432640) | SB(rs)0- | -3.0 | 637 | 181.0 | 0.380 | 6.318 | -0.036 | -0.143 | -0.007 | 2.708 | 1.833 |
| NGC 4203 (catalog ads/sa.spitzer#0004457216) | SAB0-: LINER | -3.0 | 1086 | 77.3 | 0.940 | 7.517 | 0.124 | -0.101 | 0.250 | 1.434 | 0.485 |
| NGC 5548 (catalog ads/sa.spitzer#0004486656) | (R’)SA(s)0/a Sy1.5 | 0.0 | 5149 | 26.3 | 0.940 | 9.547 | 0.204 | 0.546 | 2.545 | 6.128 | 3.619 |
| NGC 6340 (catalog ads/sa.spitzer#0004492032) | SA(s)0/a LINER | 0.0 | 1198 | 51.4 | 0.940 | 8.506 | 0.076 | -0.114 | 0.331 | 0.692 | 0.101 |
| NGC 3031 (catalog ads/sa.spitzer#0006629120) | SA(s)ab;LINER Sy1.8 | 2.0 | -34 | 487.6 | 0.510 | 3.896 | 0.285 | -0.111 | 1.124 | 0.570 | 0.076 |
| NGC 5746 (catalog ads/sa.spitzer#0004489728) | SAB(rs)b? sp | 3.0 | 1724 | 162.2 | 0.260 | 6.934 | -0.119 | -0.102 | 1.256 | 0.335 | 0.040 |
| NGC 3147 (catalog ads/sa.spitzer#0004441856) | SA(rs)bc Sy2 | 4.0 | 2820 | 83.1 | 0.820 | 7.523 | 0.319 | -0.053 | 2.451 | 0.511 | 0.064 |
| NGC 1961 (catalog ads/sa.spitzer#0004435712) | SAB(rs)c LINER | 5.0 | 3934 | 78.6 | 0.670 | 7.952 | 0.224 | -0.077 | 2.545 | 0.405 | 0.041 |
| NGC 5669 (catalog ads/sa.spitzer#0004488960) | SAB(rs)cd | 6.0 | 1385 | 55.9 | 0.380 | 10.360 | 0.549 | -0.033 | 2.664 | 0.341 | 0.189 |
| NGC 6689 (catalog ads/sa.spitzer#0004494336) | SBcd | 6.0 | 467 | 38.1 | 0.580 | 10.336 | -0.084 | -0.045 | 2.103 | 0.109 | 0.033 |
| NGC 300 (catalog ads/sa.spitzer#0006069760) | SA(s)d | 7.0 | 144 | 199.4 | 0.620 | 7.063 | 0.371 | -0.017 | 2.079 | 0.007 | 0.003 |
| NGC 5668 (catalog ads/sa.spitzer#0004488192) | SA(s)d | 7.0 | 1583 | 16.2 | 1.000 | 11.781 | 1.082 | -0.047 | 2.351 | 0.126 | 0.052 |
| NGC 5204 (catalog ads/sa.spitzer#0004480512) | SA(s)m HII | 9.0 | 201 | 42.1 | 0.680 | 10.117 | 0.159 | -0.015 | 1.840 | 0.026 | 0.020 |
| NGC 1156 (catalog ads/sa.spitzer#0004434176) | IB(s)m | 10.0 | 375 | 70.5 | 0.400 | 9.468 | 0.129 | -0.007 | 2.192 | 0.025 | 0.009 |