Can Supermassive Black Holes Sufficiently Heat Cool Cores of Galaxy Clusters?
Abstract
Activities of a supermassive black hole or active galactic nucleus in the central galaxy of a cluster of galaxies have been promising candidates for heating sources of cool cluster cores. We estimate the masses of black holes using known correlations between the mass of a black hole and the velocity dispersion or the luminosity of the host galaxy. We find that the masses are and the central X-ray luminosities of the host clusters (“the strength of the cooling flow”) are well below the Eddington luminosities. However, we do not find a correlation between the mass and the central X-ray luminosity of the host cluster. If the heating is stable, this seems to contradict a simple expectation if supermassive black holes are the main heating source of a cluster core. Moreover, if we assume a canonical energy conversion rate (10%), black holes alone are unable to sufficiently heat the clusters with strong centrally peaked X-ray emission (“massive cooling flows”) over the lifetime of cluster cores. These results may indicate that massive cooling flows are a transient phenomenon, which may be because the black holes are activated periodically. Alternatively, in the massive cooling flow clusters, the energy conversion rate may be larger than 10%, that is, the black holes may be Kerr black holes.
1 Introduction
Clusters of galaxies are the largest gravitationally bound virialized objects in the universe. They are filled with hot X-ray gas with temperatures of – keV. The gas is thought to be heated by the energy released when clusters gravitationally collapsed. While the gas cooling through the X-ray radiation is inefficient in most regions of a cluster, it is very efficient in the central region because of the high gas density. From X-ray observations, it can be estimated that the thermal energy of the gas within cluster cores is lost radiatively within yr. The gas cooling should decrease the temperature and pressure of the gas at the cluster cores, and the weight of the overlying gas should produce gas flows toward the cluster centers. The flows are called “cooling flows” and the idea has prevailed for about 30 years (Fabian, 1994).
Recent X-ray observations showed that the gas in the central regions of clusters is not cooling as much as previously believed. This is indicated by the lack of metal line emission that is characteristic of cooling X-ray gas (e.g. Ikebe et al., 1997; Makishima et al., 2001; Peterson et al., 2001; Tamura et al., 2001; Kaastra et al., 2001; Matsushita et al., 2002). This means that the above simple cooling flow picture is not correct and that there must be some heating sources balancing the energy loss through X-ray emission in the central regions of clusters.
There are several heating models such as heat conduction (e.g. Takahara & Takahara, 1981; Tucker & Rosner, 1983; Friaca, 1986; Gaetz, 1989; Böhringer & Fabian, 1989; Sparks, 1992; Saito & Shigeyama, 1999; Narayan & Medvedev, 2001), acoustic waves propagating from the outside of a cluster core (Fujita, Suzuki, & Wada, 2004), or magnetohydrodynamic (MHD) effects (Makishima et al., 2001). At present, the most promising candidate for the heating source is the supermassive black hole at the center of the giant elliptical cluster-center galaxy (e.g. Tucker & Rosner, 1983; Rephaeli, 1987; Böhringer & Morfill, 1988; Binney & Tabor, 1995; Soker et al., 2001; Ciotti & Ostriker, 2001; Böhringer et al., 2002; Churazov et al., 2002; Soker, Blanton, & Sarazin, 2002; Reynolds, Heinz, & Begelman, 2002; Kaiser & Binney, 2003). In fact, the Chandra X-ray observatory has shown that the strong activities of the supermassive black holes disturb hot X-ray gas in the central regions of clusters (e.g. Fabian et al., 2000; McNamara et al., 2000; Blanton et al., 2001; McNamara et al., 2001; Mazzotta et al., 2002; Fujita et al., 2002; Johnstone et al., 2002; Kempner, Sarazin, & Ricker, 2002; Takizawa et al., 2003). In many clusters, bubbles of high energy particles have been found; it is expected that jets produced by the supermassive black holes inflate those bubbles. Moreover, numerical simulations have suggested that the bubbles move outward in a cluster by buoyancy, thus mixing the surrounding hot X-ray gas (e.g. Churazov et al., 2001; Quilis, Bower, & Balogh, 2001; Saxton, Sutherland, & Bicknell, 2001; Brüggen & Kaiser, 2002; Basson & Alexander, 2003). As a result of the mixing, hot X-ray gas in the outer region of the cluster is brought into, and subsequently heats the cluster center. Moreover, Chandra found that acoustic waves formed through jet activities are propagating in the hot X-ray gas of the Perseus cluster (Fabian et al., 2003). Through the viscosity of the gas, the waves may heat the surrounding gas.
The mass of a supermassive black hole generally needs to be large () to balance the cooling of X-ray gas regardless of the actual heating mechanism (e.g. bubbles, waves, and so on), if the strong X-ray emission from the cluster is not a transient phenomenon (Fabian, Voigt, & Morris, 2002). Moreover, relatively high heating efficiency may be required. For example, assuming Bondi accretion, XMM-Newton observations showed that the supermassive black hole at the center of the Virgo cluster has to convert 5% of the rest mass of the accreted gas into thermal energy of the surrounding gas to prevent cooling at least at present (Churazov et al., 2002, see also Di Matteo et al. 2003). This is close to a canonical value that is often used in this kind of studies (%). In this paper, we derive the masses of supermassive black holes and compare the maximum energy they can produce with the total energy released as X-rays from the central regions of the clusters. In this paper, we assume (), , and unless otherwise noted.
2 Samples and Analysis
2.1 Black Hole Masses
We study 53 clusters that have been observed with the ROSAT satellite (Peres et al., 1998), and belong to the X-ray flux limited sample of 55 clusters (Edge, Stewart, & Fabian, 1992). Unfortunately, clusters of galaxies are generally distant, and the mass of the supermassive black hole at the center of a cluster cD galaxy has been directly measured only for a few clusters. However, it has been known that the mass of the black hole is related to the properties of the host galaxy. Using HST and other observations, the relations have been determined more exactly than early studies (e.g. Magorrian et al., 1998). In this paper, we use the relations between the black hole and the host galaxy to obtain the black hole mass. The mass of the supermassive black hole at the center of a cluster cD galaxy can be obtained from empirical – and – relations, where is the mass of a supermassive black hole, is the velocity dispersion of stars in the host galaxy, and is the -band absolute magnitude of the host galaxy. For the – relation, we adopt
| (1) |
(Gebhardt et al., 2000), and for the – relation, we adopt
| (2) |
(McLure & Dunlop, 2002). The coefficients are slightly different from those in the original papers because of differences in the assumed cosmological parameters. There are more recent studies of the – relation that give steeper slopes; Tremaine et al. (2002) obtained 4.02 and Ferrarese (2002) found 4.58. Tremaine et al. (2002) discussed the difference between Tremaine et al. (2002) and Ferrarese (2002) and indicated that the large value obtained by Ferrarese (2002) is due to inappropriate treatment of central velocity dispersion. We confirmed that the difference between Gebhardt et al. (2000) and Tremaine et al. (2002) is so small that it does not affect the results in this paper (see Figure 26 in Pinkney et al., 2003). More recently, Pinkney et al. (2003) studied the – relation only for early-type galaxies and the slope they obtained is almost the same as that obtained by Gebhardt et al. (2000), although the number of galaxies in the sample is only 10. From these reasons, we use the result of Gebhardt et al. (2000). The optical data for the galaxies at cluster centers, such as the velocity dispersions and absolute magnitudes, are obtained from the HYPERLEDA database 111http://leda.univ-lyon1.fr/. If there are several measurements for a given cluster, we adopted the latest one. Among the 53 clusters, the velocity dispersions of the central galaxies are measured for 29 clusters. Since there are only 14 galaxies for which the -band magnitudes are obtained, we use -band magnitudes for other galaxies; -band magnitudes have been measured for 40 galaxies including the above 14 galaxies. For the galaxies for which only -band magnitudes are obtained, the -band magnitudes are transformed to the -band magnitudes using – color, where the color is assumed to be the average of the 14 galaxies, –. The black hole masses are shown in Table 1; the black hole mass derived from the – relation is referred to as and that derived from the – relation is referred to as . There are 43 clusters for which or can be determined. The errors in the black hole masses are calculated using the worst case ranges given in equations (1) and (2).
2.2 X-Ray Luminosities
In addition to comparing current X-ray luminosities of clusters and the masses of the central black holes, we compare the total energy released in X-rays from the central region of clusters throughout the cluster lifetime with the maximum energy that the black holes can supply. We use the ROSAT data obtained by Peres et al. (1998). While data from Chandra and XMM-Newton might be better suited for our purpose, ROSAT data are the only ones available for a sufficiently large number of clusters to conduct a statistically relevant uniform study.
The hot gas in a cluster core loses its thermal energy through X-ray emission. Without an energy supply, the gas temperature would go to zero within yr (Fabian, 1994). The total energy that must be supplied to prevent the cooling depends on the age of the cluster core (), which should be larger than that of the cluster itself. In this paper, we assume that cluster cores formed at because numerical simulations indicated that X-ray emission from a cluster has not changed much since then (Eke, Navarro, & Frenk, 1998), and because a significant part of the X-ray emission from a cluster comes from its central region including the core. Note that the simulations done by Eke et al. (1998) include neither cooling nor heating. The hot gas in the central region of a cluster is generally in pressure equilibrium with the gravity of dark matter because of the small sound crossing time. Therefore, the simulations done by Eke et al. (1998) indicate that the gravitational structure of cluster cores formed at . In actual clusters, observations suggest that both cooling and heating are effective but they appear to be well balanced (Peterson et al., 2001; Tamura et al., 2001; Kaastra et al., 2001). In fact, Allen, Schmidt, & Fabian (2001) showed that temperature profiles among clusters are similar and that the central temperatures drop only a factor of even for “cooling flow clusters” (see also Ikebe, 2001). Although there is no consensus on the mechanism that keeps the balance (for thermal conduction, see Ruszkowski & Begelman, 2002; Kim & Narayan, 2003), the balanced cooling and heating may mean that the gas motion in the central regions of clusters is slow and that the X-ray emission from cluster cores reflects the gravitational structure there, which formed at . Since there is no reason that is a special epoch, we assume that the cooling and heating have been balanced since the formation of the cluster core, and thus we assume that the X-ray emission from the core has not changed much since . In fact, Valdarnini (2002) performed numerical simulations including both cooling and heating and showed that the X-ray luminosity of a cluster has not changed or even has decreased since (high resolution simulations in his Figure 11). The heating sources of the gas in these simulations are supernovae, not supermassive black holes. However, since the radiatively cooled gas is the fuel for both sources, the results should be at least qualitatively the same. The reason for the decrease in X-ray luminosity is that radiative cooling dominates heating before enough stars are formed out of the cooled gas. After the cooling and heating are balanced, the central gas density and X-ray luminosity of the cluster decrease. Therefore, although we estimate the required energy supply from a black hole, assuming that the X-ray luminosity of a cluster core has been unchanged for , the supply may be underestimated if we fix the X-ray luminosity at the observed value at .
On the other hand, semi-analytic models of galaxy formation predict that the supermassive black holes at galaxy centers gain most of their mass at – (Haehnelt & Kauffmann, 2002; Hatziminaoglou et al., 2003; Volonteri, Haardt, & Madau, 2003). Thus, we also assume that the formation epoch of the supermassive black holes is .
Since we assume that cluster cores formed at , the hot X-ray gas within radii where the cooling time of the gas is Gyr (the look-back time for ) must be heated. Peres et al. (1998) listed the X-ray luminosities of 53 clusters within radii where the cooling time of hot X-ray gas is 13 Gyr. In a classical cooling flow model, the central X-ray luminosity is correlated with the strength of the cooling flow (Fabian, 1994). We modify the central X-ray luminosities listed by Peres et al. (1998) into those for the cooling time of 7.7 Gyr to estimate the energy supplied by supermassive black holes.
In order to modify the central X-ray luminosity, we need to find the density profile of the X-ray gas in a cluster. We assume that a cluster is isothermal. For “cooling flow clusters,” Chandra observations showed that the temperature at the center is of the average (Allen et al., 2001). However, this temperature drop does not affect photon counts in the ROSAT band (at most %, see Mohr et al., 1999). A parametric description of the cluster gas density profile has often been used, and it is called the -model (e.g. Cavaliere & Fusco-Femiano, 1976). Assuming spherical symmetry, the model
| (3) |
is fitted to the measured surface brightness profile, where is the projected distance from the cluster center. This yields values for the core radius, , the parameter, , and the normalization, . From the fit values, the radial gas density distribution can be constructed ( model);
| (4) |
If excess emission (so-called cooling flow) is seen in the innermost region of a cluster, the surface profile can be fitted with two -model functions
| (5) |
where and . In this case, the density profile is given by
| (6) |
where .
The results of the fits are shown in Table 2; the results of single--model fits are represented by subscript 2. Among 106 clusters investigated by Reiprich & Böhringer (2002), there are 24 clusters that overlap with the 53 clusters studied by Peres et al. (1998) and that the qualities of the data are high enough. For these clusters, we fit the surface brightness with two models without the assumption of and obtain the density profile (equation [6]). The selection criteria of the clusters with high data quality are (1) ROSAT PSPC pointed observations had been made, and (2) and . These clusters are indicated by ‘RB2’ in Table 2.
Among the remaining, 22 clusters were studied by Mohr, Mathiesen, & Evrard (1999). For the clusters with central excess, they fit the surface brightness and obtain density profiles assuming that . Since they presented only the central gas density, , for the clusters with a central excess, we estimate and by solving equations
| (7) |
| (8) |
For the Virgo cluster, we use the result of a double--model fit done by Matsushita et al. (2002). For the rest clusters, we use the results of single--model fits obtained by Reiprich & Böhringer (2002). These clusters are indicated by ‘RB1’ in Table 2.
Unfortunately, -model fits have not yet been studied systematically with Chandra and XMM-Newton. However, for the Coma cluster, for example, Neumann et al. (2003) determined that –340 kpc and –0.85, which is not much different from the results obtained with ROSAT (Table 2).
Peres et al. (1998) defined a cooling radius, , as the radius at which the cooling time of X-ray gas is Gyr for their cosmological parameters (, , and ) and presented derived in their Table 5. Below, we use the PSPC data in Peres et al. (1998) if a cluster was observed by both PSPC and HRI. Since the cooling time of X-ray gas is proportional to for a given temperature, and since , Gyr in Peres et al. (1998) corresponds to Gyr for our cosmological parameters, where is the ratio of the Hubble constant we assumed to that of Peres et al. (1998). (In actual calculations, we consider the effect of . Thus is not exactly 1.4.) Thus, assuming that a cluster is isothermal at , the radius at which Gyr () must satisfy the relation:
| (9) |
Here corresponds to . We define to be discriminated from .
Peres et al. (1998) also derived X-ray luminosities of clusters within their cooling radii, , for their cosmological parameters (their Table 5). The X-ray luminosity of a cluster within for our cosmological parameters is estimated by
| (10) |
In Table 1, we present . The modified luminosity, , is always smaller than .
3 Discussion
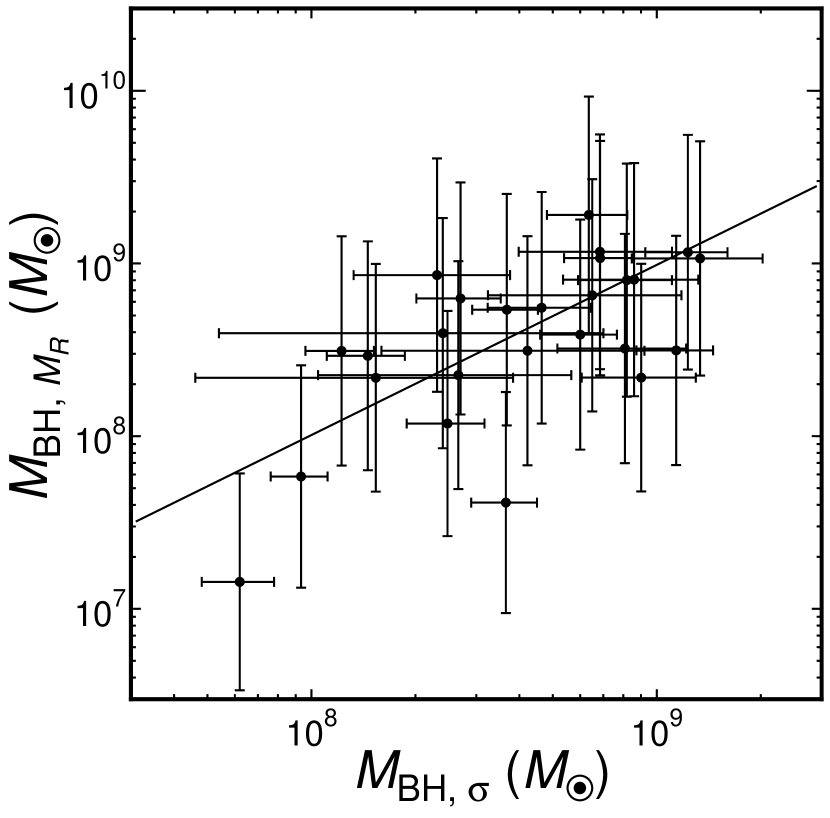
Contrary to normal elliptical galaxies, the central galaxies of clusters often have diffuse optical envelopes; thus, the absolute magnitude depends on the radius within which observers measure the galactic luminosity. Unfortunately, the radii are not defined for the galaxies listed at HYPERLEDA, which increases the overall uncertainty. Thus, as the mass of a black hole (), we adopt that derived from the – relation () rather than that derived from the – relation () for 26 clusters for which both velocity dispersion and or -band absolute magnitude of the central galaxy are obtained. We note, however, that there is no systematic difference between and (Figure 1). In general the error bars of are much larger than those of , which blurs the correlation (Figure 1). If only (or ) is obtained, we call it .
Figure 2 shows the central X-ray luminosity of a cluster versus the mass of the supermassive black hole. As can be seen, there is no correlation between these parameters. In fact, a Spearman rank coefficient is almost zero (), which means no correlation. This seems to contradict the idea that a supermassive black hole is the main heating source of the cluster core; if the supermassive black hole were the sole heating source, one would expect a larger central X-ray luminosity for a larger black hole mass. In Figure 2, we present the Eddington luminosity:
| (11) |
(Shapiro & Teukolsky, 1983). Since , the energy injection rates from black holes at present do not need to be super-Eddington or unrealistically high.
If we assume a canonical radiative efficiency of , the total energy that a supermassive black hole can release is , where is the velocity of light. On the other hand, is the energy that must be supplied by the supermassive black hole if is constant. Thus, the ratio is the necessary energy conversion rate of the matter accreted onto a supermassive black hole into heating of the X-ray gas in a cluster core. Figure 3 shows that for , which means that a supermassive black hole may not prevent gas cooling by X-ray emission throughout the age of the cluster core, but note the large uncertainty. These clusters are so-called “massive cooling flow” clusters with the mass deposition rates (expected in the absence of heating) of (for , which has often been used in this field).
There are two possibilities to overcome this difficulty. One is that the radiative efficiency is larger than the canonical value (0.1). This happens if the black holes are rapidly rotating Kerr black holes. In this case, the maximum value of is 0.42, based on the binding energy of particles on the innermost stable circular orbit (Shapiro & Teukolsky, 1983). Moreover, Kerr holes also alter the energy that can be stored and extracted from the black holes (e.g. via the Blandford-Znajek mechanism). The other possibility is that a massive cooling flow or strong X-ray emission from a cluster core is a transient event. This may also be consistent with the fact that there is no correlation between the mass of a black hole and the X-ray luminosity of a cluster (Figure 2), which may indicate that the cooling and heating at the cluster center are not exactly balanced (see Soker et al., 2001). Here, we assume that the supermassive black holes we selected are an unbiased sample of the whole supermassive black hole population, and that the average of the energy conversion rates, , can be regarded as the time-average of the conversion rate for a black hole. However, since our cluster sample is flux-limited, the bright clusters tend to be preferentially selected. In order to correct for this effect, we take the average of by weighting with , where is the maximum volume within which clusters with a given luminosity can be observed. The volume is represented by , where is the total X-ray luminosity of a cluster obtained from David et al. (1993). For 43 clusters for which we could estimate the mass of supermassive black holes, the average conversion rate is . Moreover, we describe below how we correct the bias attributed to the 10 clusters for which we could not estimate the black hole masses. The X-ray luminosity and the back hole mass of a cluster are not correlated (Figure 2), and the average black hole mass for the 43 clusters is . Assuming that the black hole mass for the remaining 10 clusters is the same as the average mass, we can estimate for these clusters. If we include these 10 clusters, the average of the conversion rate is . Since is much smaller than one, the supermassive black holes can heat the surrounding hot X-ray gas of the clusters unless the past X-ray luminosities were times larger than the current values. Some of the results of numerical simulations by Valdarnini (2002) show that the X-ray luminosity of a cluster is increasing toward higher redshift (high resolution simulations in his Figure 11). However, the increase is at most a factor of 10.
There is one more possibility; the – and – relations we used may not apply to the supermassive black holes in the cD galaxies in clusters. As far as we know, there are two clusters for which the masses of the supermassive black holes have been directly measured. One is the Virgo cluster and the other is Cygnus A. The mass of the supermassive back hole at the center of the Virgo cluster is (Macchetto et al., 1997) and that of Cygnus A is (Tadhunter et al., 2003). On the other hand, the masses obtained from the – relation are and , respectively (Table 1). Thus, the values obtained from the – relation are significantly smaller than those directly measured. However, since there are only two samples, it is premature to conclude that the discrepancy generally exists for cD galaxies.
4 Conclusions
We estimated the masses of supermassive black holes, , at the centers of 43 clusters of galaxies included in an X-ray flux limited sample. We showed that using an empirical relation between and the velocity dispersion (or the luminosity) of the host galaxy. The central X-ray luminosities of the host clusters are well below the Eddington luminosities. We found that there is no correlation between and the central X-ray luminosity of the cluster core. This seems to contradict a simple expectation if a supermassive black hole is the main heating source of the cluster core. We also showed that strong X-ray emission observed in some cluster cores may not be sustained by the heating by supermassive black holes for the ages of the cluster cores. These results may indicate that the strong X-ray emission is a transient phenomenon, which may be because the black hole activities are periodic. Moreover, the clusters with the strong X-ray emission may be very effectively heated by Kerr black holes.
References
- Allen et al. (2001) Allen, S. W., Schmidt, R. W., & Fabian, A. C. 2001, MNRAS, 328, L37
- Basson & Alexander (2003) Basson, J. F. & Alexander, P. 2003, MNRAS, 339, 353
- Binney & Tabor (1995) Binney, J., & Tabor, G. 1995, MNRAS, 276, 663
- Blanton et al. (2001) Blanton, E. L., Sarazin, C. L., McNamara, B. R., & Wise, M. W. 2001, ApJ, 558, L15
- Böhringer & Fabian (1989) Böhringer, H. & Fabian, A. C. 1989, MNRAS, 237, 1147
- Böhringer et al. (2002) Böhringer, H., Matsushita, K., Churazov, E., Ikebe, Y., & Chen, Y. 2002, A&A, 382, 804
- Böhringer & Morfill (1988) Böhringer, H., & Morfill, G. E. 1988, ApJ, 330, 609
- Brüggen & Kaiser (2002) Brüggen, M. & Kaiser, C. R. 2002, Nature, 418, 301
- Cavaliere & Fusco-Femiano (1976) Cavaliere, A., & Fusco-Femiano, R. 1976, A&A, 49, 137
- Churazov et al. (2001) Churazov, E., Brüggen, M., Kaiser, C. R., Böhringer, H., & Forman, W. 2001, ApJ, 554, 261
- Churazov et al. (2002) Churazov, E., Sunyaev, R., Forman, W., & Böhringer, H. 2002, MNRAS, 332, 729
- Ciotti & Ostriker (2001) Ciotti, L., & Ostriker, J. P. 2001, ApJ, 551, 131
- David et al. (1993) David, L. P., Slyz, A., Jones, C., Forman, W., Vrtilek, S. D., & Arnaud, K. A. 1993, ApJ, 412, 479
- Di Matteo et al. (2003) Di Matteo, T., Allen, S. W., Fabian, A. C., Wilson, A. S., & Young, A. J. 2003, ApJ, 582, 133
- Edge et al. (1992) Edge, A. C., Stewart, G. C., & Fabian, A. C. 1992, MNRAS, 258, 177
- Eke et al. (1998) Eke, V. R., Navarro, J. F., & Frenk, C. S. 1998, ApJ, 503, 569
- Fabian (1994) Fabian, A. C. 1994, ARA&A, 32, 277
- Fabian et al. (2000) Fabian, A. C. et al. 2000, MNRAS, 318, L65
- Fabian et al. (2003) Fabian, A. C., Sanders, J. S., Allen, S. W., Crawford, C. S., Iwasawa, K., Johnstone, R. M., Schmidt, R. W., & Taylor, G. B. 2003, MNRAS, 344, L43
- Fabian et al. (2002) Fabian, A. C., Voigt, L. M., & Morris, R. G. 2002, MNRAS, 335, L71
- Ferrarese (2002) Ferrarese, L. 2002, in Current High-Energy Emission around Black Holes, ed. C.-H. Lee (Singapore: World Scientific)
- Friaca (1986) Friaca, A. C. S. 1986, A&A, 164, 6
- Fujita et al. (2002) Fujita, Y., Sarazin, C. L., Kempner, J. C., Rudnick, L., Slee, O. B., Roy, A. L., Andernach, H., & Ehle, M. 2002, ApJ, 575, 764
- Fujita et al. (2004) Fujita, Y., Suzuki, T. K., & Wada, K. 2004, ApJ, 600, 650
- Gaetz (1989) Gaetz, T. J. 1989, ApJ, 345, 666
- Gebhardt et al. (2000) Gebhardt, K. et al. 2000, ApJ, 539, L13
- Haehnelt & Kauffmann (2002) Haehnelt, M. G. & Kauffmann, G. 2002, MNRAS, 336, L61
- Hatziminaoglou et al. (2003) Hatziminaoglou, E., Mathez, G., Solanes, J., Manrique, A., & Salvador-Solé, E. 2003, MNRAS, 343, 692
- Ikebe (2001) Ikebe, Y. 2001, Two Years of Science with Chandra, Abstracts from the Symposium held in Washington, DC, 5-7 September, 2001.,
- Ikebe et al. (1997) Ikebe, Y. et al. 1997, ApJ, 481, 660
- Johnstone et al. (2002) Johnstone, R. M., Allen, S. W., Fabian, A. C., & Sanders, J. S. 2002, MNRAS, 336, 299
- Kaastra et al. (2001) Kaastra, J. S., Ferrigno, C., Tamura, T., Paerels, F. B. S., Peterson, J. R., & Mittaz, J. P. D. 2001, A&A, 365, L99
- Kaiser & Binney (2003) Kaiser, C. R., & Binney, J. 2003, MNRAS, 338, 837
- Kempner et al. (2002) Kempner, J. C., Sarazin, C. L., & Ricker, P. M. 2002, ApJ, 579, 236
- Kim & Narayan (2003) Kim, W. & Narayan, R. 2003, ApJ, 596, 889
- Macchetto et al. (1997) Macchetto, F., Marconi, A., Axon, D. J., Capetti, A., Sparks, W., & Crane, P. 1997, ApJ, 489, 579
- Magorrian et al. (1998) Magorrian, J., et al. 1998, AJ, 115, 2285
- Makishima et al. (2001) Makishima, K. et al. 2001, PASJ, 53, 401
- Matsushita et al. (2002) Matsushita, K., Belsole, E., Finoguenov, A., & Böhringer, H. 2002, A&A, 386, 77
- Mazzotta et al. (2002) Mazzotta, P., Kaastra, J. S., Paerels, F. B., Ferrigno, C., Colafrancesco, S., Mewe, R., & Forman, W. R. 2002, ApJ, 567, L37
- McLure & Dunlop (2002) McLure, R. J. & Dunlop, J. S. 2002, MNRAS, 331, 795
- Narayan & Medvedev (2001) Narayan, R. & Medvedev, M. V. 2001, ApJ, 562, L129
- McNamara et al. (2000) McNamara, B. R. et al. 2000, ApJ, 534, L135
- McNamara et al. (2001) McNamara, B. R. et al. 2001, ApJ, 562, L149
- Mohr et al. (1999) Mohr J. J., Mathiesen B., and Evrard A. E. 1999, ApJ, 517, 627
- Neumann et al. (2003) Neumann, D. M., Lumb, D. H., Pratt, G. W., & Briel, U. G. 2003, A&A, 400, 811
- Peres et al. (1998) Peres, C. B., Fabian, A. C., Edge, A. C., Allen, S. W., Johnstone, R. M., & White, D. A. 1998, MNRAS, 298, 416
- Peterson et al. (2001) Peterson, J. R. et al. 2001, A&A, 365, L104
- Pinkney et al. (2003) Pinkney, J. et al. 2003, ApJ, 596, 903
- Quilis et al. (2001) Quilis, V., Bower, R. G., & Balogh, M. L. 2001, MNRAS, 328, 1091
- Reiprich & Böhringer (2002) Reiprich, T. H. & Böhringer, H. 2002, ApJ, 567, 716
- Rephaeli (1987) Rephaeli, Y. 1987, MNRAS, 225, 851
- Reynolds et al. (2002) Reynolds, C. S., Heinz, S., & Begelman, M. C. 2002, MNRAS, 332, 271
- Ruszkowski & Begelman (2002) Ruszkowski, M. & Begelman, M. C. 2002, ApJ, 581, 223
- Saito & Shigeyama (1999) Saito, R., & Shigeyama, T. 1999, ApJ, 519, 48
- Saxton et al. (2001) Saxton, C. J., Sutherland, R. S., & Bicknell, G. V. 2001, ApJ, 563,
- Shapiro & Teukolsky (1983) Shapiro, S. L., & Teukolsky, S. A. 1983, Black Holes, White Dwarfs, and Neutron Stars (New York: Wiley-Interscience)
- Soker et al. (2002) Soker, N., Blanton, E. L., & Sarazin, C. L. 2002, ApJ, 573, 533
- Soker et al. (2001) Soker, N., White, R. E., David, L. P., & McNamara, B. R. 2001, ApJ, 549, 832
- Sparks (1992) Sparks, W. B. 1992, ApJ, 399, 66
- Tadhunter et al. (2003) Tadhunter, C., Marconi, A., Axon, D., Wills, K., Robinson, T. G., & Jackson, N. 2003, MNRAS, 342, 861
- Takahara & Takahara (1981) Takahara, M., & Takahara, F. 1981, Prog. Theor. Phys., 65, L369
- Takizawa et al. (2003) Takizawa, M., Sarazin, C. L., Blanton, E. L., & Taylor, G. B. 2003, ApJ, 595, 142
- Tamura et al. (2001) Tamura, T. et al. 2001, A&A, 365, L87
- Tremaine et al. (2002) Tremaine, S., et al. 2002, ApJ, 574, 740
- Tucker & Rosner (1983) Tucker, W. H. & Rosner, R. 1983, ApJ, 267, 547
- Valdarnini (2002) Valdarnini, R. 2002, ApJ, 567, 741
- Volonteri et al. (2003) Volonteri, M., Haardt, F., & Madau, P. 2003, ApJ, 582, 559
| Cluster | |||||
|---|---|---|---|---|---|
| () | () | () | () | ||
| A85 | aaThe -band magnitude is determined from the -band magnitude by . | ||||
| A119 | 0 | ||||
| A262 | aaThe -band magnitude is determined from the -band magnitude by . | ||||
| AWM7 | |||||
| A399 | aaThe -band magnitude is determined from the -band magnitude by . | 0 | |||
| A401 | aaThe -band magnitude is determined from the -band magnitude by . | 0 | |||
| A3112 | aaThe -band magnitude is determined from the -band magnitude by . | ||||
| A426 | |||||
| 2A 0335096 | aaThe -band magnitude is determined from the -band magnitude by . | ||||
| A3158 | aaThe -band magnitude is determined from the -band magnitude by . | 0 | |||
| A478 | |||||
| A3266 | aaThe -band magnitude is determined from the -band magnitude by . | 0 | |||
| A496 | aaThe -band magnitude is determined from the -band magnitude by . | ||||
| A3391 | aaThe -band magnitude is determined from the -band magnitude by . | 0 | |||
| A576 | 0 | ||||
| PKS 0745191 | aaThe -band magnitude is determined from the -band magnitude by . | ||||
| A644 | aaThe -band magnitude is determined from the -band magnitude by . | ||||
| A754 | aaThe -band magnitude is determined from the -band magnitude by . | 0 | |||
| HYD-A | aaThe -band magnitude is determined from the -band magnitude by . | ||||
| A1060 | |||||
| A1367 | aaThe -band magnitude is determined from the -band magnitude by . | 0 | |||
| Virgo | |||||
| Cent | |||||
| Coma | 0 | ||||
| A1644 | aaThe -band magnitude is determined from the -band magnitude by . | 0 | |||
| A3532 | 0 | ||||
| A1650 | |||||
| A1651 | |||||
| A1689 | |||||
| A1736 | aaThe -band magnitude is determined from the -band magnitude by . | 0 | |||
| A3558 | 0 | ||||
| A3562 | aaThe -band magnitude is determined from the -band magnitude by . | ||||
| A3571 | |||||
| A1795 | aaThe -band magnitude is determined from the -band magnitude by . | ||||
| A2029 | aaThe -band magnitude is determined from the -band magnitude by . | ||||
| A2052 | |||||
| MKW3s | |||||
| A2065 | aaThe -band magnitude is determined from the -band magnitude by . | 0 | |||
| A2063 | aaThe -band magnitude is determined from the -band magnitude by . | ||||
| A2142 | |||||
| A2199 | |||||
| A2204 | |||||
| TriAust | |||||
| A2244 | |||||
| A2256 | 0 | ||||
| Ophi | |||||
| A2255 | 0 | ||||
| A2319 | aaThe -band magnitude is determined from the -band magnitude by . | 0 | |||
| Cyg-A | aaThe -band magnitude is determined from the -band magnitude by . | ||||
| A3667 | aaThe -band magnitude is determined from the -band magnitude by . | 0 | |||
| A2597 | aaThe -band magnitude is determined from the -band magnitude by . | ||||
| Klem44 | |||||
| A4059 |
| Cluster | refaaReferences–RB1: one -model fits by Reiprich & Böhringer (2002), RB2: clusters in the catalogue of Reiprich & Böhringer (2002) fitted with two models, MME: Mohr et al. (1999), and M: Matsushita et al. (2002) | |||||||
|---|---|---|---|---|---|---|---|---|
| () | () | (kpc) | (kpc) | |||||
| A85 | 0.0556 | 67.6 | 6.53 | 36 | 259 | 0.584 | 0.711 | RB2 |
| A119 | 0.0440 | 3.18 | 353 | 0.662 | MME | |||
| A262 | 0.0161 | 85.7 | 6.49 | 10 | 97 | 0.556 | 0.556 | MME |
| AWM7 | 0.0172 | 40.7 | 9.05 | 23 | 141 | 0.678 | 0.678 | MME |
| A399 | 0.0715 | 4.88 | 333 | 0.713 | RB1 | |||
| A401 | 0.0748 | 12.8 | 1.16 | 195 | 887 | 0.696 | 0.952 | RB2 |
| A3112 | 0.0750 | 128 | 22.4 | 20 | 90 | 0.608 | 0.614 | RB2 |
| A426 | 0.0183 | 126 | 7.25 | 41 | 290 | 0.748 | 0.748 | MME |
| 2A 0335096 | 0.0349 | 126 | 16.8 | 35 | 110 | 0.978 | 0.680 | RB2 |
| A3158 | 0.0590 | 9.42 | 193 | 0.657 | MME | |||
| A478 | 0.0900 | 109 | 19.0 | 36 | 158 | 0.652 | 0.687 | RB2 |
| A3266 | 0.0594 | 5.40 | 364 | 0.744 | MME | |||
| A496 | 0.0328 | 108 | 5.60 | 17 | 200 | 0.551 | 0.733 | RB2 |
| A3391 | 0.0531 | 12.6 | 4.41 | 34 | 225 | 0.574 | 0.634 | RB2 |
| A576 | 0.0381 | 3.63 | 287 | 0.825 | RB1 | |||
| PKS 0745191 | 0.1028 | 186 | 23.9 | 33 | 132 | 0.642 | 0.653 | RB2 |
| A644 | 0.0704 | 17.9 | 2.93 | 145 | 323 | 0.733 | 0.765 | RB2 |
| A754 | 0.0528 | 6.63 | 269 | 0.614 | MME | |||
| HYD-A | 0.0538 | 107 | 15.2 | 35 | 146 | 0.924 | 0.738 | RB2 |
| A1060 | 0.0114 | 18.3 | 6.87 | 31 | 118 | 0.703 | 0.703 | MME |
| A1367 | 0.0216 | 2.87 | 260 | 0.607 | MME | |||
| Virgo | 0.0037 | 252 | 21.4 | 2 | 21 | 0.420 | 0.470 | M |
| Cent | 0.0103 | 157 | 7.10 | 9 | 99 | 0.569 | 0.569 | MME |
| Coma | 0.0232 | 7.14 | 279 | 0.705 | MME | |||
| A1644 | 0.0474 | 5.03 | 219 | 0.579 | RB1 | |||
| A3532 | 0.0539 | 6.39 | 1.70 | 154 | 638 | 0.811 | 1.234 | RB2 |
| A1650 | 0.0845 | 9.73 | 209 | 0.704 | RB1 | |||
| A1651 | 0.0860 | 19.8 | 119 | 0.616 | MME | |||
| A1689 | 0.1840 | 62.4 | 11.0 | 79 | 311 | 0.808 | 0.874 | RB2 |
| A1736 | 0.0460 | 2.92 | 273 | 0.542 | RB1 | |||
| A3558 | 0.0480 | 11.3 | 142 | 0.548 | MME | |||
| A3562 | 0.0499 | 13.4 | 71 | 0.470 | MME | |||
| A3571 | 0.0397 | 18.0 | 126 | 0.610 | MME | |||
| A1795 | 0.0616 | 73.2 | 6.30 | 50 | 299 | 0.690 | 0.873 | RB2 |
| A2029 | 0.0767 | 117 | 20.2 | 31 | 137 | 0.607 | 0.647 | RB2 |
| A2052 | 0.0348 | 71.8 | 16.1 | 44 | 110 | 1.465 | 0.678 | RB2 |
| MKW3s | 0.0450 | 44.5 | 15.2 | 55 | 118 | 1.215 | 0.692 | RB2 |
| A2065 | 0.0722 | 4.53 | 511 | 1.162 | RB1 | |||
| A2063 | 0.0354 | 21.0 | 5.79 | 51 | 201 | 0.753 | 0.748 | RB2 |
| A2142 | 0.0899 | 38.1 | 3.38 | 98 | 628 | 0.668 | 0.975 | RB2 |
| A2199 | 0.0302 | 65.2 | 13.9 | 30 | 118 | 0.663 | 0.663 | MME |
| A2204 | 0.1523 | 175 | 52.6 | 121 | 126 | 4.503 | 0.651 | RB2 |
| TriAust | 0.0510 | 14.1 | 5.06 | 155 | 455 | 0.816 | 0.816 | MME |
| A2244 | 0.0970 | 32.6 | 9.13 | 69 | 169 | 0.639 | 0.636 | RB2 |
| A2256 | 0.0601 | 6.87 | 358 | 0.828 | MME | |||
| Ophi | 0.0280 | 33.1 | 14.5 | 57 | 193 | 0.705 | 0.705 | MME |
| A2255 | 0.0800 | 3.92 | 434 | 0.792 | MME | |||
| A2319 | 0.0564 | 9.56 | 5.53 | 473 | 558 | 2.602 | 0.812 | RB2 |
| Cyg-A | 0.0561 | 294 | 11 | 0.472 | MME | |||
| A3667 | 0.0560 | 8.27 | 190 | 0.541 | MME | |||
| A2597 | 0.0852 | 120 | 6.70 | 33 | 199 | 0.689 | 0.782 | RB2 |
| Klem44 | 0.0283 | 34.2 | 3.59 | 38 | 187 | 0.589 | 0.712 | RB2 |
| A4059 | 0.0460 | 27.6 | 3.06 | 58 | 297 | 0.659 | 0.857 | RB2 |