Evidence for TeV gamma ray emission from TeV J2032+4130 in Whipple archival data
A reanalysis of data taken on the Cygnus region in 1989-90 using the Whipple Observatory atmospheric Cherenkov imaging telescope confirms the existence of the TeV J2032+4130 source reported by the Crimean Astrophysical Observatory and published by the HEGRA Collaboration. The significance at the a priori HEGRA position is 3.3. The peak signal was found at RA = 20h32m, Dec = +41∘33’. This is 0.6∘ north of Cygnus X-3 which was the original target of the observations. The flux level (12% of the level of the Crab Nebula) is intermediate between the two later observations and suggests that the TeV source is variable.
Key Words.:
gamma rays:observations1 Introduction
The most powerful technique for the discovery of cosmic sources of TeV gamma rays is the atmospheric Cherenkov technique using cameras consisting of arrays of photomultiplier tubes coupled to large optical reflectors. Such instruments have fields of view that are typically less than 5∘ and hence are not suitable for sky surveys. The usual mode of operation is to make directed observations of candidate objects (chosen from their properties at longer wavelengths) and more than a dozen sources have been thus established (Horan & Weekes horan04 (2004)). Sky surveys at these energies are comparatively insensitive and have not resulted in the detection of any new sources (Weekes, Helmken & Horine weekes79 (1979), Atkins et al. atkins04 (2004), Cui, Yan et al. cui03 (2003)). By contrast the 100 MeV space telescopes are ideally suited for sky surveys and have discovered some 270 discrete sources; more than half the sources detected by the EGRET telescope on the Compton Gamma Ray Observatory are unidentified (Hartman et al. hartman99 (1999)).
The increasing sensitivity of the ground-based gamma-ray telescopes and the ability to make two-dimensional maps of the field of view encompassed by the camera makes possible serendipitous detection of TeV gamma-ray sources in the vicinity of candidate objects or in the control regions commonly used in making such observations. Regions of the sky that include the Galactic Plane are particularly attractive for such searches. Early indications that Cygnus X-3 might be a TeV source (Vladimirsky, Stepanian & Fomin vlad73 (1973)), led to a concentration of observations in that crowded region of the sky. Recent observations have not confirmed emission from Cygnus X-3 but a two-dimensional study by the Crimean group of observations taken in 1993 suggested the existence of new source offset by 0.7∘ from Cygnus X-3 (Neshpor et al. neshpor95 (1995)). The signal was at the 6 level before taking trial factors into account. The observations were made over a six week period and correspond to a flux of 3 x 10-11 photons cm-2 s-1 above an energy of 1 TeV; this is strong source at approximately the level of the Crab Nebula, the strongest known steady source in the sky. The coordinates of the new source were Right Ascension = 20h 32m and Declination = +41∘ 37’. The uncertainty in the source position was estimated as 0.2∘. Subsequent observations by the Crimean group in the following years did not confirm the emission at this high level (Fomin fominpriv (2004)).
In a series of observations by the HEGRA group (Aharonian et al. aharonian02 (2002)), the source was independently and serendipitously detected in observations of Cygnus X-3 and the EGRET unidentified source, GeV J2035+4214 (Lamb & Macomb lamb97 (1997)). Both sets of observations encompassed the position of the Crimean source. A detection was reported based on 113 hours of observation over a three year observing campaign (1999-2001 inclusive) at the 4.6 post-trial level of significance. This large database was expanded to 279 hours with additional observations taken in 2002 and the statistical significance was increased to the 7 level (Rowell, Horns et al. rowell03 (2003)). The source location was determined to be Right Ascension (J2000) = 20h 31m 57.0s, Declination (J2000) = +41∘ 29’ 56.8” with statistical and systematic uncertainties a few minutes of arc. This position is consistent with that of the Crimean source. However the flux level was only about 3% of the Crab flux (F(1TeV) = (5.93.1) x10-13 photons cm-2 s-1) and the differential spectral index was hard (-1.9). The source was reported to be extended (6.2’) with a point source hypothesis rejected at the 3 level. However, this is a complicated region of the Galactic Plane with three EGRET sources nearby but not obviously related. The source lies close to the edge of the dense OB association, Cygnus OB2.
Following these reports we were motivated to reanalyze data taken on Cygnus X-3 with the Whipple telescope at an earlier epoch and at a somewhat lower energy threshold to search for evidence of this source.
2 Observations
Cygnus X-3 was observed using the Whipple Observatory 10m imaging telescope during the epoch 1988-1990, (O’Flaherty et al. o'flaherty92 (1992)). The observations were carried out in the ON/OFF tracking mode, with Cygnus X-3 located at the centre of the field of view. In this mode the telescope tracks the object for 38 minutes, recording an ON scan. Then during a 2 minute interval the telescope is slewed to a position 40 minutes later in Right Ascension and records a comparison OFF scan over the same range of zenith and azimuth angles. The telescope was equipped with a 109-pixel camera, consisting of 91 phototubes of diameter 2.9 cm (with a pixel separation of 0.25∘), surrounded by an outer ring of 18 phototubes with a diameter of 5 cm (with a pixel separation of 0.5∘), (Cawley et al. cawley90 (1990)). The field of view of the camera was 3.5∘ which includes the reported location of TeV J2032+4130. The signal in each phototube was amplified and converted to a digital value in which each digital count represented a signal of 1.15 photoelectrons. The camera was triggered when the signal in 2 out of the inner 91 phototubes exceeded a threshold of about 40 digital counts. Moment-fitting parameters were used to characterise the shape and orientation of each recorded Cherenkov image. Gamma-ray-like events were selected on the basis of their shape and orientation defined in a single parameter, azimuthal width (azwidth) (Vacanti et al. vacanti91 (1991)). During the season 1988-1989 this instrument was used to detect steady TeV emission from the Crab Nebula at the 20 level. No evidence was found by O’Flaherty et al. (o'flaherty92 (1992)) for steady, modulated, or pulsed emission from Cygnus X-3. A two-dimensional analysis of the field of view was not carried out at the time.
After each night’s observations, the data were archived as binary files on magnetic tapes for subsequent analysis. During the early 1990’s the entire 109-pixel camera database was transferred to digital tape (DAT). These DAT’s formed the data archive for the subsequent analysis. Table 1 summarises the database used in this analysis. Note that the precise list of the data files originally used by O’Flaherty et al. (o'flaherty92 (1992)) in the search for emission from Cygnus X-3 was no longer available.
| Year | No. of data pairs | Duration | N(on) | N(off) | S |
|---|---|---|---|---|---|
| (hours) | () | ||||
| 1989 | 43 | 26.8 | 367,783 | 368,508 | -0.8 |
| 1990 | 40 | 23.5 | 280,759 | 280,904 | -0.2 |
| Total | 83 | 50.4 | 648,542 | 649,412 | -0.8 |
In the re-analysis a small amount of the original data recorded in 1988 was omitted due to the elevated levels of electronic noise present. Slightly more data for the years 1989 and 1990 was included in the analysis. This initial selection of data was made prior to the search for gamma-ray sources. The average elevation of the observations was about 70∘. The statistical significance (S) of any excess of events seen in the ON region is calculated using the combined uncertainty in the ON and OFF event numbers (Li & Ma lima83 (1983)). There is no evidence for an excess of events from Cygnus X-3 in the unselected (raw) data.
| Trigger | 2 phototubes 40 digital counts |
|---|---|
| Shape | 0.51∘ Distance 1.1∘ |
| 0.073∘ Width 0.15∘ | |
| 0.16∘ Length 0.30∘ | |
| Orientation | 0.51∘ Distance 1.1∘ |
| Alpha 15∘ |
3 Analysis
As the Cherenkov imaging technique evolved, a more effective set of gamma-ray image criteria known as supercuts was developed, which separately utilised the shape and orientation information in the image. The Crab database of 1988-89 was used to optimise the parameters in supercuts (Punch et al. punch91 (1991)) and the criteria were subsequently applied to observations of the Crab Nebula from the 1989-90 and 1990-91 seasons giving significant improvements in sensitivity (Lang et al. lang91 (1991)). Supercuts was then adopted as the standard analysis technique for observations with this camera (Reynolds et al.reynolds92 (1993)), and, with minor modifications, has remained the standard selection method for subsequent higher resolution instruments. The supercuts selection criteria are listed in Table 2. A standard supercuts analysis of the database was made in which the image distance and alpha parameters were calculated relative to the source position reported by Aharonian et al. (aharonian02 (2002)). It was assumed that the optic axis of the camera was centred on Cygnus X-3. After de-rotation of the field of view by the parallactic angle, this location is displaced from the centre of the field of view by 0.09∘ in the x-axis (corresponding to Right Ascension) and by 0.54∘ in the y-axis (corresponding to Declination). The results are listed in Table 3. There is a 3.3 excess present at this location. As this is an a priori search location there are no trial factors to be included and the presence of a weak TeV source is confirmed.
| N(on) | N(off) | N(on)-N(off) | S | |
|---|---|---|---|---|
| Shape | 12,333 | 12,446 | -113 | -0.72 |
| Orientation | 42,607 | 42,692 | -85 | -0.29 |
| Shape+Orientation | 2031 | 1824 | +207 | +3.33 |
A two-dimensional search technique has previously been applied to the Crab Nebula database of 1988-89 by Akerlof et al. (akerlof91 (1991)). The field of view was divided using a Cartesian grid system covering an interval of 1.0∘ in both the Right Ascension and Declination directions. The grid step size was 0.1∘, giving a total of 441 mesh points. An azwidth-type analysis was carried out at each mesh point and the Crab Nebula signal appeared as an approximately two dimensional Gaussian function with a circular probable error of radius 0.21∘. This is the gamma-ray point spread function (PSF) of the instrument. A similar analysis was carried out for observations in which the Crab Nebula was deliberately offset by 0.4∘ and 1.0∘ from the centre of the field of view. In each case a signal was detected. The efficiency of the telescope (measured in hr-1) was undiminished when the source was offset by 0.4∘ and was reduced to 45% for the offset of 1.0∘. At each offset the source location reconstructed from the shower images agreed with the tracking location to within approximately 0.03∘, with the dominant error attributed to the telescope angle encoders and drive system.
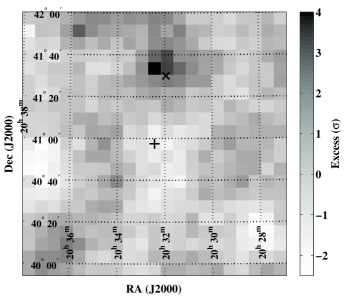
We applied this two-dimensional analysis to the Cygnus X-3 database, where this time events were selected using the supercuts criteria at the 441 mesh points. Figure 1 is a sky map of the ON minus OFF signal over the grid. The significance of the pre-trial peak signal is 4.0, corresponding to an excess of 242 events. The peak occurs at the grid point 0.0∘ in the Right Ascension direction and +0.6∘ in Declination, (RAJ2000 = 20h32m, DecJ2000 = +41∘33’). which is compatible with both the Crimean and HEGRA positions. As a conservative estimate of the number of trial factors introduced by searching “near” the HEGRA position we have used the value 7, which corresponds to a search over one quarter of the field of view. This reduces the significance of the peak to 3.5. If a linear fall-off in sensitivity with displacement over the interval of 0.4∘ to 0.6∘ from the centre of the field of view is assumed, the gamma-ray rate corresponds to 12% of the Crab flux, (5.61.6stat0.8sys) x10-12 photons cm-2 s-1, above the peak energy response of 0.6 TeV. The systematic error is representative of the uncertainty in the off-centre sensitivity of the telescope.
There is no evidence that the signal is variable over the two years of observation. Given the gamma-ray PSF value and the weak nature of the signal, we are unable to determine the angular size of the source.
Although the signal is too weak to allow the determination of an energy spectrum we have investigated the effect of raising the energy threshold in software. The image parameter size measures the total number of photoelectrons in a Cherenkov image, and therefore the gamma-ray energy. Table 4 lists the results when the data is selected on the basis of image size. The cutoff point of 600 digital counts corresponds to a doubling of the peak energy response to about 1.2 TeV. It would appear that the signal is not confined to low energy events.
| N(on) | N(off) | N(on)-N(off) | S | |
|---|---|---|---|---|
| Size 600 dc | 1,574 | 1,405 | 169 | +3.10 |
| Size 600 dc | 395 | 322 | 73 | +2.73 |
The use of software padding procedures, in which Gaussian noise is added in
order to equalise the night-sky noise in the ON and OFF regions, was not part
of the standard analysis technique for the 109-pixel camera when this data
was taken.
Padding was only used in cases of “extreme” brightness differences (Punch
et al. punch91 (1991)).
The Cygnus X-3 ON and OFF regions have similar sky brightness. The night-sky
noise in each phototube typically had a standard deviation of 34
photoelectrons, with the difference between the ON and OFF regions having an
average value of 0.05 photoelectrons.
However, given the weakness of the signal detected from TeV J2032+4130, the
effect of software padding on the database was investigated.
Where and are the standard deviations of the sky
noise in a particular phototube in the ON and OFF regions respectively,
the standard deviation of noise to be added in the less noisy region is given
by
| (1) |
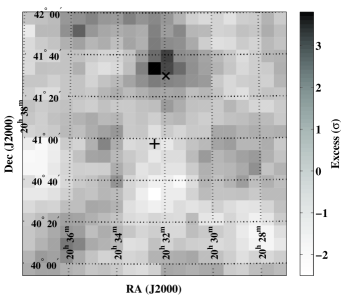
Software padding is discussed in detail by Lessard et al. (lessard (2001)). The two-dimensional analysis was repeated ten times, where in each case software padding using a different seed for the random number generator was applied. In order to more closely reproduce the effect of real night-sky noise on the event trigger rate, the trigger threshold was raised to two phototubes exceeding 45 digital counts. This creates a population of sub-threshold events which may trigger the system after the addition of noise. In each case a peak was found at the HEGRA position. Because a random feature was introduced into the analysis, the pre-trials peak significance varies between 3.1 and 4.5. To produce a robust padded analysis the average number of events from the ten analyzes which pass the supercuts criteria at each mesh point was calculated. These averages were then used to determine the ON minus OFF significance at each mesh point. The resulting sky map is illustrated in Figure 2, and is very similar to the sky map for the unpadded data, confirming that the effect seen does not result from a difference is night-sky brightness. The significance of the pre-trials peak is 3.8. Given that some noise has been added and the trigger threshold has been increased, this slight reduction in significance is not unexpected.
A subset of the database, comprising 24 out of 83 data pairs, was recorded in the OFF-before-ON mode, where the OFF region was 40 minutes ahead in Right Ascension. The average ON minus OFF pre-trials signal per pair in the OFF-before-ON data is (0.390.20) compared with (0.460.13) in the ON-before-OFF data. Again this indicates that the signal is not a sky-noise artifact.
4 Discussion
TeV J2032+4130 is located within the crowded Cygnus region of the Galactic Plane and hence it has no shortage of possible candidate identifications. The region is dominated by the very strong OB association, Cygnus OB2 and this was the first identification suggested (Aharonian et al. aharonian02 (2002)). At a distance of 1.7kpc, this implies a luminosity in the range 1032-34 erg which is a small fraction of the total energy estimated for the OB association. The apparent finite size of the TeV source would favour this identification.
An extensive study of the source region by Butt et al. (butt03 (2003)) using the Chandra and VLA telescopes was made to examine the hypothesis that the large scale shocks and turbulence induced by multiple interacting stellar winds from the young stars in the OB association might accelerate the hadronic component of the cosmic radiation and cause the emission of gamma rays. It was assumed that the TeV source was extended and steady. This work has been extended by Torres et al. (torres04 (2004)) who predict that this may be a strong source of TeV neutrinos.
An alternative approach was taken by Mukherjee et al. (mukherjee03 (2003)) who associated TeV J2032+4130 with the nearby EGRET unidentified source 3EG J2033+4118 and assumed the TeV source to be variable and point-like. They suggested an identification with the brightest X-ray source in the field which is variable and has a featureless spectrum suggestive of a BL Lac. This was suggested to be a “proton blazar” which would be notable for having little radio emission.
Other possible identifications include an unusual supernova remnant caused by a supernova some tens of thousands of years ago (Bednarek bednarek04 (2004)) and the jet from the nearby microquasar, Cygnus X-3 (Aharonian et al. aharonian02 (2002)).
The detection of a relatively weak signal at a somewhat lower peak energy and at an earlier epoch is significant in that it verifies that the source is variable and hence aids in its identification with candidate objects. The detection is not deep enough to improve the positional information or to better define the energy spectrum. Also it is not possible to determine the angular size of the source which, like the other TeV sources detected by these experiments, is consistent with a point source. However the average flux detected in 1989-1990 (12% of the Crab) is clearly well above that seen as the average flux over a four year period by the HEGRA group (3% of the Crab) in 1999-2002 and well below that seen over a six week period in 1993 by the Crimean experiment (approximately the level of the Crab). The low level of emission from TeV J2032+4130 in the current epoch is confirmed by observations at the Whipple Observatory in 2003 (Finley finley03 (2003)). Neither the Whipple nor the HEGRA experiments see any evidence for variability within their individual databases. The large differences between the flux levels cannot be explained as errors in estimation of the sensitivity of the three experiments since they have been calibrated by the simultaneous observations of other TeV sources.
The observed variability is difficult to reconcile with the HEGRA observation that the source is extended. It is unfortunate that the two early experiments did not have sufficient depth in their detections to confirm this extension. The variability seen is easier to explain in terms of a point source such as the proton blazer or the microquasar explanations. More sensitive observations by VERITAS and GLAST over the full energy range will probably be needed to unambiguously unravel the nature of the source. The correlation of time variations with observations at longer wavelengths will be particularly important.
Acknowledgements.
The contributions of M.F. Cawley, K.S. O’Flaherty and G. Vacanti to the observational programme, and to the development of the original analysis software, are gratefully acknowledged.References
- (1) Aharonian, F., et al., 2002 A&A, 393 L37
- (2) Akerlof, C.W., et al. 1991, ApJ, 377, L97
- (3) Atkins, R., et al. 2004, ApJ, to appear in June 2004, (astro_ph/0403097)
- (4) Bednarek, W., 2003, MNRAS 345, 847
- (5) Butt, Y.M., et al. 2003, ApJ, 597, 494
- (6) Cawley, M.F., et al, 1990, Experimental Astron. 1, 173
- (7) Cui, S.W., Yan, C.T., et al. 2003, Proc. 28th ICRC (Tsukuba), 4, 2315
- (8) Finley, J.P. 2003, BAAS, AAS 203rd meeting (Atlanta, 2004), 35, 1216
- (9) Fomin, V., 2004, private communication
- (10) Hartman, R.C., et al. 1999, ApJS, 123, 79
- (11) Horan, D., & Weekes, T.C. 2004, New Astron. Rev., 48, 527
- (12) Lang, M.J., et al. 1991, Proc. 22nd ICRC (Dublin), 1, 204
- (13) Lamb, R.C. &, Macomb, D. 1997, ApJ, 488, 872
- (14) Lessard, R.W., et al. 2001, Astropart. Phys. 15, 1
- (15) Li, T.P., & Ma, Y.Q. 1983, ApJ, 272, 317
- (16) Mukherjee, R., et al. 2003, ApJ, 589, 487
- (17) Neshpor, Yu. I. et al. 1995, Proc. 25th ICRC (Rome), 2, 385
- (18) O’Flaherty, K.S., et al. 1992, ApJ, 396, 674
- (19) Punch, M., et al. 1991, Proc. 22nd ICRC (Dublin), 1, 464
- (20) Reynolds, P.T., et al. 1993, ApJ, 404, 206
- (21) Rowell, G., Horns, D., et al., 2003, Proc. 28th ICRC (Tsukuba), 4, 2345
- (22) Torres, D.F., Domingo-Santamaria, E., & Romero, G.E. 2004, ApJ, 601, L75
- (23) Vacanti, G., et al. 1991, ApJ, 377, 467
- (24) Vladimirsky, B.M., Stepanian, A.A. & Fomin, V.P., 1973, Proc. 13th ICRC (Denver), 1, 456
- (25) Weekes, T.C., Helmken, H., & Horine, E. 1979, Proc 16th ICRC (Kyota) 1, 126