MMT Observations of the Black Hole Candidate XTE J1118+480 near and in Quiescence111Observations reported here were obtained at the MMT Observatory, a joint facility of the University of Arizona and the Smithsonian Institution.
Abstract
We report on the analysis of new and previously published MMT optical spectra of the black hole binary XTE J1118+480 during the decline from the 2000 outburst to true quiescence. From cross-correlation with template stars, we measure the radial velocity of the secondary to derive a new spectroscopic ephemeris. The observations acquired during approach to quiescence confirm the earlier reported modulation in the centroid of the double-peaked H emission line. Additionally, our data combined with the results presented by Zurita et al. (2002) provide support for a modulation with a periodicity in agreement with the expected precession period of the accretion disk of 52 day. Doppler images during the decline phase of the H emission line show evidence for a hotspot and emission from the gas stream: the hotspot is observed to vary its position, which may be due to the precession of the disk. The data available during quiescence show that the centroid of the H emission line is offset by about km s-1 from the systemic velocity which suggests that the disk continues to precess. A H tomogram reveals emission from near the donor star after subtraction of the ring-like contribution from the accretion disk which we attribute to chromospheric emission. No hotspot is present suggesting that accretion from the secondary has stopped (or decreased significantly) during quiescence. Finally, a comparison is made with the black hole XRN GRO J0422+32: we show that the H profile of this system also exhibits a behaviour consistent with a precessing disk.
Subject headings:
accretion, accretion disks — binaries: close — stars: individual: XTE J1118+480 — X-rays: stars1. INTRODUCTION
Low-Mass X-ray Binaries (LMXBs) are binary systems where mass from a low mass secondary (M M⊙) is accreted onto a neutron star or black hole primary via an accretion disk. A subclass of LMXBs undergo episodic outbursts, separated by periods of relative low X-ray brightness, during which the X-ray luminosity can increase as much as a factor . Known as X-ray Novae (XRNe), these LMXBs have provided us with some of the most secure dynamically confirmed stellar black holes. For a review of the observational and theoretical status of LMXBs, and in particular XRNe, see van Paradijs & McClintock (1995), Tanaka & Shibazaki (1996), van Paradijs (1998) and McClintock & Remillard (2003).
XTE J1118+480 is the first identified black hole XRN located in the Galactic halo (Wagner et al. 2001; Mirabel et al. 2001). After its discovery during a faint (39 mCrab) X-ray outburst on March 2000 (Remillard et al. 2000), its optical counterpart was quickly identified with a 12.9 magnitude emission-line object which had brightened by magnitudes from its pre-outburst value (Uemura et al. 2000a; Garcia et al. 2000). The multi-wavelength outburst spectrum of XTE J1118+480 has been intensively studied (Hynes et al. 2000; McClintock et al. 2001a; Frontera et al. 2003). In particular, thanks to the location of XTE J1118+480 close to the Lockman hole it was possible to carry out observations in the extreme UV (Hynes et al. 2000), a wavelength range inaccessible for the low galactic latitude XRNe.
Optical photometry performed during outburst revealed a periodicity of 0.17078 d (Uemura et al. 2000b) which was later shown to be the superhump period caused by the precession of an eccentric accretion disk. During the decay of the outburst, McClintock et al. (2001b) and Wagner et al. (2001) measured the radial velocity curve of the companion star yielding to a mass function of M⊙. This is beyond the maximum allowed mass for a neutron star (Rhodes & Ruffini 1974), a result which establishes the dynamical evidence for a black hole primary in XTE J1118+480. They also found that the XRN is at a distance of kpc and has a high inclination () relative to the observer. Subsequent spectroscopy has refined the classification of the secondary to a probable metal-poor K5-7 V subdwarf (McClintock et al. 2003). Additionally, the outburst UV emission line spectrum showed evidence for a nuclear-evolved donor star (Haswell et al. 2002). The mean rotational broadening of the secondary yields a mass ratio of (Orosz 2001) which implies that the 3:2 resonant radius is within the disk tidal radius (see Whitehurst & King 1991 and references therein). Near quiescence, the optical light curves displayed features characteristic of the ellipsoidal variations of the secondary star (McClintock et al. 2001b; Wagner et al. 2001). A 12 minute offset between the spectroscopic and photometric ephemerides was also observed and tentatively explained by Wagner et al. as due to an asymmetrically emitting disk component. This hypothesis was confirmed by the observations of Zurita et al. (2002) who found a superhump component with a period 0.3 per cent longer than the orbital period in their optical light curves obtained near quiescence. This superhump period implies a 52 day precession period for the accretion disk.
In a previous paper, Torres et al. (2002a) presented the results of the analysis of their multi-epoch spectroscopy following the 2000 March outburst. They reported variations in the double-peaked emission lines on a time-scale longer than the orbital period of the system. This was interpreted as evidence for the precession of an elliptical accretion disk. During the approach of the system to quiescence, Zurita et al. (2002) found asymmetries in the H line and long-term variations in the centroid of the line which could also be consistent with a precessing accretion disk. Simulations of emission lines arising from an eccentric precessing disk strongly support this interpretation (Foulkes et al. 2004).
In this paper we re-analyze previously published data and present new optical spectroscopy of XTE J1118+480 with the aim of studying and resolving the complex structure of the emission line profiles. The observations comprise data acquired at a similar time to those presented in Zurita et al. (2002) and a data set acquired days after the system entered quiescence. The paper is structured as follows: Section 2 presents the observations and the data reduction procedure. In Section 3 we determine the orbital ephemeris and in Section 4 discuss the spectrum of the donor star. Sections 5 and 6 describe the results obtained from the analysis of the Balmer emission lines. Finally, in Section 7 we discuss our results and a summary is given in Section 8.
2. OBSERVATIONS AND DATA REDUCTION
We observed XTE J1118+480 with the Blue Channel CCD spectrograph attached to the 6.5 m MMT at the F. L. Whipple Observatory. All the spectra were acquired with the Loral 30721024 CCD binned by two in the spatial direction. Other details of the observations are summarized in Table 1.
On six nights during the period 2000 December 1 to 2001 January 26 UT we used a 500 grooves mm-1 grating and a 1.25 arcsec slit width which yielded a dispersion of 1.18 Å pix-1 and a spectral resolution of 3.6 Å FWHM. On night 2001 March 26 we made use instead of a 300 grooves mm-1 grating and a 1 arcsec slit which provided a dispersion of 1.94 Å pix-1 and a resolution of 5.5 Å FWHM. The source visual brightness at the beginning of the observations was R18.2 and it continued to fade at a rate of 0.003 mag day-1 (Zurita et al., 2002). Some results obtained from the data acquired during the first two nights can be found in McClintock et al. (2001b). A final observing run took place on 2003 January 02/03 at a time when the system was in true quiescence (R=18.6). Spectra were acquired using a 832 grooves mm-1 grating and a 1.25 arcsec slit. This combination gave a dispersion of 0.72 Å pix-1 and a resolution of 2.4 Å FWHM.
The images were bias and flat-field corrected with standard iraf222iraf is distributed by the National Optical Astronomy Observatories. routines. Spectra were extracted with the iraf kpnoslit package. HeNeAr arc lamp exposures taken regularly during the observations allowed us to derive the pixel-to-wavelength calibration. This was obtained from cubic spline fits to about 30 arc lines giving a root-mean square deviation of typically Å. The wavelength scales of neighbouring arc spectra were interpolated in time and the whole process was checked and corrected by using the atmospheric O[I] 5577.34 Å sky line, which showed a rms scatter of km s-1 per night. Except on 2003 January 02/03, spectra of flux standards were acquired throughout the observations and used to correct the target spectra for the instrumental response.
3. RADIAL VELOCITY CURVE AND ORBITAL EPHEMERIS
We extracted the radial velocities by cross-correlating each target spectrum with archival spectra of six template stars with spectral types ranging through G8V-M0V and acquired using the same set-up as for the target (see McClintock et al. 2001b). Prior to the cross-correlation, the target and template spectra were resampled into a common logarithmic wavelength scale and normalized by dividing with the result of fitting a low order spline to the continuum (after masking the emission lines in the target spectra). Cross-correlation was carried out in the range and least-squares sine fits with all parameters free were performed for the radial velocity determinations. Unreliable velocities obtained from two spectra were not included in these fits. We have adopted the K0 V parameters of the radial velocity curve because it provided the lowest reduced for the fit: = 16 6 km s-1, = 709 7 km s-1, d and , with corresponding to the time of closest approach of the secondary to the observer. All quoted uncertainties are 1- and were obtained after increasing the error in the radial velocities in order to give . Figure 1 displays the phase-folded radial velocity curve. Our spectroscopic orbital period disagrees somewhat (at the 3- level) with the photometric orbital period d found by Zurita et al. (2002). Adopting the values of and the orbital period, a refined mass function of M⊙ is obtained. Finally, note that by using the above refined ephemeris the outburst Doppler maps in Torres et al. (2002a) should be rotated clockwise by , whereas for the tomograms presented in this paper the error offsets are negligible for the first two and within for the latter.
4. THE SPECTRUM OF THE DONOR STAR
Figure 2 presents the spectrum of XTE J1118+480 for 2001 January 26. It was obtained by adding the spectra with different weights to maximize the signal-to-noise ratio after Doppler-correcting them to the rest frame of the secondary. By doing this, it is possible to see the absorption features from the companion star that would otherwise be blurred by the orbital motion of the star. As in McClintock et al. (2001b) and Wagner et al. (2001), the two strongest photospheric features detected are the NaD i doublet and the discontinuity in the continuum at 5200 caused by the Mg triplet, MgH and (probably) the TiO system. Also visible are the MgH band at 4780 and the molecular bands of the TiO system situated longwards of 5840 Å. Metallic features such as the Ca i 4227, 6162, Fe i 4384 and the blend of chiefly Fe i+Ca i at 6495 are also present. The molecular bands and lines from neutral elements identified are characteristic of spectral-types K and M. The spectrum is bluer and the absorption features weaker relative to the K5/8 V template shown in the same figure. This is due to the continuum excess from the accretion disk. In this regard, the contribution of light from the donor star is at on 2000 December 29 and 2001 January 26 and on 2003 January 02/03. These estimations were obtained by performing the standard optimal subtraction technique (Marsh, Robinson & Wood 1994) with K5-M0 dwarf templates. This is comparable to values found by other authors. In particular, the relative contribution of the secondary was found to be on 2001 April (Zurita et al. 2002) and on 2002 January (McClintock et al. 2003). These two numbers along with ours from 2003 January are all consistent with a constant contribution from the secondary and indicate that XTE J1118+480 has reached true quiescence on these dates. Finally, there is no clear evidence in the night-averaged spectra for absorption from the Li i resonance line to an equivalent width (EW) upper limit of 0.12 Å (1-) relative to the observed continuum. In comparison, strong Li i has been detected unequivocally in the companions of other XRNe. The reader should refer to Martín et al. (1994, 1996) for a discussion of the possible cause of the anomalously high abundance of Li i in XRNe.
5. THE AVERAGED EMISSION LINE SPECTRUM
Apart from the late-type companion spectrum, Balmer lines up to H in pure emission are detected in our spectra. Hei and Feii emission lines which are commonly observed in XRNe and DNe in quiescence are not discernible, although it has been shown that at least Hei is present in the spectrum of XTE J1118+480 but veiled by the continuum from the companion star (McClintock et al. 2003). In order to study the Balmer line profiles, we averaged the spectra in the observer’s rest-frame for the nights when 6 or more spectra were acquired. The line profiles have a FWHM of km s-1 and appear double-peaked, a profile shape which is indicative of emission arising from an accretion disk. Table 2 presents the measured full width zero intensity (FWZI) and EWs for the lines. In Table 3 we give the position of the peaks for H obtained by fitting the averaged line profiles with a 3-Gaussian function, with one used to account for the base of the line and the other two for the narrow peaks in the line. Also their difference (peak-to-peak separation) and mean (centroid of the line) are listed. From Table 2 it is obvious that the EWs measured for H during 2003 January 02/03 are higher than during approach to quiescence. This is caused in part by the lower contribution from the accretion disk to the optical continuum during quiescence (Section 4). By looking at Table 3, there is no evidence for a change in the peak-to-peak separation during the period of our observations, having a weighted mean value of km s-1 and a rms scatter of 60 km s-1. Instead, during the approach of XTE J1118+480 to quiescence, the position of the centroid of the line with respect to the rest wavelength varies noticeably from night to night with an amplitude of 250 km s-1. The centroid also shows displacements during quiescence. Additionally, the averaged H profiles during the decline to quiescence show long-term changes in the relative intensity of the red and blue peaks, a fact previously reported by Zurita et al. (2002) and also observed during outburst (Torres et al. 2002a). During quiescence the peaks of the line are slightly asymmetric.
6. THE TIME-RESOLVED H LINE PROFILE
In order to study the orbital variations in the H emission line profile, we firstly determined the EWs for the individual spectra on those nights with good orbital phase coverage. The resultant H EWs are plotted as a function of the orbital phase in Figure 1. During 2001 January 26, the EW reaches maximum at orbital phase 0.1 and no obvious minimum is observed. During 2003 January 02/03, the H EWs display a maximum at phase 0.5. The plot also shows that the EW is significantly higher around phase 0.5 for the first night in comparison to the second night. The variations are unlikely to be caused by the ellipsoidal modulation in the continuum of the secondary star since one would expect to see two equal minima in the EWs at phases 0.25 and 0.75 corresponding to the two maxima in the ellipsoidal modulation. The variations more probably represent intrinsic changes in the H line flux with orbital phase.
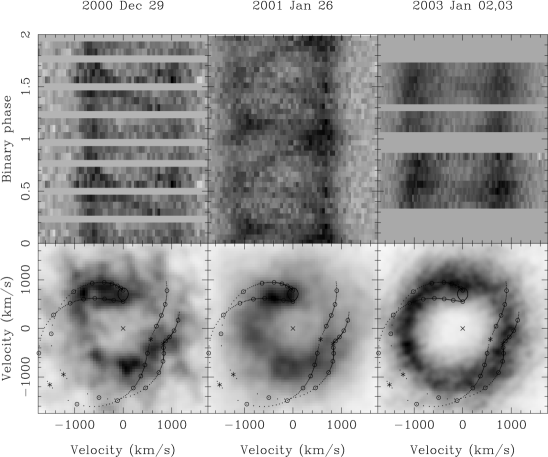
The upper panels in Figure 3 show the evolution of the H profile with orbital phase in the form of trailed spectrograms. They also illustrate the prominent long-term changes in the velocity shifts relative to the rest wavelength of the line and in the asymmetry of the peak intensities (Section 5). Looking to the panels, it is possible to trace the narrow emission components present in the double-peaked line profiles. During 2000 December 29, a sharp emission component is visible at orbital phases 0.3-0.7 which crosses from red to blue at phase . On 2001 January 26 the line profile shows an emission component in the phase interval 0.7-0.9 which crosses from blue to red at phase . During 2003 January 02/03 an emission component crosses zero velocity from red to blue at around phase 0.5. Because of the gap around phase 0.0 in the orbital phase coverage for the latter epoch, it is not possible to know if the narrow component is observable at all orbital phases.
Since the narrow components in the emission line profiles are weak and show a complex behaviour, a multi-Gaussian fit to each individual spectrum will render poor information about their origin. However, we can gain insight into the H emitting regions in XTE J1118+480 by using the Doppler tomography technique (Marsh & Horne 1988). This technique reconstructs the brightness distribution of the binary system in velocity space, allowing us to localize the emission structures which are not easily recognizable in the individual spectra. We use the maximum-entropy method (MEM) of building the tomograms on those nights with orbital phase covering at least half an orbital cycle and with good spectral resolution: 2000 December 29, 2001 January 26 and 2003 January 02/03. The bottom panels in Figure 3 display the derived MEM tomograms with the theoretical path of the gas stream and the Keplerian velocities of the disk along the stream for a radial velocity semi-amplitude of the companion star of K2=709 km s-1 (Section 3) and a mass ratio (Orosz 2001).
During the approach to quiescence, enhanced emission in the -VX, +VY (upper-left) quadrant together with the emission arising from the rotating accretion disk is easily recognizable in the Doppler images. The location of the former emission, halfway between the theoretical disk and gas stream kinematic paths, is similar to that observed in the Balmer and Heii maps during outburst (Torres et al. 2002a). However, now there is a greater overlap between this region and the theoretical trajectories. On 2000 December 29, a bright spot is present between both theoretical paths at R where R is the distance of the compact object from the inner Lagrangian point and the binary separation. The position was determined by using lines passing through points in the theoretical paths at equal distance from . On 2001 January 26 a bright spot is again present, but now it is approximately placed on the ballistic trajectory of the gas stream at R. Finally, note the enhanced emission in the +VX, -VY (right-lower) quadrant for both tomograms. Its origin will be discussed in the next section.
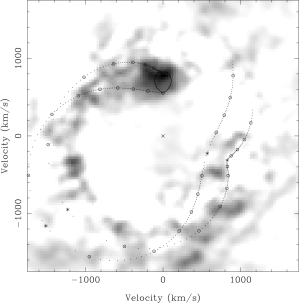
The tomogram computed during quiescence shows no clear evidence of emission from a bright spot on the ring-like distribution of the accretion disk. An emission component crossing the double-peaked profile is evident in the trailed spectra and therefore it must be reflected in the tomogram at a position defined by the amplitude and phase of its modulation. In order to find its counterpart in the tomogram, we subtracted the azimuthally symmetric part of the map. This was obtained by taking the median of the image values within annuli centered on the center of symmetry of the ring emission, which falls at km s-1 rather than . Figure 4 shows the result of the subtraction. We can see that the core of the residual emission is situated near the predicted Roche lobe of the secondary. The spread is approximately consistent with the combined effect of the finite spectral resolution (110 km s-1) and orbital phase smearing (ranging 20 to 270 km s-1).
7. DISCUSSION
From spectroscopic observations of XTE J1118+480 during its approach to quiescence, Zurita et al. (2002) found that the variability in the centroid of the nightly averaged H profile was consistent with a periodic modulation of 26 days (half of the 52 day precession period for the accretion disk implied by the superhump period), although a 52 day periodicity was not ruled out. Combining our centroid measurements obtained for H during approach to quiescence (Table 3) with those of Zurita et al., a modulation on the precession period is definitely favoured and the 26 day periodicity is ruled out (Figure 5). The centroids measured for 2003 January 02/03 (Table 3) are also displaced with respect to the systemic velocity which suggests that the accretion disk continues precessing during true quiescence. This is possible only if the outer disk radius is large enough to reach or exceed the 3:2 resonance tidal instability. By using the H mean peak-to-peak separation () and the semi-amplitude of the secondary, we estimate an outer radius of (see e.g. Dubus et al 2001). This is a value definitely larger than the 3:2 resonance radius r (Whitehurst & King 1991) and comparable to the expected disk tidal truncation radius RT/a = (Warner 1995). Additionally, the hotspot in the 2001 January 26 tomogram is located at a position consistent with the predicted outer disk radius.
Before continuing with the discussion on the Doppler maps obtained in the previous section, it is important to stress that the Doppler tomography technique assumes (in particular) that all the emitting regions co-rotate in the binary and that the flux from any of these regions is constant with time. These assumptions might not be fulfilled in a precessing eccentric disk during the course of a single orbit (Foulkes et al. 2004) and therefore the results obtained from the tomograms must be interpreted with caution. Bearing this in mind, the tomograms for 2000 December 29 and 2001 January 26 show emission from the hotspot and the gas stream illustrating that mass transfer from the donor star has continued during the approach of the system to quiescence. They also show changes in the position of the hotspot (see Section 6). It is interesting to note here that the changes observed in the position of the hotspot may be modulated with the precession period because of the varying geometry of the elliptic disk. On the other hand, the emission in the lower-right quadrant may be interpreted as arising from an overflowing gas stream which after the first impact intersects again the disk close to phase 0.5 (see e.g. Kunze, Speith & Hessman 2001) or as arising from a non-uniform brightness distribution across the disk. In the latter case, the formation of a region of enhanced density (temperature) in the disk may be caused by tidal forces from the companion star (see e.g. Steeghs & Stehle 1999). It is clear from the long-term variations in the centroid and peak intensities of the H profile that the disk in XTE J1118+480 continues to experience the tidal stresses from the companion star.
The residual H image obtained by subtracting the symmetric part from the 2003 January 02/03 Doppler image uncovers emission concentrated towards the expected position of the secondary star. H emission from the hotspot or gas stream is not detected, a fact that points to a decrease or pause in the mass transfered from the donor star to the accretion disk. A similar scenario was suggested to explain the quiescent H tomograms of Nova Muscae 1991 (Casares et al. 1997) and Centaurus X-4 (Torres et al. 2002b) which show the same pattern (secondary’s emission present/ absence of hotspot). In order to constrain the nature of the H emission from the secondary star, we isolated the narrow line component of the line profile as follows: first, an accretion disc profile was created by averaging all the target spectra in the observer’s rest frame. Next, seventeen copies of the simulated disc profile were shifted to the rest frame of the secondary star at the times of the individual target spectra and then averaged using the same weights as in the first step of the procedure. Finally, the resultant profile was subtracted from the Doppler-corrected H averaged profile of XTE J1118+480. This left us with a residual with an EW= Å which represents of the total H emission. For a R quiescent magnitude of 18.6, a distance of 1.8 kpc and assuming a secondary with a stellar radius equal to the volume radius of its Roche lobe (R, with R⊙ for M M⊙ and ), we derive from the EW of the H residual a H flux at the surface of the star (FHα) of erg cm-2 s-1.
Does X-ray irradiation power the H emission from the donor star? The intrinsic quiescent X-ray luminosity in the 0.3–7 keV band was estimated by McClintock et al. (2003) to be L erg s-1. The implied X-ray irradiation at the secondary star is then erg cm-2 s-1 which can account for the H emission if at least a of the incident X-ray flux is reprocessed to H photons. We can obtain a rough estimate of the likely fraction of the X-ray luminosity converted to H photons by assuming that the H emission line observed in X-ray bright LMXBs is due completely to X-ray reprocessing in the disk. Then:
where we have taken into account that for LMXBs the averaged optical to X-ray luminosity is L/L (van Paradijs & McClintock 1995) and the EW of the H emission line is of the order of a few Å (see e.g. Shahbaz et al. 1996; Torres et al. 2002a). Therefore we find it improbable that the X-ray irradiation could be the source of the H emission in the secondary star.
A chromospherically active secondary is an alternative explanation to the H emission. We can compare the above estimations with the results reported by Soderblom et al. (1993) for rapidly rotating dwarfs in the Pleiades. In order to compare the EW of the H residual, we have first subtracted the underlying H profile of the secondary star from the H residual by using the dwarf templates and taking into account the veiling from the accretion disc (Section 4). This operation yielded a corrected EW of 3 Å. By looking at table 6 of Soderblom et al. we find that the H emission in the companion of XTE J1118+480 is comparable in strength to that observed in some of the K dwarfs in their sample. For example, for the K7V star listed as k403, EW= Å and F erg cm-2 s-1.
7.1. Comparison of XTE J1118+480 and GRO J0422+32
Among the black hole XRNe, GRO J0422+32 (Nova Per 1992; P=5.1 hr) has the closest orbital period to XTE J1118+480 and has also exhibited superhumps during the 1992 outburst (O’Donoghue & Charles 1996 and references therein), suggesting a precessing accretion disk in the system in accordance with its low mass ratio (; Harlaftis et al. 1999). In contrast, the decay to quiescence was interrupted by two mini-outbursts in 1993 August and December. Motivated by the similarities between these systems, we have searched the literature for evidence of a precessing accretion disk from the H emission line of GRO J0422+32. We have found that asymmetries in the double-peaks of the averaged line profile have been observed (see Table 4) which we suggest are most likely due to a precessing accretion disk. Additionally, the centroid of the emission profiles should also vary if the disk is precessing. This may be reflected in the H systemic velocity of km s-1 obtained by Garcia et al. (1996), in comparison with the secondary’s systemic velocity of km s-1 (Harlaftis et al. 1999). Note that Filippenko, Matheson & Ho (1995) found a H systemic velocity of km s-1 by combining data obtained on 1994 November 8/9, 1995 January 26/27. Qualitatively, the H and Heii trailed profiles in fig. 6 of Casares et al. (1995) are red-shifted by km s-1. We suggest that these variations are also associated with a precessing disk. Future spectroscopic monitoring of XRNe in outburst and decline will enable us to confirm unambiguously the relation between the long-term variations in the line profiles and the precession of the accretion disk.
8. SUMMARY
We have presented comprehensive optical spectroscopy of the XRN XTE J1118+480 from 2000 December to 2003 January. From the analysis of the absorption line spectrum, we have established an orbital period of d and a radial velocity semi-amplitude of the secondary of = 709 7 km s-1. The implied updated mass function is M⊙. Inspection of the averaged spectrum of XTE J1118+480 in the rest frame of the secondary star exhibits numerous photospheric features typical of a secondary of spectral type K-M. Our analysis of the absorption features suggests that the system has reached true quiescence with the companion star contributing of the total flux over the range . The long-term variations in the centroid of the H profile during the decline to quiescence show a periodicity of days and an amplitude of 250 km s-1. They are interpreted as due to a precessing accretion disk. Comparison between two tomograms of the H line profile during the approach of the system to quiescence show a hotspot whose position varies. The change in the hotspot location may be related to the changes in the gas stream impact site at the edge of the disk as it precesses. During quiescence, both hotspot and gas stream are not present which points to a decrease or cessation of the mass transfer from the secondary. H emission is detected near the location of the secondary which is most probably due to chromospheric activity.
We thank Jeff McClintock who generously made available his XTE J1118+480 data. This work was supported in part by NASA Contract NAS8-39073 and LISA Grant NAG5-10889. Use of MOLLY, DOPPLER and TRAILER routines developed largely by T. R. Marsh is acknowledged. We are grateful to the anonymous referee for useful comments which improved the quality of the manuscript.
References
- Callanan et al. (1995) Callanan, P. J., et al. 1995, ApJ, 441, 786
- Casares et al. (1995) Casares, J, Charles, P. A., & Marsh, T. R. 1995, MNRAS, 277, 45
- Casares et al. (1997) Casares, J., Martín, E. L., Charles, P. A., Molaro, P., & Rebolo, R. 1997, NewA, 1, 299
- Dubus et al. (2001) Dubus, G., Kim Rita, S. J., Menou, K., Szkody, P., & Bowen, D. V. 2001, ApJ, 553, 307
- Filippenko et al. (1995) Filippenko, A. V., Matheson, T., & Ho, L. C. 1995, ApJ, 455, 614
- Foulkes et al. (2004) Foulkes, S. B., Haswell, C. A., Murray, J. R., & Rolfe, D. 2004, MNRAS, 349, 1179
- Frontera et al. (2003) Frontera, F., et al. 2003, ApJ, 592, 1110
- Garcia et al. (1996) Garcia, M. R., Callanan, P. J., McClintock, J. E., & Zhao, P. 1996, ApJ, 460, 932
- Garcia et al. (2000) Garcia, M., Brown, W. Pahre, M., McClintock, J., Callanan, P., & Garnavich, P. 2000, IAU Circ. 7392
- Harlaftis et al. (1999) Harlaftis, E. T., Collier, S., Horne, K., & Filippenko, A. V. 1999, A&Ap, 341, 491
- Haswell et al. (2002) Haswell, C. A., Hynes, R. I., King, A. R., & Schenker, K. 2002, MNRAS, 332, 928
- Hynes et al. (2000) Hynes, R. I., Mauche, C. W., Haswell, C. A., Shrader, C. R., Cui, W., & Chaty, S. 2000, ApJ, 539, 37
- Kunze et al. (2001) Kunze, S., Speith, R, & Hessman, F. V. 2001, MNRAS, 322, 499
- Marsh & Horne (1988) Marsh, T.R., & Horne, K. 1988, MNRAS, 235, 269
- Marsh, Robinson & Wood (1994) Marsh, T.R., Robinson, E. L., & Wood, J. H. 1994, MNRAS, 266, 137
- Martín et al. (1994) Martín, E. L., Rebolo, R., Casares, J., & Charles, P. A. 1994, ApJ, 435, 791
- Martín et al. (1996) Martín, E. L., Casares, J., Molaro, P., Rebolo, R., & Charles P. 1996, NewA, 1, 197
- McClintock et al. (2001a) McClintock, J. E., et al. 2001a, ApJ, 555, 477
- McClintock et al. (2001) McClintock, J. E., Garcia, M. R., Caldwell, N., Falco, E. E., Garnavich, P. M., & Zhao, P. 2001b, ApJ, 551, 147L
- McClintock et al. (2003) McClintock, J. E., Narayan, R., Garcia, M. R., Orosz, J. A., Remillard, R. A., & Murray S. S. 2003, ApJ, 593, 435
- McClintock & Remillard (2003) McClintock, J. E., & Remillard, R. A. 2003, astro-ph/0306213
- Mirabel et al. (2001) Mirabel, I. F., Dwawan, V., Mignani, R. P., Rodrigues, I., & Guglielmetti, F. 2001, Nature, 413, 139
- O’Donoghue & Charles (1996) O’Donoghue, D., & Charles, P. A. 1996, MNRAS, 282, 191
- Orosz et al. (1995) Orosz, J. A. & Bailyn C. D. 1995, ApJ, 446, L59
- Orosz (2001) Orosz, J. A. 2001, ATEL 67
- Remillard et al. (2000) Remillard, R., Morgan, E., Smith, D., & Smith, E. 2000, IAU Circ. 7389
- Rhodes & Ruffini (1974) Rhodes, C. E., & Ruffini, R. 1974, Phys. Rev. Lett., 32, 324
- Shahbaz et al. (1996) Shahbaz, T., Smale, A. P., Naylor, T., Charles, P. A., van Paradijs, J., Hassall, B. J. M., & Callanan, P. 1996, MNRAS, 282, 1437
- Soderblom et al. (1993) Soderblom, D. R., Stauffer, J. R., Hudon, J. D., & Jones, B. F. 1993, ApJS, 85, 315
- Steeghs & Stehle (1999) Steeghs, D., & Stehle, R. 1999, MNRAS, 307, 99
- Tanaka & Shibazaki (1996) Tanaka, Y., & Shibazaki, N. 1996, ARA&A, 34, 607
- Torres et al. (2002a) Torres, M. A. P., et al. 2002a, ApJ, 569, 423
- Torres et al. (2002b) Torres, M. A. P., Casares, J., Martínez-Pais, I. G., & Charles P. A. 2002b, MNRAS, 334, 233
- Uemura (2000a) Uemura, M., et al. 2000a, IAU Circ. 7418
- Uemura (2000b) Uemura, M., et al. 2000b, PASJ, 52, 15L
- van Paradijs & McClintock (1995) van Paradijs, J., & McClintock, J. E. 1995, in X-ray Binaries, ed. W. H. G. Lewin, J. van Paradijs & E. P. J. van den Heuvel. (Cambridge: Cambridge Univ. Press), 107
- van Paradijs (1998) van Paradijs, J. 1998, in The many Faces of Neutron Stars, ed. R. Buccheri, J. van Paradijs & M. A. Alpar (Dordrecht: Kluwer), 279
- Wagner et al. (2001) Wagner, R. M., Foltz, C. B., Shahbaz, T., Casares, J., Charles, P. A., Starrfield, S. G., & Hewett, P. 2001, ApJ, 556, 42
- Warner (1995) Warner, B. 1995, Cataclysmic Variables (Cambridge: Cambridge Univ. Press)
- Whitehurst & King (1991) Whitehurst, R., & King, A. J. 1991, MNRAS, 249, 25
- Zurita et al. (2002) Zurita, C., et al. 2002, MNRAS, 333, 791


| Date | No. | Exp. time | HJD start | HJD end | range |
|---|---|---|---|---|---|
| (UT) | spectra | (s) | (+2,451,000.) | (+2,451,000.) | (Å) |
| 2000 Dec 1 | 2 | 900 | 880.0097 | 880.0224 | 3650-6825 |
| 2000 ,, 4 | 6 | 900-1200 | 882.5471 | 882.9630 | 3940-7120 |
| 2000 ,, 24 | 6 | 1200 | 902.8517 | 902.9851 | 4100-7015 |
| 2000 ,, 28 | 3 | 1100-1200 | 907.0248 | 907.0543 | 4090-7005 |
| 2000 ,, 29 | 13 | 1200 | 907.8632 | 908.0551 | 4085-7000 |
| 2001 Jan 26 | 38 | 600 | 935.7534 | 936.0420 | 4075-6990 |
| 2001 Mar 26 | 2 | 1200 | 994.7991 | 994.8147 | 3715-8510 |
| 2003 Jan 02 | 8 | 900 | 1,641.9798 | 1,642.0635 | 4925-6850 |
| 2003 Jan 03 | 9 | 900 | 1,642.9625 | 1,643.0581 | 4930-6860 |
| H | H | H | H | |||||||||
|---|---|---|---|---|---|---|---|---|---|---|---|---|
| UT Date | FWZI | EW | FWZI | EW | FWZI | EW | FWZI | EW | ||||
| 2000 Dec 4 | 885 | -222 | 4610 | -82 | 785 | -135 | 705 | -1210 | ||||
| 2000 Dec 24 | 785 | -275 | 556 | -123 | 605 | -93 | — | — | ||||
| 2000 Dec 29 | 856 | -264 | 6510 | -73 | 765 | -165 | — | — | ||||
| 2001 Jan 26 | 855 | -326 | 514 | -114 | 765 | -169 | — | — | ||||
| 2003 Jan 02 | 902 | -768 | — | — | — | — | — | — | ||||
| 2003 Jan 03 | 992 | -706 | — | — | — | — | — | — | ||||
| Date | Vb | Vr | VVb | (Vb+Vr)/2 | |
|---|---|---|---|---|---|
| UT | (km s-1) | (km s-1) | (km s-1) | (km s-1) | |
| 2000 Dec 4 | -116334 | 66414 | 182737 | -250 18 | |
| 2000 Dec 24 | -64416 | 102123 | 166528 | 188 14 | |
| 2000 Dec 29 | -651 8 | 112017 | 177119 | 234 9 | |
| 2001 Jan 26 | -113412 | 6277 | 176114 | -254 7 | |
| 2003 Jan 02 | -9526 | 8118 | 176310 | -71 5 | |
| 2003 Jan 03 | -10096 | 8238 | 183210 | -93 5 |
| Night/s | Net Exposure | Stronger | Comments | refs. |
|---|---|---|---|---|
| averaged | (hr) | peak | ||
| 1993 Oct 10 | 5.3 | Blue | Decay to quiescence after August mini-outburst | 1 |
| 1993 Oct 12 | 5.3 | Blue | ||
| 1993 Dec 9 | 6 | Red | Maximum December mini-outburst | 2 |
| 1993 Dec 10 | 5 | Red | ||
| 1993 Dec 16-19 | Blue | Initial decline of mini-outburst | 3 | |
| 1994 Nov 5-7 | Blue | Quiescence | 4 | |
| 1995 Jan 26 | 4.9 | Red | Quiescence | 5 |