Galactic Distribution and the Luminosity Function of Pulsars
Abstract
We have studied the radial distribution and luminosity
function of normal pulsars in the Galaxy, on the basis of the
ATNF Pulsar Catalogue where the distances are calculated
according to the new electron density model NE2001.
We show that the maximum of galactocentric distribution of
pulsars located near 3.5 kpc and the scale-length of this distribution
is kpc. The surface density of pulsars near the Galactic
center (GC) is equal or slightly higher than that in the solar
neighborhood. The local density and birth-rate of pulsars is 1.5 and 4
times higher than previous estimates, correspondingly before and after
beaming corrections. The dependence of these results on the NE2001
model and recommendations for further improvement of the electron
density distribution are discussed.
We derived the luminosity function of pulsars at frequencies
near 1400 MHz. In the limited band of luminosities, the luminosity
function has a slope near , but a new luminosity function may be
better fitted by a Log–Normal distribution.
1 Introduction
The high-frequency, sensitive Parkes Multibeam Pulsar Survey (PMPS) (Manchester et al. 2001; Morris et al. 2002; Kramer et al. 2003) revealed many more distant pulsars with high Dispersion Measures (DM). These data may allow us to investigate in more detail the statistical parameters and distribution of pulsars, especially in the central regions of the Galaxy, which was almost impossible in previous low-frequency and less-sensitive surveys. Furthermore, high-frequency searches reveal many pulsars at the lower as well as at the high luminosity ends of the luminosity function (LF) of pulsars. From the evolutionary point of view it is of great interest for the influence of such pulsars on the shape of pulsars’ LF.
Considering the actuality of the problem and with the appearance of publications with completely wrong interpretation of observational data of pulsars (Guseinov et al. 2002a, 2002b), we decided to estimate the density of pulsars at the GC and to take a fresh look at the radial distribution and luminosity function of pulsars using these new PMPS data, with the kind permission of Prof. R.N. Manchester, from the ATNF Pulsar Catalogue of 1412 pulsars (Manchester et al. 2002). We estimated the distances to the pulsars by using the NE2001 Galactic electron density model (Cordes & Lazio 2002, CL2002 hereafter).
In the space and luminosity distribution studies, it is very important to make corrections for the observational selection effects. In this contribution we used an empirical (and simple) method for the correction of observational selection effects, as in Kodiara (1974), Yusifov (1981), Leahy & Wu (1989), Wu & Leahy (1989, WL89 hereafter), with some modifications.
2 Available Data and the Selection Effects
At the time of preparing this contribution, the number of existing pulsars was 1412. The ATNF Pulsar Catalogue contains the data of PMPS, the Swinburne survey (Edwards et al. 2001) and all previous pulsar survey results, and it supplies a good sample of data for the statistical study of pulsars. Nearly 600 of them were discovered in the Parkes and Swinburne Multibeam Pulsar Surveys (MBPS).
In this study we are interested mainly in statistics of “normal” pulsars. For this reason we excluded from our sample binary and recycled ( s/s), globular cluster and extragalactic pulsars. In our study we mainly used pulsars in the regions of the Galactic latitudes and longitudes . In this study, as in the Galactic electron distribution model NE2001, we used the IAU recommended value kpc as the distance Sun–GC.
The apparent distribution of pulsars for the subsequent corrections due to selection effects is derived in the following manner. We drew equidistant concentric circles around the Sun () and the GC () and made up a quasi-regular grid of points at the points of intersection of these circles on the Galactic plane. Then we drew circles of radius around the grid points (or cells), counted the number of pulsars within the boundaries of circle , and estimated surface densities of pulsars around grid points. increasing linearly is chosen from to of the largest considered distances from the Sun (18.7 kpc) and calculated by the relation , where varies from 1 to 12. Similar variation of cell radii naturally reduces the density estimation errors at large distances due to distance uncertainties of pulsars.
Making corrections for the selection effects, we used these data for the calculation of the radial distribution of pulsars in the Galaxy. Selection effects we divide into two categories and define them by the relation:
| (1) |
where is the Galactic longitude; and distances from the Sun and the GC; direction and distance-dependent selection factors; is the true and is the observed distribution of surface densities of pulsars on the Galactic plane.
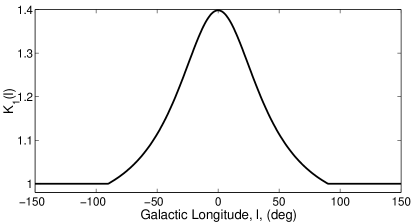
is connected with the background radiation which leads to variations of the survey sensitivity with Galactic longitudes. Neglecting latitude dependence as in WL89, the direction-dependent correcting factor is defined by the relation:
| (2) |
where is the sky background temperature at 1374 MHz and K is the noise temperature of the Parkes multibeam receiver (Manchester et al. 2001). The correction factor which was calculated from Eq. (2) is shown in Fig. 2. The observational number (or density) must be corrected for this selection effect, multiplying by . It is evident that in Eq. (1) is equal to . In the anticenter direction and in the cell where the Sun is located, is assumed to be 1.

The distance-dependent selection factor in Eq. (1) is the function of pulse broadening caused by scattering, scintillation etc. Here we make the simplifying assumption that the combined effect of these factors may be described by the exponential law as:
| (3) |
where , etc. are the distance-dependent correction factors relating to the pulse broadening, scattering and other selection effects. The quantitative estimation of each of these factors independently is difficult. But the combined effect of these factors leading to reduced detection of pulsars away from the Sun may be estimated empirically as described below.
Assuming that the surface density of pulsars is symmetric around the GC, and considering a galactocentric circle with the radius , from Eq. (1) we obtain:
| (4) |
where is the observable density; is known and is constant.
In order to derive from Eq. (4), in Fig. 2, we have plotted against the heliocentric distance by circles.
Fitting the data in Fig. 2 by the least mean-squares (LMS) method for the distance-dependent correction factor we obtain:
| (5) |
where and .
3 Radial Distribution and the Luminosity Function of Pulsars
The true densities of pulsars were found from the apparent densities, after correcting them by the relation (1). and are calculated from Eqs. (2) and (5) respectively. The radial distributions of densities from the GC may be found by averaging the densities at various distances () from the GC.
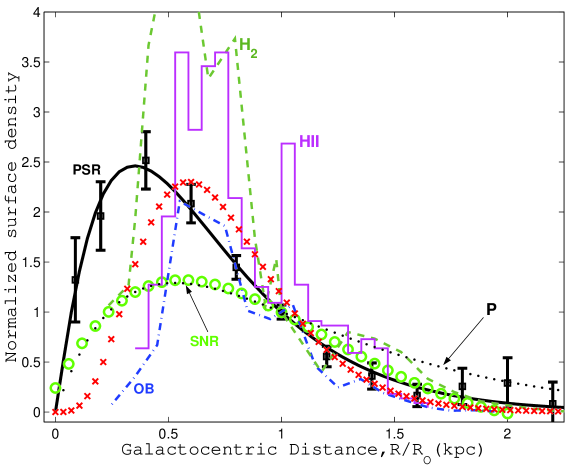
The results of obtained radial distribution of surface densities of pulsars (squares) with corresponding error bars, together with the distribution of other Population I objects, are plotted in Fig. 3. In evaluating errors, we assumed that the number of pulsars in cells, in a rough approximation, follows the Poisson statistics. The errors for various data points are not equal, so we calculated the weighted average of surface densities and corresponding errors. In order to simplify the comparison with other results, the densities in Fig. 3 are normalized to the surface densities at the solar circle.
Within the galactocentric radius 0.5 kpc pulsars are absent; and from the available data and precision of distance estimates, it is difficult to estimate the density of pulsars there. But within the range 0.5 kpc R 1 kpc there are 4 pulsars. Applying the correction factors and to the apparent density, we obtain pulsars kpc-2. In fitting the radial distributions of pulsars, just this value will be used.
The radial distribution of pulsar surface densities in Fig. 3 has been fitted by the relation:
| (6) |
where kpc is the SunGC distance. The best results of the fits are: and .
Revising Fig. 3, it is seen that high frequency, high sensitive PMPS searches revealed many pulsars around the GC, and within error limits the derived density (5016 pulsars kpc-2) is not less than that in the circumsolar region. Applying the Tauris & Manchester (1998, TM98 hereafter) beaming model, for this value we obtain (500150) pulsars kpc-2.
In Fig. 3 we compare radial distributions of pulsars and SNR with the radial distributions of their progenitors. It is seen that, although the maxima of Population I objects coincide, the maximum of pulsar distribution is shifted to the GC by nearly 1.5 kpc. The maxima of pulsar and SNR distributions nearly coincide. But the radial scale length (RSL) of pulsar distributions ( kpc) is nearly two times less than the SNR distributions.
In Fig. 3 we also plotted by dots the radial distribution of the birth location of NS which was derived by Paczynski (1990). Although the maximum of this distribution coincides with the maximum of the SNR distribution, its shape considerably deviates from the distribution of Population I objects. If the progenitors of NS are OB-type Population I stars, then from qualitative considerations of Fig. 3, it seems that the radial distribution of the birth location of NS must be located near the line shown by crosses in Fig. 3 and may be described by the relation:
| (7) |
where , and kpc is the Sun–GC distance. The constant A must be chosen from the calibration constraints (particularly, in the current case A = 1050).
In order to construct LF, we selected the sample of pulsars within a cylinder of radius 2 kpc from the Sun. For faint pulsars we applied standard volume correcting methods, and LF is calculated as
| (8) |
where is the true LF, is the apparent LF, is the volume of sphere with radius from the Sun in which pulsars with luminosities are still observable, is the volume of cylinder of radius around the Sun and is the approximate value of the maximum height of pulsars from the Galactic plane. We accept that kpc, and pulsars outside these altitudes are not more than 2–5% of observable pulsars.
The LF calculated on the basis of these data is presented in Fig. 4. The total number of observable pulsars in every luminosity bin is estimated on the basis of all available pulsars, but taking into account that high sensitive MBPS are carried out only in the region of and .
For the low-luminosity pulsars the LF is estimated from relation (8), where is assumed to be 2 kpc. There are only two pulsars with luminosities 100 mJy kpc2 in the considered region of d 2 kpc around the Sun. values for them are calculated on the basis of large-distance pulsars revealed in the MBPS, assuming that they are observable almost everywhere in the Galaxy.
In this study we applied the TM98 beaming model for the correction of LF. We estimated approximate values of the beaming fraction (BF) corresponding to each luminosity bin and show them at the top of Fig. 4 in percent. LF, corrected according to these BFs, is shown by the dashed line in Fig. 4.
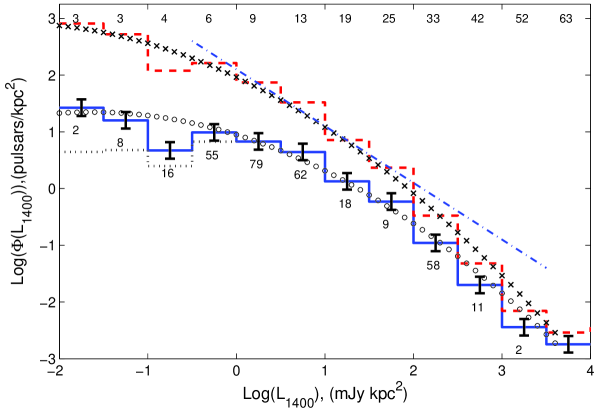
The MBPS nearly doubled the number of pulsars around 0.1 mJy kpc2, but it is not enough to describe the LF by one straight line. As is seen in Fig. 4, only the LF in limited regions of luminosities may be fitted by a straight line. A flattening of LF at low luminosities was already noted in previous studies and explained as a result of the deficit of low-luminosity stars (see Lyne et al. 1985; Guseinov & Yusifov 1986; Cordes & Chernoff 1997; Lyne et al. 1998, and references therein). We fitted the data in Fig. 4 by the Log–Normal distribution before and after beaming corrections by one analytical relation:
| (9) |
For the constants of distributions and before and after beaming corrections, we obtained values 6715; 1.210.07; 1.640.33 and 2600600; 1.240.10; 2.600.57 correspondingly.
4 Results and Discussion
We have studied the population of normal pulsars in the Galaxy, using the ATNF Pulsar Catalogue where the distances are calculated according to the new electron densities model NE2001.
We have derived the radial distribution of surface density of normal pulsars by using the new distances. The maximum of radial distribution is located at kpc and kpc nearer to the GC relative to the maximum of distributions of Population I objects. Although the maximum of the distribution nearly coincides with the maximum of distributions of their progenitors (SNRs), the RSL of pulsars is kpc, i.e. nearly two times less than the SNR distribution. Integrating the radial distribution for the total number of normal pulsars with luminosities mJy kpc2 in the Galaxy, we obtained and before and after applying beaming corrections.
The surface density of pulsars around the GC region is (5016) pulsars kpc-2 and (500150) pulsars kpc-2 before and after applying beaming corrections.
For the luminosities at 1400 MHz, the LF of pulsars is constructed on the basis of pulsars within 2 kpc from the Sun. In estimating beaming corrections we applied pulsar beaming models of TM98. The low luminosity end flattening of LF became increasingly more evident. The LF of pulsars may be better described by the Log–Normal distribution (Eq. 9). Above a luminosity value of 0.1 mJy kpc2 for the local surface density of normal pulsars we obtained pulsars kpc-2 and pulsars kpc-2 before and after beaming corrections. Assuming yr as the mean life time of active pulsars, for the corresponding birth-rate of pulsars in the solar neighborhood we obtain 4 and 52 pulsars kpc-2 Myr-1 respectively before and after beaming corrections.
We recommend a new relation (Eq. (7)) for the expected radial distribution of birth location of NSs, which is more closely related to the radial distribution of Population I objects.
The total number and frequency of generation normal pulsars obtained from these data are nearly 1.5 and 4 times higher than previous estimates, correspondingly before and after beaming corrections. One of the reasons for the higher values is possibly connected with the overestimated electron densities of the ISM. This leads to the necessity of further improvement of the Galactic electron density model, which requires measurements for distant pulsars.
One of the recent, but unsuccessful, attempts on pulsar distances and LF estimations are the publications of Guseinov et al. (2002a, 2002b). However, due to the fallacy of their method and approaches to the problem and other numerous errors, their results are not discussed here.
A more complete report on this work will be given elsewhere (Yusifov and Küçük, in preparation).
Acknowledgments
We would like to thank R.N. Manchester and the Parkes Multibeam Pulsar Survey team for making the parameters of new pulsars available on the internet prior to formal publication. We thank R. Wielebinski, J.L. Han and F.F. Özeren for reading the manuscript and for useful discussions. We thank Victor B. Cohen for help in preparing the manuscript. This work has been partially supported by Erciyes University R/D project No. 010521, Turkey. Extensive use was made of both the Los Alamos preprint archive and the ADS system.
References
Bronfman, L., Cohen, R.S., Ajvarez, H., May, J., & Taddeus, P. (1988) Astrophys. J. 324, 248.
Bronfman, L., Casassus, S., May, J., & Nyman, L.-Å (2000) Astron. Astrophys. 358, 521.
Case, J.L. & Bhattacharya, D. (1998) Astrophys. J. 504, 761.
Cordes, J.M. & Chernoff, D.F. (1997) Astrophys. J. 482, 971.
Cordes, J.M. & Lazio, T.J.W. (2002) preprint [astro-ph/0207156].
Edwards, R.T., Bailes, M., van Straten, W., & Britton, M.C. (2001) Astrophys. J. 326, 358.
Guseinov, O.H., Yazgan, E., Özkan, S., & Tagiyeva, S. (2002a) Rev. Mex. Astron. Astrof. 39, 267.
Guseinov, O.H., Yazgan, E., Özkan, S., Tagiyeva, S., & Yoldas, A.K. (2002b) preprint [astro-ph/0207306].
Guseinov, O.H. & Yusifov, I.M. (1986) Sov. Astron. 30, 47.
Kodiara, K. (1974) Publ. Astron. Soc. Japan 26, 255.
Kramer, M., Bell, J.F., Manchester, R.N., et al. (2003) Mon. Not. R. Astron. Soc. 342, 1299.
Leahy, D.A. & Wu, X. (1989) Publ. Astron. Soc. Pac. 101, 607.
Lyne, A.G., Manchester, R.N. & Taylor, J.H. (1985) Mon. Not. R. Astron. Soc. 213, 613.
Lyne, A.G. , Manchester, R.N., Lorimer, D.R., Bailes, M., D’Amico, N., Tauris, T.M., Johnston, S., Bell, J.F., & Nicastro, L. (1998) Mon. Not. R. Astron. Soc. 295, 743.
Manchester, R.N., Lyne, A.G., Camilo, F., et al. (2001) Mon. Not. R. Astron. Soc. 328, 17.
Manchester, R.N., et al. (2002) ATNF Pulsar Catalogue, http://www.atnf.csiro.au/research/pulsar/psrcat
Morris, D.J., Hobbs, G., Lyne, A.G., et al. (2002) Mon. Not. R. Astron. Soc. 335, 275.
Paczynski, B. (1990) Astrophys. J. 348, 485.
Paladini, R., Davies, R., & DeZotti, G. (2004) in From Observations to Self-Consistent Modeling of the Interstellar Medium, eds. M. Avillez & D. Breitschwerdt, Astrophys. & Space Sci., in press [astro-ph/0212341].
Tauris, T.M. & Manchester, R.N. (1998) Mon. Not. R. Astron. Soc. 298, 625.
Wouterloot, J.G.A., Brand, J., Burton, W.B. & Kwee, K.K. (1990) Astron. Astrophys. 230, 21.
Wu, X. & Leahy, D.A. (1989) Acta Ap. Sinica 9, 233.
Yusifov, I.M. (1981) Former Soviet Astr. Circ. 1164, 1.