A new determination of the extragalactic diffuse gamma-ray background
from EGRET data
Abstract
We use the GALPROP model for cosmic-ray propagation to obtain a new estimate of the Galactic component of gamma rays, and show that away from the Galactic plane it gives an accurate prediction of the observed EGRET intensities in the energy range 30 MeV – 50 GeV. On this basis we re-evaluate the extragalactic gamma-ray background. We find that for some energies previous work underestimated the Galactic contribution at high latitudes and hence overestimated the background. Our new background spectrum shows a positive curvature similar to that expected for models of the extragalactic emission based on the blazar population.
Subject headings:
diffusion — cosmic rays — ISM: general — diffuse radiation — gamma rays: observations — gamma rays: theory1. Introduction
The extragalactic diffuse -ray background emission (EGRB) is a superposition of all unresolved sources of high energy -ray emission in the Universe. Active galactic nuclei (AGN) are the dominant class of -ray emitters known to emit up to the highest energies. There is a consensus that a population of unresolved AGN may contribute to the EGRB, however predictions range from 25% up to 100%. Contributions from other extragalactic sources have been plausibly suggested: galaxy clusters (Ensslin et al., 1997), energetic particles in the shock waves associated with large scale cosmological structure formation (Loeb & Waxman, 2000; Miniati, 2002), or distant -ray burst events. Potentially, if reliably derived, the EGRB can also provide important information about the phase of baryon-antibaryon annihilation (Gao et al., 1990; Dolgov & Silk, 1993), evaporation of primordial black holes (Hawking, 1974; Maki, Mitsui, & Orito, 1996), annihilation of so-called weakly interacting massive particles (WIMPs) (Jungman, Kamionkowski, & Griest, 1996), and extragalactic IR and optical photon spectra (Stecker, 1999).
The EGRB is the component of the diffuse emission which is most difficult to determine. Its spectrum depends much on the adopted model of the Galactic background which itself is not yet firmly established. The isotropic, presumably extragalactic component of the diffuse -ray flux was first discovered by the SAS-2 satellite and confirmed by EGRET (Thompson & Fichtel, 1982; Sreekumar et al., 1998). However, it is not correct to assume that the isotropic component is wholly extragalactic since even at the Galactic poles it is comparable to the Galactic contribution from inverse Compton scattering of the Galactic plane photons and CMB (Strong, Moskalenko, & Reimer, 2000; Moskalenko & Strong, 2000). The determination of the EGRB is thus model-dependent and influenced by the adopted size of the Galactic halo, the electron spectrum there, and the spectrum of low-energy background photons which must be derived independently.
Extensive work has been done (Sreekumar et al., 1998) to derive the spectrum of the EGRB based on EGRET data. The relation of modelled Galactic diffuse emission to total measured diffuse emission was used to determine the EGRB, as the extrapolation to zero Galactic contribution. The derived spectral index appears to be close to that of -ray blazars.
Dixon et al. (1998), using an model-independent approach, also concluded that the EGRB will be affected by a significant contribution from a Galactic halo component.
In a companion paper (Strong, Moskalenko, & Reimer, 2004) we use the GALPROP code to infer a new model for Galactic diffuse continuum -rays. This model reproduces successfully diffuse -ray emission from the entire sky and gives a good linear prediction for observed vs. predicted -ray intensities. In view of the success of this model, we use it as the basis of a new determination of the EGRB using EGRET data from 30 MeV to 50 GeV. The GALPROP propagation code and previous results are described elsewhere (Moskalenko et al., 2002; Strong et al., 2004, and references therein).
2. The procedure
2.1. EGRET data
The details of the procedure of handling the EGRET data and convolution procedure are described in detail elsewhere (Strong et al., 2004); here we provide a brief summary.
We use the EGRET counts and exposure all-sky maps in Galactic coordinates with 0.5∘ binsize, as in Strong et al. (2000). The sources of the 3EG catalogue have been removed by the procedure described in Strong et al. (2000), fully consistent with the 3EG point source listings. Apart from the most intense sources, the removal of sources has little influence on the comparison with models if sufficiently large sky segments are investigated. For the spectra, the statistical errors on the EGRET data points are very small since the regions chosen have large solid angle; the systematic error dominates and we have adopted values in the range 10–30% depending on energy as shown in Table 2, cf. 15% adopted by Sreekumar et al. (1998) and Esposito et al. (1999). The predicted model skymaps are convolved with the EGRET point-spread function as described in Strong et al. (2000). Here we use additional EGRET data in the energy ranges 10–20, 20–50 and 50–120 GeV. Because the instrumental response of EGRET determined at energies above 10 GeV is less certain compared to energies below 10 GeV, it is required to account for additional systematic uncertainties. In particular the EGRET effective area can only be deduced by extrapolation from the calibrated effective area at lower energies (Thompson et al., 1993a). We accordingly adopt values of 0.9, 0.8, and 0.7 times the 4–10 GeV effective area, respectively.
2.2. Optimized model for the Galactic diffuse emission
In the companion paper (Strong et al., 2004) we compared a range of models of Galactic diffuse emission, based on our CR propagation code GALPROP, with data from the Compton Gamma Ray Observatory. There we exploit the fact that the models predict quite specific behaviour for different sky regions and this provides a critical test: the “correct” model should be consistent with the data in all directions. We show that a new model, with moderate changes of electron and nucleon spectra relative to the “conventional” model, can well reproduce the -ray data and is compatible with locally observed particle spectra considering the expected level of spatial fluctuations in the Galaxy. The -ray data comparisons were extended over the entire sky and to 100 GeV in energy. We also exploited the recent improved measurements of the local proton, Helium, as well as antiproton, and positron spectra which are used as constraints on the proton spectrum in distant regions.
To fit the Galactic diffuse emission we used 7 test regions covering the sky (for details see Strong et al., 2004). The model uses the proton (and He) spectral shape at high energies derived from the local data. The secondary antiproton and positron data tracing the proton spectrum on a large scale provide an important constraint on the intensity normalization of the average spectrum. The adopted average electron spectrum resembles the local one renormalized upwards by a factor of 4 and consistent with synchrotron index measurements. The adopted electron and nucleon spectra are compatible with the direct measurement considering fluctuations due to energy losses and the stochastic character of cosmic ray sources and propagation.
The optimized model fits the observed Galactic diffuse -ray spectra in all test regions in the energy range 30 MeV – 100 GeV. The proposed scenario implies a substantial contribution from IC at all energies, but especially below 100 MeV and above 1 GeV. Also IC dominates at latitudes at all energies. The agreement of longitude profiles with the EGRET data is generally good considering that the model does not attempt to include details of Galactic structure. The agreement of latitude profiles with EGRET is also good, in particular the reproduction of the high-latitude variation confirms the importance of the IC component which is much broader than the gas-related -decay and bremsstrahlung emission. The outer Galaxy latitude profiles are in excellent agreement with the data.
2.3. Method
Since despite its success the model is nevertheless not exact the best approach is to fit the observed intensities with a free scaling factor, so that the EGRB is determined as the intercept, thus removing any residual uncertainty in the absolute level of the Galactic components. This is the same method as in Sreekumar et al. (1998), the difference lies in the model. To reduce the effects of Galactic structure, point sources etc. the fits are made excluding the plane, using the sky region ; ideally both IC and gas-related components would be left free but they are difficult to separate statistically at high latitudes, so we make a linear fit to the total IC+-decay+bremsstrahlung, with the scaling factor and EGRB as parameters. The fit and errors are based on a simple analysis, with () bins to obtain sufficient statistics (at least 10 counts per bin were required). For comparison we also made fits to the entire sky; in this case IC and gas-related contributions are easily separated, so that fits with both components free can be made in addition to fits to the total. The fits in the two regions then give some indication of the model-dependent systematic error in our EGRB estimates.
| , | All-sky | |||
|---|---|---|---|---|
| Energy, MeV | total | Total | IC | Gas |
| 30–50 | ||||
| 50–70 | ||||
| 70–100 | ||||
| 100–150 | ||||
| 150–300 | ||||
| 300–500 | ||||
| 500–1000 | ||||
| 1000–2000 | ||||
| 2000–4000 | ||||
| 4000–10000 | ||||
| 10000–20000 | ||||
| 20000–50000 | ||||
Note. — “Total” refers to fitting sum of all model diffuse components, “IC” and “gas” refer to fits separating IC from gas-related components. Only statistical errors are given.
| , | Adopted fractional | All-sky | |||
|---|---|---|---|---|---|
| Energy, MeV | total | systematic error | Total | IC+gas | Sreekumar et al. (1998)aaValues are from their Table 1 integrated over the energy bin. The error bars include systematic errors. |
| 30–50 | 0.30 | ||||
| 50–70 | 0.15 | ||||
| 70–100 | 0.10 | ||||
| 100–150 | 0.10 | ||||
| 150–300 | 0.10 | ||||
| 300–500 | 0.10 | ||||
| 500–1000 | 0.10 | ||||
| 1000–2000 | 0.10 | ||||
| 2000–4000 | 0.10 | ||||
| 4000–10000 | 0.10 | ||||
| 10000–20000 | 0.25 | ||||
| 20000–50000 | 0.25 | ||||
| 50000–120000 | |||||
Note. — “Total” refers to fitting sum of all model diffuse components, “IC” and “gas” refer to fits separating IC from gas-related components. For our fits statistical errors are given together with adopted systematic errors on the EGRET response. Units: 10-6 cm-2 sr-1 s-1.
3. Determining the EGRB
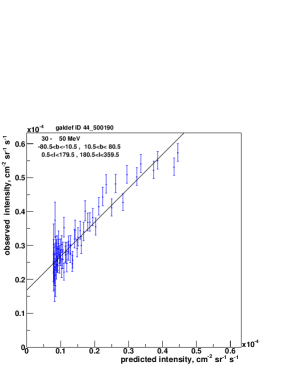
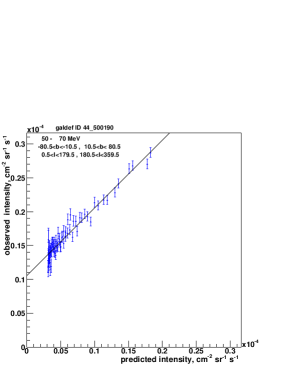
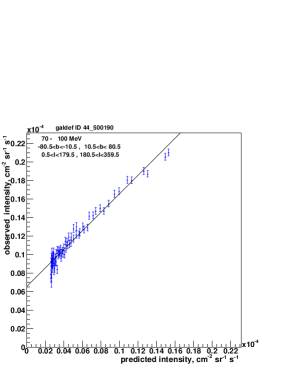
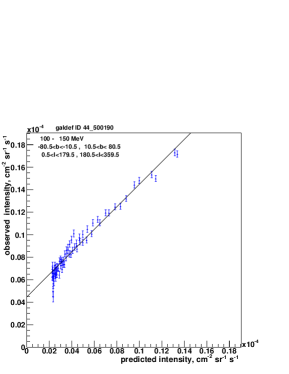
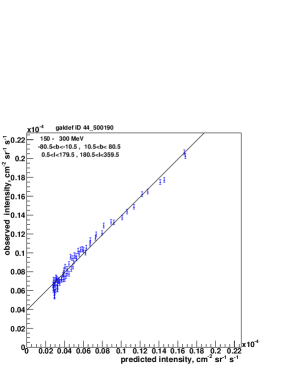
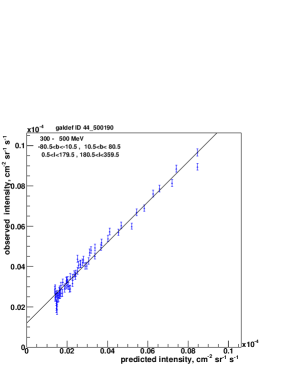
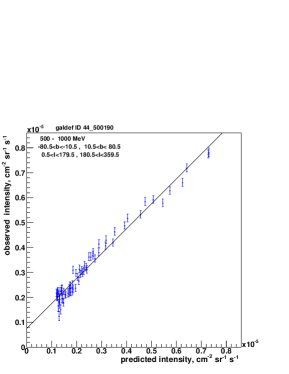
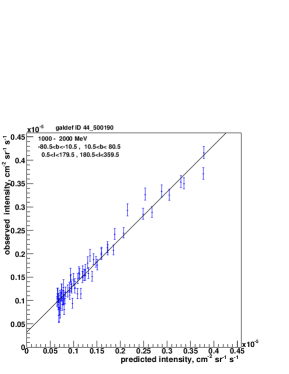
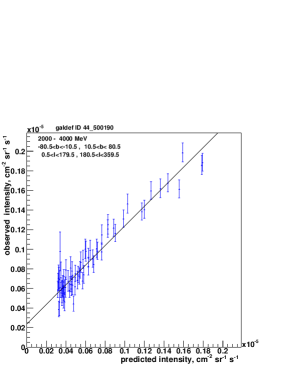
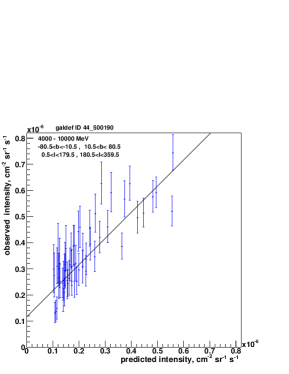
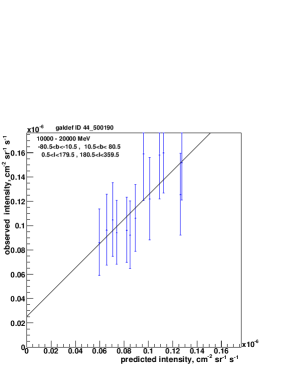
The scaling factors determined for the fits in (Table 1) reflect the deviations from the model, visible in Fig. 8 of Strong et al. (2004), and are typically between 0.85 and 1.15 which is satisfactory considering the EGRET systematic uncertainty 15% indicating a good agreement outside the plane. There is only one region (2–4 GeV) where the scaling factor is as large as 1.35. For the all-sky fits the 1–2 and 2–4 GeV factors are large in the case of the IC component, probably related to an underestimate of the ISRF or of the electron density. In the range 30–50 MeV, the gas-related factor is 1.31 which may indicate underestimated bremsstrahlung, but the EGRET data in this region are subject to a correction as a result of instrumental calibrations (Thompson et al. 1993b; see also discussion of the Kniffen factor in Section 3.1 of Strong et al. 2004) and thus more uncertain compared to other energies. These are the least reliable ranges of our EGRB determination reflecting the discrepancy in the spectrum mentioned in Section 6 of Strong et al. (2004). The EGRB is however not very sensitive to the scaling factor, since the intercept requires only a small extrapolation to zero Galactic flux. The observed versus (fitted) predicted intensities are shown in Fig. 1 (region ) using the parameters in Table 1 and Table 2. These plots give an idea of the reliability of the analysis: the relation is linear to good accuracy and the EGRB well determined.
Table 2 presents the EGRB, integrated over each energy bin since this is given directly by the fitting. The values from Sreekumar et al. (1998) (their Table 1) were thus integrated (assuming an spectrum) to compare with ours. It is seen that the two fitted regions ( and all-sky) give consistent results, indicating that there is no large systematic effect; it shows a model-dependent systematic uncertainty of 5–25%. This is comparable to the 15% systematic uncertainty on EGRET effective area. The adopted energy-dependent systematic error for EGRET data is also given in the Table. The total error is obtained by combining the statistical and EGRET systematic errors in quadrature.
Fig. 2 shows the spectrum of EGRB as derived in the present work (Table 3). The data points of the differential spectrum were obtained from Table 2 (columns 1–3 and column 4 above 10 GeV) assuming a power-law spectrum within the energy bin. The two GeV points were taken as given in “All-sky, Total” column, while the 20–50 GeV point was plotted as a upper limit. Above 50 GeV the data were insufficient to give a significant result by our method.
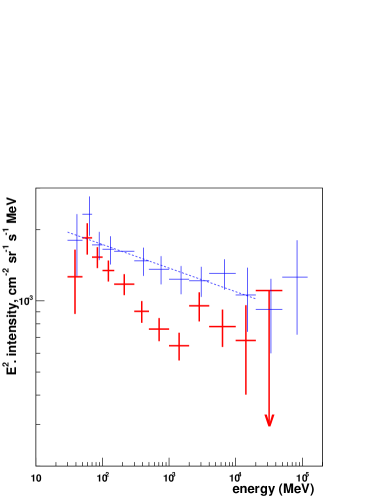
Our estimates lie significantly below those of Sreekumar et al. (1998), in most energy ranges. The positive curvature in our EGRB spectrum is interesting and not unexpected for a blazar origin (Salamon & Stecker, 1998) but in view of the systematic uncertainties should not be taken too literally; a similar, less pronounced effect is present in the Sreekumar et al. spectrum. Our spectrum is not consistent with a power law. The 0.1 – 10 GeV intensity for the region outside the Galactic plane () of cm-2 sr-1 s-1 can be compared with cm-2 sr-1 s-1 from Sreekumar et al. (1998).
4. Further checks for systematics due to model
In order to check the robustness of our EGRB estimates, we compare estimates based on data in different hemispheres and four quarter spheres (Table 4). This tests for the presence of apparent anisotropies in the EGRB values, and thus gives an independent estimate of the systematic error due to model inadequacies. In order to have sufficient statistics we consider only the integral energy range 0.1–10 GeV. The hemisphere deviations are up to 16% from the fit to the full region. The quarter sphere values deviate by up to 25% from the full region. This may reflect essentially different exposures (e.g., southern hemisphere is less exposed than northern hemisphere). The deviations are also probably indicating lack of symmetry in the observed Galactic -ray emission not reflected in the model. However, using all regions together, as we have done for our results, will tend to compensate such systematics.
| Intensity 0.1–10 GeV | Description | ||
|---|---|---|---|
| 0–360 | N+S hemispheres | ||
| 0–360 | N hemisphere | ||
| 0–360 | S hemisphere | ||
| 270–90 | Inner Galaxy N+S | ||
| 90–270 | Outer Galaxy N+S | ||
| 0–180 | Positive longitudes N+S | ||
| 180–360 | Negative longitude N+S | ||
| 270–90 | Inner Galaxy N | ||
| 270–90 | Inner Galaxy S | ||
| 90–270 | Outer Galaxy N | ||
| 90–270 | Outer Galaxy S |
Note. — Units: cm-2 sr-1 s-1. Errors are statistical only.
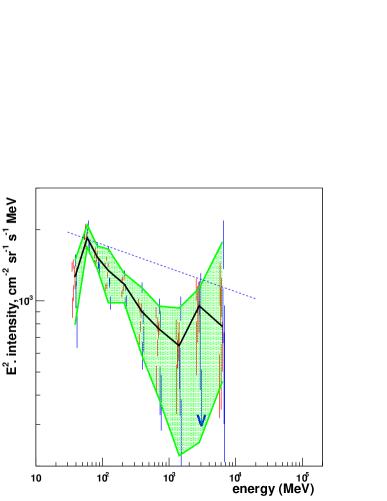
Fig. 4 shows the EGRB determined from the fits to all the regions of Table 4. The quarter-sphere spectra show more scatter than the hemisphere spectra, as expected since there are less data fitted. The extrema are plotted to give an indication of the extreme upper and lower bounds on the spectrum accounting for systematics due to the model. Compared with the adopted EGRB (also shown), the extreme upper limits lie 20-50% higher (100% for 4–10 GeV), the lower limits 10-50% lower. These extreme bounds are quite conservative; note that since this plot illustrates the model-dependent error, the additional error due to exposure uncertainty (Section 3) is not included here. The adopted spectrum using all the data is expected to be the most robust against such systematics since large-scale asymmetry effects will tend to cancel.
5. Conclusions
Based on our new optimized model for the diffuse Galactic -ray emission, a new EGRB spectrum has been derived. It is lower and steeper than found by Sreekumar et al. (1998); it is not consistent with a power-law, and shows some positive curvature as expected for an origin in blazars.
References
- Dixon et al. (1998) Dixon, D. D. et al. 1998, New A, 3, 539
- Dolgov & Silk (1993) Dolgov, A., & Silk, J. 1993, Phys. Rev. D, 47, 4244
- Ensslin et al. (1997) Ensslin, T. A., Biermann, P. L., Kronberg, P. P., & Wu, X.-P. 1997, ApJ, 477, 560
- Esposito et al. (1999) Esposito, J. A. et al. 1999, ApJS, 123, 203
- Gao et al. (1990) Gao, Y.-T., Stecker, F. W., Gleiser, M., & Cline, D. B. 1990, ApJ, 361, 37
- Hawking (1974) Hawking, S. W. 1974, Nature, 248, 30
- Jungman et al. (1996) Jungman, G., Kamionkowski, M., & Griest, K. 1996, Phys. Reports, 267, 195
- Loeb & Waxman (2000) Loeb, A., & Waxman, E. 2000, Nature, 405, 156
- Maki et al. (1996) Maki, K., Mitsui, T., & Orito, S. 1996, Phys. Rev. Lett., 76, 3474
- Miniati (2002) Miniati, F. 2002, MNRAS, 337, 199
- Moskalenko & Strong (2000) Moskalenko, I. V., & Strong, A. W. 2000, ApJ, 528, 357
- Moskalenko et al. (2002) Moskalenko, I. V., Strong, A. W., Ormes, J. F., & Potgieter, M. S. 2002, ApJ, 565, 280
- Salamon & Stecker (1998) Salamon, M. H., & Stecker, F. W. 1998, ApJ, 493, 547
- Sreekumar et al. (1998) Sreekumar, P., et. al. 1998, ApJ, 494, 523
- Stecker (1999) Stecker, F. W. 1999, Astropart. Phys., 11, 83
- Strong et al. (2000) Strong, A. W., Moskalenko, I. V., & Reimer, O. 2000, ApJ, 537, 763 (erratum 541, 1109)
- Strong et al. (2004) Strong, A. W., Moskalenko, I. V., & Reimer, O. 2004, ApJ, submitted
- Thompson & Fichtel (1982) Thompson, D. J., & Fichtel, C. E. 1982, A&A, 109, 352
- Thompson et al. (1993a) Thompson, D. J. et al. 1993a, ApJS, 86, 629
- Thompson et al. (1993b) Thompson, D. J. et al. 1993b, ApJ, 415, L13
- Weidenspointner et al. (2000) Weidenspointner, G. et al. 2000, in AIP Conf. Proc. 510, 5th Compton Symposium, eds. M. L. McConnell & J. M. Ryan (New York: AIP), 467