Short gamma-ray bursts as a possible probe of binary neutron star mergers
Abstract
We study the properties of short gamma-ray bursts (GRBs), based on the assumption that they are all connected to the binary neutron star mergers, whose formation mechanism contains a large amount of uncertainty. In particular, the merger time distribution is focused on, which is essential for short GRB rate estimate; we simply parameterize it as with lower cutoff time-scale . The short GRB rate, calculated using such a parameterization with a specific model of cosmic star formation rate, is found to be quite insensitive to the value of , but considerably sensitive to . With such formation rate models, the peak flux distribution observed by BATSE is fitted. In the fitting process, the local short GRB rate is treated as one of free parameters, giving the best fit when –2 yr-1 Gpc-3, depending on the other free parameters as well as the formation rate model represented by . We also discuss several implications for the intrinsic properties of possible sources of short GRBs, such as jet structure, intrinsic luminosity function, and intrinsic duration distribution.
1 Introduction
In recent years, our knowledge of gamma-ray bursts (GRBs) enormously improved through many observations of GRBs themselves (using gamma-rays) as well as their transient component, i.e., afterglow, which can be detected in various wavebands from radio to X-rays. Especially from the afterglow observations, their cosmological origin has been established, which revealed that GRBs are very luminous astrophysical objects whose isotropic energy emitted by gamma-rays ranges – erg. Furthermore, evidence of jetted GRBs arises from long term radio observations [1] and from observations of achromatic breaks in the afterglow light curves [2]. Using the observed break time, the jet opening angle and intrinsic gamma-ray energy were inferred [4], and the authors have concluded that the gamma-ray energies, after correcting the beaming effect, are clustered around erg. However, the remarkable progress is restricted only to the long duration class of GRBs, whose time duration exceeds 2 s, where is the interval over which 5–95% of the burst counts accumulate. On the other hand, no afterglows have been observed thus far for short duration GRBs ( s), and as its consequence, there is no direct knowledge of their redshifts and intrinsic luminosities.
Because of its energy and time scales, GRB has been considered to be connected to massive compact stars, such as supernova explosions and binary neutron star mergers. In fact, several observations indicate that long GRBs are likely associated with supernova explosions [6]; the best evidence for the connection is the spectroscopic discovery of SN 2003dh in the afterglow spectrum of GRB 030329 [10]. The absence of afterglow observation for the short GRBs, on the other hand, restricts our discussions concerning their origin. However, it is natural to interpret that the phenomenon that triggers short GRBs is different from that triggering long GRBs; this is due to clear bimodality of the distribution of accumulated in the BATSE data [12]. In the present paper, we assume that the short GRBs are associated with the binary neutron star mergers, i.e., neutron star–neutron star (NS-NS) or neutron star–black hole (NS-BH) coalescence. Numerical studies actually suggest that short duration burst can be explained by the NS-NS or NS-BH merger models [13].
Coalescence rates of binary compact object system have been estimated in two ways: (1) theoretically, based on the predictions of binary population synthesis calculations (e.g., [16, 22, 23]) or (2) empirically, based on the observed sample of galactic binary pulsars (e.g., [24]). At present, both methods appear burdened with significant uncertainties: the theoretical approach due to the many poorly constrained evolutionary model parameters and the empirical estimates due to small number sample of observed NS-NS systems. Thus, both theoretically and observationally estimated coalescence rates considerably change as a result of discovery of (theoretical) new merger formation channels or (observational) tight binary systems; in fact, there were such discoveries in both approaches. In the theoretical population synthetic approach, a new formation channel was found to be relevant in reference [30], resulting in the increase of the number of tight binary compact object systems that possibly merge in less than 1 Myr from their formation. From the observational aspect, a highly relativistic binary neutron star system has been recently discovered [31], which will merge in about 85 Myr as a result of gravitational wave emission, and the observational rate estimate increased by a factor of 6–7 compared with the previous one [32].
As we assume in the present study, if the short GRBs are truly associated with binary neutron star mergers, it is expected that the observations of short GRBs and their afterglows would provide rich information on the picture of binary systems, such as formation rate history and surrounding environment. In this paper, we investigate the formation rate history of short GRBs using the peak flux distribution obtained by the BATSE detector, particularly focusing on the merging time distribution (for an earlier approach, see reference [33]). It depends on the physical processes of the binary formation that are still quite uncertain as already discussed in the previous paragraph. Several past studies [34, 36, 40] have also used the peak flux distribution, but in order to obtain implications for cosmic star formation history or luminosity functions (LFs) of long/short GRBs. In the present paper, we rather aim at deriving physical properties of NS-NS or NS-BH mergers from the short GRB observation, assuming the connections between them and that the observationally inferred star formation rate (SFR) correctly represents nature. Although there remain huge amount of uncertainties concerning the cosmic SFR history, many observations with various wavebands seem to be roughly consistent with each other at low-redshift region after some correction law of dust extinction is applied.
Because the available data are quite restricted, owing to absence of any afterglow signals, we believe that it would be better to use simple parameterization for merger time distribution as described in section 2. It is found that the GRB rate history is quite sensitive to the merger time distribution. In section 3, we briefly model necessary properties of short GRBs such as the LF and photon spectrum. The available BATSE data as well as its efficiency are also summarized in the same section. Section 4 is devoted to showing the results of parameter fitting. The best fit values for each parameter as well as its allowed region at level are presented. Finally in section 5, we discuss the obtained properties concerning neutron star mergers as a potential source of short GRBs, by comparing our result with those obtained by other approaches such as population synthesis; we discuss the intrinsic GRB properties such as lumnosity and jet structure. In addition, the redshift distribution of BATSE short bursts is inferred using the best fit parameters, and then we derive the intrinsic duration distribution by correcting time dilation effect.
2 Formation history of short gamma-ray bursts
By recent progressive observations at various wavebands, the cosmic SFR is fairly well known, although there remains debate on especially high-redshift universe. As our reference model, we use a simple functional form for the SFR per comoving volume, which is given in reference [40] (labeled as ‘SF2’), as
| (1) |
and we adopt the standard CDM cosmology ( km s-1 Mpc-1); figure 1 shows SFR- relation with this model (solid curve).
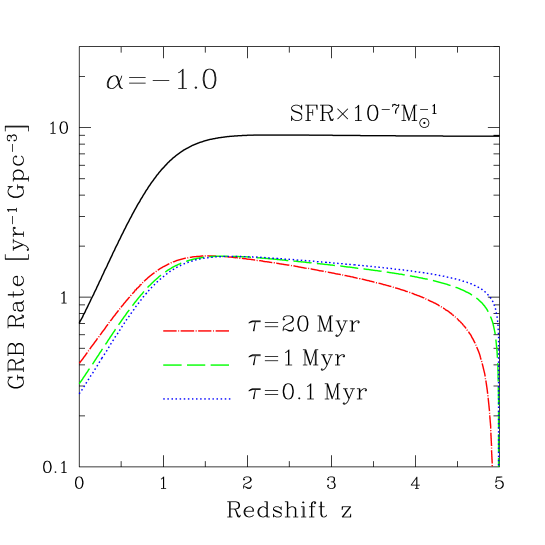
The SFR sharply increases from the current epoch to , and then it keeps the same level to farther past universe, . Behaviours at high-redshift region are quite uncertain because the galaxy LF has not been established yet there as well as the amount of dust extinction is highly ambiguous. Therefore, it may be useful to compare several SFR models which differ at high redshift from each other, as actually done in reference [40] (for long GRBs). In the present study, we further adopt two other SFR models also given in reference [40] as ‘SF1’ and ‘SF3’, and compare the results obtained by these models to that by the standard model SF2. The models SF1 and SF3 are given as a functional form by
| (2) |
| (3) |
Behaviours of these two functions are roughly the same as that of SF2 at low-redshift region , but on the other hand, they significantly differ at ; at that region, the SF1 and SF3 models give exponentially decreasing and increasing formation rate, respectively, compared with the constant behaviour of SF2. In fact, as shown in section 4, it is found that the results obtained by the SF1 and SF3 models are essentially unchanged compared with that by SF2, since the bulk data should be contributed rather low redshift region , at which three SFR models are only slightly different.
The short GRB rate, , can be calculated assuming its association with binary neutron star mergers, by using the formula
| (4) |
where represents the formation epoch of galaxies, about which we assume . is the probability distribution function of merging time of the binary system from its formation. This distribution can be calculated theoretically using population synthesis method [16, 22, 23], but resulted in various different distributions depending on studies, which means that quite large ambiguities should be accompanied. In the present paper, therefore, we take more simplified approach; i.e., a simple parameterization such as with lower cutoff time-scale is adopted. This is because we believe that this approach would be more useful to obtain some intuitive implications. We adopt as the power law index values (), and () as , where represents the lower cutoff time-scale in unit of Myr. One of the parameter sets we adopt, i.e., , was also investigated in reference [34]. As already mentioned in section 1, a new formation channel was pointed out in reference [30], with which a large amount of tight binaries, which merge within 1 Myr from their formation, possibly form. It resulted in decrease of lower cutoff time-scale ; for instance, merging time distribution calculated in reference [23] is found to peak at Myr, which is significantly shorter than the previously considered value, i.e., 10–100 Myr.
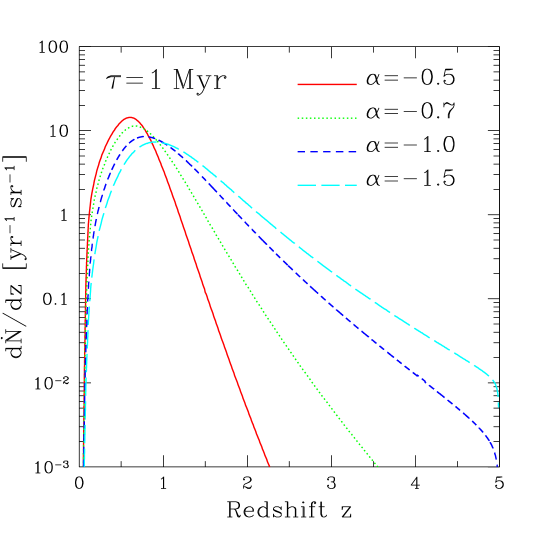
Figures 1 and 2 shows the short GRB rate density as a function of redshift due to binary neutron star mergers that is calculated with equation (4).
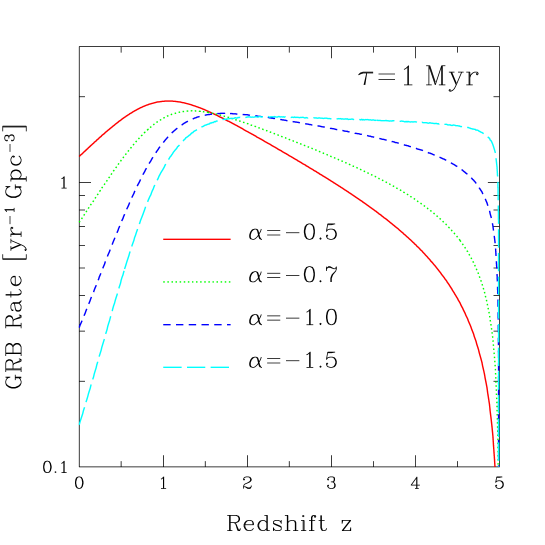
Normalization of the absolute value is obtained by the parameter fitting that is discussed in section 4. Dependence on the parameter is shown in figure 1 with . As the value of is increased, the local rate evolution to becomes shallower than that of original SFR model, from which the short GRB rate was generated via equation (4). This is because the time delay effect from the formation to coalescence is more prominent in the case of larger . On the other hand, in figure 2 we compare models with different values for power law index assuming ; the GRB rate history is found to change more dramatically depending on the value of . Using smaller , which increases the relative contribution of tight binaries to the total rate, the GRB rate becomes steeper at lower redshift; especially for , the GRB rate history becomes quite good tracer of cosmic SFR. In consequence, the short GRB rate history is quite sensitively dependent on the unknown parameters of binary neutron star systems.
3 Peak flux distribution and theoretical models
We define short GRBs as those with s, and take from the BATSE current burst catalogue.111http://cossc.gsfc.nasa.gov/batse/ The BATSE peak flux is given in three different time-scales of 64, 256 and 1024 ms. We use the 64 ms triggering timescale because the average duration of short GRBs is s, and we have to use a shorter timescale than this for the real peak flux.
The peak flux distribution can be theoretically calculated using the following formulation:
| (5) |
which is in unit of sr-1 yr-1 cm2 s. Here, is the comoving volume element per unit solid angle, is the peak LF of short GRBs, is the detector efficiency as a function of photon flux, and the factor accounts for cosmological time dilation. In our notation, the burst peak luminosity is given as a function of redshift (that corresponds to distance) as well as the observed peak flux . The comoving volume element is simply represented by the following formula with cosmological parameters:
| (6) |
where is the luminosity distance to an object at redshift . The efficiency is for 64 ms trigger timescale taken from the BATSE current burst catalogue. In the catalogue the trigger efficiency is given only above cm-2 s-1, though the data exist at lower flux range. Hence, we restrict data fitting only to this high flux region, where the trigger efficiency is given in the BATSE catalogue.
The relation between peak luminosity and observed peak flux (and also with redshift ) is obtained if we assume the differential rest-frame photon luminosity of the source (in units of s-1 keV-1). As , we use single cutoff power-law model
| (7) |
with observationally inferred value for short GRBs [41], i.e., keV. The peak photon flux observed at the Earth in the energy band and emitted by an isotropically radiating source at redshift can be written by
| (8) |
where we adopt keV and keV, which are adjusted to the energy band of the BATSE detector. On the other hand, an ‘isotropic equivalent’ burst peak luminosity is defined in the photon energy 30–2000 keV as
| (9) |
from which the relation connecting luminosity with peak flux and redshift, , can be derived, combined with equations (7) and (8).
We simply assume that the burst luminosity distribution does not evolve with redshift and adopt simple functional form for ,
| (10) |
where denotes the isotropic peak luminosity in the 30–2000 keV energy range at burst rest frame, as defined by equation (9), is the asymptotic slope at the bright end, marks a characteristic cutoff scale. We label this peak LF as single power-law (SPL) model. For comparison, we also adopt another LF whose functional form is represented by
| (15) | |||||
where we assume and . In contrast with the previous SPL-LF [equation (10)], this LF is labeled as double power-law (DPL) model. Further as two power-law indexes and , we choose two sets of their values, i.e., , and name each model as DPL1 and DPL2, respectively; this choice of the power-law index was actually adopted in the recent publication [42], which focused on the long GRBs, on the contrary to the present study. For both LFs, a proper normalization is ensured. All the information given above allows us to calculate theoretically the peak flux distribution using equation (5), and to compare it with the observational data points.
In consequence, we prepare 28 models, for which the parameter fitting is performed; each model is characterized by (1) the adopted values for merger time distribution and , (2) the adopted LFs and (3) cosmic SFRs. We summarize all the models considered from this point on in table 1, and we label each model by the model number 1–28 as shown in the table.
| Model | SFR | LF | Free parameters | ||
|---|---|---|---|---|---|
| \01 | 20 | SF2 | SPL | ||
| \02 | 20 | SF2 | SPL | ||
| \03 | 20 | SF2 | SPL | ||
| \04 | 20 | SF2 | SPL | ||
| \05 | \01 | SF2 | SPL | ||
| \06 | \01 | SF2 | SPL | ||
| \07 | \01 | SF2 | SPL | ||
| \08 | \01 | SF2 | SPL | ||
| \09 | \00.1 | SF2 | SPL | ||
| 10 | \00.1 | SF2 | SPL | ||
| 11 | \00.1 | SF2 | SPL | ||
| 12 | \00.1 | SF2 | SPL | ||
| 13 | \01 | SF2 | DPL1 | ||
| 14 | \01 | SF2 | DPL1 | ||
| 15 | \01 | SF2 | DPL1 | ||
| 16 | \01 | SF2 | DPL1 | ||
| 17 | \01 | SF2 | DPL2 | ||
| 18 | \01 | SF2 | DPL2 | ||
| 19 | \01 | SF2 | DPL2 | ||
| 20 | \01 | SF2 | DPL2 | ||
| 21 | \01 | SF1 | SPL | ||
| 22 | \01 | SF1 | SPL | ||
| 23 | \01 | SF1 | SPL | ||
| 24 | \01 | SF1 | SPL | ||
| 25 | \01 | SF3 | SPL | ||
| 26 | \01 | SF3 | SPL | ||
| 27 | \01 | SF3 | SPL | ||
| 28 | \01 | SF3 | SPL |
4 Results of parameter fitting
For each model given in table 1 we set the best fit value of several free parameters, i.e., in the case of SPL-LF and in the case of DPL-LF, where represents the local () short GRB rate. Observational data selected as short GRBs using the criterion s are converted into rates per unit time per unit solid angle by considering the effective coverage of . We show in figure 3 the peak flux rate distribution with the best fit theoretical models calculated by equation (5).
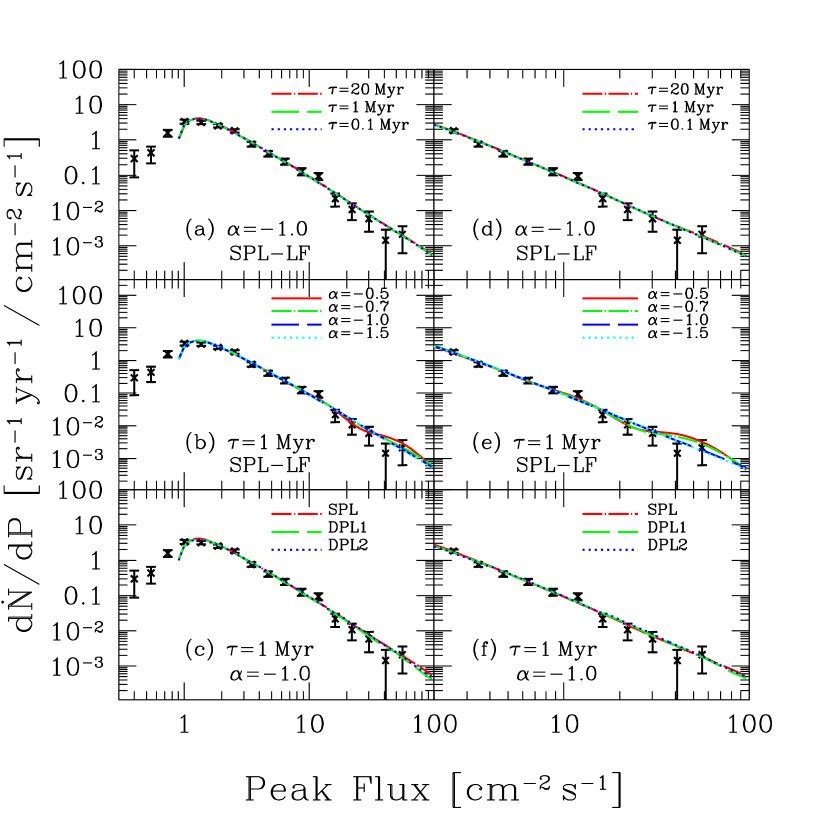
For figures 3(a)–(c), data points were used for fitting when their flux is larger than cm-2 s-1, above which the trigger efficiency is given in the BATSE current catalogue; there, 15 data points exist and thus it results in degree of freedom () of 12 and 13, in the case of SPL-LF and DPL-LF, respectively.
Figure 3(a) shows the result of parameter fitting for the models 3, 7 and 11; i.e., we investigated the dependence on the lower cutoff time-scale by fixing to be . The dependence on the power-law index of merger time distribution , on the other hand, is shown in figure 3(b) with fixed value of , i.e., comparison among models 5–8. The best-fit values to three free parameters, and , as well as their allowed ranges at 68% confidence level are summarized in table 2, for models 1–12.
| Model | (yr-1 Gpc-3) | ( erg s-1) | g.o.f. | ||||
|---|---|---|---|---|---|---|---|
| \01 | 20 | 16.8/12 | 0.16 | ||||
| \02 | 20 | 17.1/12 | 0.15 | ||||
| \03 | 20 | 17.2/12 | 0.14 | ||||
| \04 | 20 | 17.3/12 | 0.14 | ||||
| \05 | \01 | 16.8/12 | 0.16 | ||||
| \06 | \01 | 17.1/12 | 0.14 | ||||
| \07 | \01 | 17.3/12 | 0.14 | ||||
| \08 | \01 | 17.3/12 | 0.14 | ||||
| \09 | \00.1 | 16.8/12 | 0.16 | ||||
| 10 | \00.1 | 17.1/12 | 0.14 | ||||
| 11 | \00.1 | 17.3/12 | 0.14 | ||||
| 12 | \00.1 | 17.3/12 | 0.14 |
In the same table, we also show the values of as well as a goodness of fit (g.o.f.) in the last two columns. The value of is not sufficiently small compared to the degree of freedom, but the fit is still acceptable. As clearly seen from table 2, the dependence on the lower cutoff time is very weak, while the values of the best-fit parameters are rather sensitve to the power-law index . These characteristics obviously reflects the strong (weak) dependence of the short GRB rate on (), which is already discussed in section 2 and shown in figures 1 and 2. Table 2 suggests that at present, with any models we can obtain reasonable fit to the data; no models are highly favoured or disfavoured compared to the others.
Several implications for the burst parameters, i.e., and , are also obtained by the fit. The local short GRB rate is found to be 0.13–1.3 yr-1 Gpc-3, which is comparable to or in most cases larger than the local long GRB rate inferred by the analysis in reference [40], i.e., 0.12 yr-1 Gpc-3, by some factor to one order of magnitude. Although only 1/3 fraction of total number of detected GRBs is short type, the current estimated formation rate of short GRBs dominates over that of long GRBs. The remaining parameters related to the LF can compensate this apparent conflict. The best fit values for such parameters are , and (2.1–4.6) erg s-1 for . According to reference [40], on the other hand for long GRBs, the best fit values for these parameters are erg s-1 and , with which the luminosity distribution of long GRBs is expected to be brighter and flatter (owing to larger and ) than that of short GRBs. Thus, smaller values for and , obtained for short GRBs, are expected to push more GRBs below the detection threshold, reducing the total number of detected GRB rate. Therefore, the resulting number of short GRBs is smaller than that of long ones, although the local rate itself is dominated by the short population.
| Model | LF | (yr-1 Gpc-3) | ( erg s-1) | g.o.f. | ||
|---|---|---|---|---|---|---|
| 13 | DPL1 | 18.3/13 | 0.15 | |||
| 14 | DPL1 | 16.4/13 | 0.23 | |||
| 15 | DPL1 | 16.5/13 | 0.22 | |||
| 16 | DPL1 | 17.4/13 | 0.18 | |||
| 17 | DPL2 | 16.2/13 | 0.24 | |||
| 18 | DPL2 | 14.8/13 | 0.32 | |||
| 19 | DPL2 | 16.4/13 | 0.23 | |||
| 20 | DPL2 | 15.5/13 | 0.28 |
| Model | SFR | (yr-1 Gpc-3) | ( erg s-1) | g.o.f. | |||
|---|---|---|---|---|---|---|---|
| 21 | SF1 | 17.0/12 | 0.16 | ||||
| 22 | SF1 | 17.3/12 | 0.14 | ||||
| 23 | SF1 | 17.4/12 | 0.13 | ||||
| 24 | SF1 | 17.4/12 | 0.13 | ||||
| 25 | SF3 | 16.7/12 | 0.16 | ||||
| 26 | SF3 | 17.0/12 | 0.15 | ||||
| 27 | SF3 | 17.2/12 | 0.14 | ||||
| 28 | SF3 | 17.3/12 | 0.14 |
The best-fit flux distribution for the DPL-LF models (model 15 and 19) are compared with that for the SPL-LF model 7 in figure 3(c). In the case of the DPL-LF models, the quality of the fit becomes slightly better, but not to the extent that we can conclude that the short GRB data strongly favours DPL luminosity distribution. The adopted SFR does not give any significant difference from one another; this clearly indicates that at present the local contribution from SFRs dominates the bulk of data. Because many observations with various wavebands give roughly consistent results with the SF1, SF2 and SF3 models at low-redshift region, i.e., the SFR increases from the current epoch at least to , we believe that the uncertainties concerning the adopted SFR are small at low redshift and therefore giving no significant ambiguity to the parameter values as found from the comparison between tables 2 and 4.
Until this point, we used all the available data given in the BATSE current burst catalogue. However, it should be noted that because the trigger efficiency used in the present paper does not include the correction concerning the effects of atmospheric scattering. As the result, the efficiencies at low fluxes are underestimated as also mentioned in the BATSE catalogue itself, although we do not know whether our calculations given above are affected by such an effect. In order to investigate that point, we repeated the same procedure given above, but with restricting the fit to the 12 data points from the high values of peak flux (compared with the 15 data points previously adopted), and its result is summarized in figures 3(d)–(f), tables 5 and 6.
| Model | (yr-1 Gpc-3) | ( erg s-1) | g.o.f. | ||||
|---|---|---|---|---|---|---|---|
| \01 | 20 | 8.9/9 | 0.44 | ||||
| \02 | 20 | 8.5/9 | 0.49 | ||||
| \03 | 20 | 8.9/9 | 0.45 | ||||
| \04 | 20 | 9.0/9 | 0.44 | ||||
| \05 | \01 | 8.9/9 | 0.45 | ||||
| \06 | \01 | 8.4/9 | 0.49 | ||||
| \07 | \01 | 9.0/9 | 0.44 | ||||
| \08 | \01 | 9.0/9 | 0.43 | ||||
| \09 | \00.1 | 8.9/9 | 0.45 | ||||
| 10 | \00.1 | 8.5/9 | 0.49 | ||||
| 11 | \00.1 | 9.0/9 | 0.43 | ||||
| 12 | \00.1 | 9.0/9 | 0.43 |
| Model | LF | (yr-1 Gpc-3) | ( erg s-1) | g.o.f. | ||
|---|---|---|---|---|---|---|
| 13 | DPL1 | 10.9/10 | 0.37 | |||
| 14 | DPL1 | \08.9/10 | 0.54 | |||
| 15 | DPL1 | \08.7/10 | 0.56 | |||
| 16 | DPL1 | \08.9/10 | 0.54 | |||
| 17 | DPL2 | \09.8/10 | 0.46 | |||
| 18 | DPL2 | \08.3/10 | 0.60 | |||
| 19 | DPL2 | \09.6/10 | 0.48 | |||
| 20 | DPL2 | \08.6/10 | 0.57 |
This time, the degree of freedom is reduced to 9 for SPL-LF and 10 for DPL-LFs. It is noticeable that the quality of the fit becomes considerably better for both SPL and DPL models. We believe that this fact suggests that the fitting improvement is not due to the wrong modeling (at least of LFs) but rather due to exclusion of lower-flux data points, which may be affected by the atmospheric scatterings. Although the values of the best-fit parameters are quite consistent with the previously obtained values in tables 2 and 3, the accompanying errors become significantly large. Further, every model gives reasonable fit at almost the same level; no models can be excluded or restricted by the present analysis.
5 Discussion
5.1 Implications for jet structure and intrinsic luminosity
It is of interest to compare these properties with those inferred from other theoretical/observational approaches. The local merger rate of binary NS-NS or NS-BH sysyem calculated by population synthesis code ranges by many orders of magnitude. For instance according to reference [22], it ranges 0.01–80 Myr-1 galaxy-1 depending on the various parameters, with 1 Myr-1 galaxy-1 in the case of standard choice of parameter set. On the other hand, more recent study [23] claims that larger number of NS-NS merger can be created; the coalescence rate ranges 1–300 Myr-1 galaxy-1 with standard value of 50 Myr-1 galaxy-1.
In this section, we compare these merger rates obtained from their standard models, i.e., 1 Myr-1 galaxy-1 [22] or 50 Myr-1 galaxy-1 [23] with our inference of using short GRB observations. We simply convert the rate per galaxy into that per volume assuming that the number density of galaxies is Mpc-3. Using this conversion factor, the rate 1 (50) Myr-1 galaxy-1 corresponds to 10 (500) yr-1 Gpc-3, with which the values we have obtained in the previous section should be compared. From tables 2–6, we take yr-1 Gpc-3 as our reference value, which is significantly smaller than those derived from the population synthesis approach; our evaluated value is 0.05 and of the local merger rate from references [22] and [23], respectively. However, this disagreement may be a natural consequence of the jet structure of GRBs or of the fact that not every merger produces GRBs. Assuming that all the binary mergers containing at least one neutron star certainly produce short GRBs, we can suggest the beaming angle of the jet using the rate difference obtained above. Considering that the fraction of apparent GRB rate is only of the intrinsic GRB rate (coalescence rate), the derived values for the jet opening angle are 18∘ and 2.6∘, which are derived from the ratio of obtained from our approach to that from the local coalescence rate taken from references [22] and [23], respectively. These inferences of the jet opening angles are quite well consistent with those for long GRBs determined by the achromatic break of the afterglow light curves [4]. The intrinsic values corresponding to the luminosities, and , are suggested to be also smaller than the values summarized in tables 2–6 by a factor of or , depending on whether the opening angle is 18∘ or 2.6∘. We summarize these particulars in table 7, but in which the specific model 7, i.e., , SF2 and SPL-LF, is used for the evaluation with the values given in table 2.
| Merger rate | Jet angle | |||
|---|---|---|---|---|
| Method | Reference | (Myr-1 Gal-1) | ( erg s-1) | |
| Population synthesis | Fryer et al[22] | \0\01.2 | 13 | 5.7 |
| Belczynski et al[23] | \052.7 | \02.0 | 0.13 | |
| Observation | Kalogera et al[32] | 180 | \01.1 | 0.038 |
In the same table, we also show the values obtained by comparing our with the observationally inferred local coalescence rate, which was recently found to be rather large as Myr-1 galaxy-1, although the estimate contains a fair amount of uncertainty [32]. In this case, the obtained jet angle is a little bit small but is still marginally consistent with that of long GRBs observed by the achromatic break of afterglow light curves. In consequence, although there is no direct evidence supporting the connection between short GRBs and binary neutron star mergers, we can explain observed data quite naturally with such a connection as well as jet-like nature of short GRBs.
In the above discussion, we have assumed that the jet structure is uniform in the opening angle, i.e., the kinetic energy does not depend on the solid angle. On the other hand, several models that assume structured jet, i.e., the kinetic energy depends on the solid angle, are proposed (e.g., see references [43, 44]), and whether the jet is uniform or structured is matter of controversy [42, 45]. At the end of this subsection, therefore, we consider the possible case of structured jet model; we adopt the power-law distribution of kinetic energy per unit solid angle, i.e., and as the canonical value [43]. A remarkable property of the structured jet model is that the isotropic LF is determined to be , because the apparent luminosity depends on the direction alone [43, 44]. In our calculation, this corresponds to the case of SPL-LF model summarized in table 2. From the table, the canonical value of , expected from the structured jet model with , is not favoured, while the statistical significance is not large. Steeper jet structure (due to larger ) gives flatter LF (larger ) and it is further more disfavoured. In addition, our results are also against the quasi-universal Gaussian jet structured model, which predicts even if some dispersion of parameter values is allowed [44, 47].
5.2 Inferred redshift distribution and intrinsic burst duration
Although we do not have any redshift information for short GRBs, we can infer their redshift distribution detected by BATSE, by using the formulation,
| (16) |
Figures 4 and 5 show the redshift distribution calculated using equation (16) with the GRB formation rate shown in figures 1 and 2.
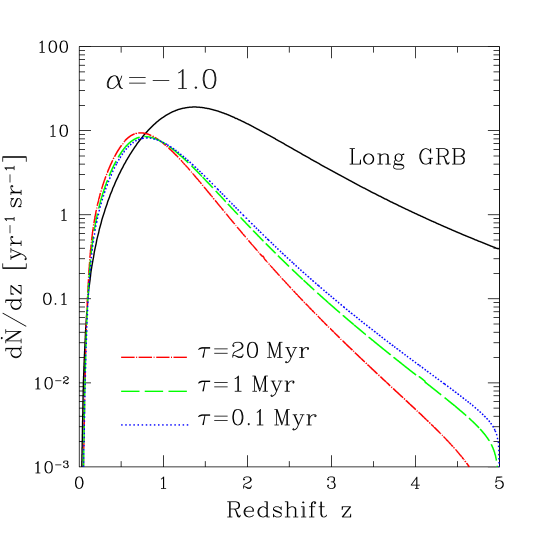
In figure 4, we also show the expected redshift distribution of long GRBs detected by BATSE using the best fit parameters taken from reference [40], for comparison. From the figure, the short GRBs are considered to be more localized relative to the long ones, but its degree is relaxed when the slope of the merger time distribution becomes steeper (for smaller ). These redshift distributions would be another probe of its origin if the accompanied afterglow data were accumulated.
Although we classified the bursts with s as short GRBs, the observed duration is affected by cosmological time dilation. In order to obtain intrinsic duration distribution for short GRBs, we use an assumption that it obeys log-normal distribution as well as the redshift distribution of the short GRBs already obtained via equation (16). The rate of detected bursts per unit redshift range per unit intrinsic duration is obtained by
| (17) |
where represents the probability distribution function of intrinsic duration, which we assume log-normal type; has already been obtained in the previous paragraph. This relation can be rewritten as a function of observed duration and redshift , and then be integrated over redshift as:
| (18) | |||||
with which we can obtain the values for central duration as well as the standard deviation of the log-normal distribution , by fitting the observed duration distribution by BATSE. As the result we found that –0.31 s and –0.55, depending on the adopted parameters of .
6 Conclusions
Recent progresses concerning GRBs such as evidence for collimated jet structure or association with supernova explosions are all restricted to long duration GRBs with s. For the short GRBs, on the other hand, because of the lack of any afterglow information, we only poorly understand them. However, a clear bimodal duration distribution and several numerical simulations suggest that the origin of short GRBs is different from that of long ones, and the binary neutron star merger event remains as a viable candidate.
Based on the assumption that all the short GRBs with s are connected to the binary neutron star mergers, we analyzed the current available data taken from the BATSE catalogue. In the analyses, we parameterized the merger time distribution, which is essential for short GRB rate estimate, as with lower cutoff time-scale . The short GRB rate, calculated using such a parameterization with equation (4) and generated from the model for cosmic star formation rate SF2 in reference [40], was found to be quite insensitive to the value of , but significantly sensitive to , as shown in figures 1 and 2. With such formation rate models, the peak flux distribution observed by BATSE was fitted. We further adopted two different functional form for isotropic luminosity distribution, i.e., SPL and DPL. In the fitting process, we used several free parameters, () in the case of SPL-LF (DPL-LF) model, where represents the local short GRB rate density and the others are the parameters related to the LFs. The result of parameter fitting is summarized in figures 3 as well as tables 2–4. We found that every model gives acceptable fit with reasonable parameter values, and that they are essentially insensitive to the adopted SFR models (SF1–SF3) because the bulk of the data points are expected to be attributed to local redshift region . The resulting values for the local GRB rate are found to be 0.1–2 yr-1 Gpc-3. Furthermore, the quality of the fit considerably improves when we omit several data points at low peak flux as shown in tables 5 and 6. This may be attributed to the fact that the BATSE triggering efficiency is underestimated at such a region, because it does not contain the correction to the atmospheric scatterings.
We also discussed several implications for the intrinsic properties of possible sources of short GRBs. (1) By comparing with the galactic coalescence rate of binary NS-NS systems obtained by theoretical population synthesis or observations of binary neutron star systems, and also by assuming that all such mergers certainly produce short GRBs, we constrained the jet structure as well as the intrinsic luminosity function. The obtained values for a specific model is summarized in table 7. (2) The structured jet model, where the kinetic energy depends on the direction, e.g., , was also considered; a remarkable characteristic of this model is that the isotropic LF becomes SPL function . According to our analyses, the model with is disfavoured although the statistical significance is still small. (3) Although the redshift distribution of short GRBs is not known yet since there is no discovery of afterglow signals, we can infer it using equation (16) and best fit parameters, as shown in figures 4 and 5. With this distribution and the observed duration distribution of short GRBs, we derived the parameters for intrinsic duration distribution which we assumed to have a log-normal property, by correcting the effect of cosmological time dilation.
References
References
- [1] Waxman E, Kulkarni S R and Frail D A 1998 Astrophys. J. 497 288
- [2] Rhoads J E 1997 Astrophys. J. 487 L1
- [3] [] Sari R, Piran T and Halpern J P 1999 Astrophys. J. 519 L17
- [4] Frail D A et al2001 Astrophys. J. 562 L55
- [5] [] Bloom J, Frail D A and Kulkarni S R 2003 Astrophys. J. 594 674
- [6] Galama T J et al1998 Astrophys. J. 497 L13
- [7] [] Bloom J S et al1999 Nature 401 453
- [8] [] Garnavich P M et al2003 Astrophys. J. 582 924
- [9] [] Bloom J S et al2002 Astrophys. J. 572 L45
- [10] Stanek K Z et al2003 Astrophys. J. 591 L17
- [11] [] Hjorth J et al2003 Nature 423 847
- [12] Kouveliotou C, Meegan C A, Fishman G J, Bhat N P, Briggs M S, Koshut T M, Paciesas W S and Pendleton G N 1993 Astrophys. J. 413 L101
- [13] Popham R, Woosley S E and Fryer C L 1999 Astrophys. J. 518 356
- [14] [] Ruffert M and Janka H T 1999 Astron. Astrophys. 344 572
- [15] [] Mészáros P and Rees M J 1997 Astrophys. J. 476 232
- [16] Lipunov V M, Postnov K A, Prokhorov M E, Panchenko I E and Jørgensen H E 1995 Astrophys. J 454 593
- [17] [] Bethe H and Brown G E 1998 Astrophys. J. 506 780
- [18] [] Zwart S F P and Yungelson L R 1998 Astron. Astrophys. 332 173
- [19] [] Bloom J S, Sigurdsson S and Pols O R 1999 Mon. Not. R. Astron. Soc. 305 763
- [20] [] Belczynski K and Bulik T 1999 Astron. Astrophys. 346 91
- [21] [] Voss R and Tauris T M 2003 Mon. Not. R. Astron. Soc. 342 1169
- [22] Fryer C L, Woosley S E and Hartmann D H 1999 Astrophys. J. 526 152
- [23] Belczynski K, Kalogera V and Bulik T 2002 Astrophys. J. 572 407
- [24] Narayan R, Piran T and Shemi A 1991 Astrophys. J. 379 L17
- [25] [] Phinney E S 1991 Astrophys. J. 380 L17
- [26] [] Curran S J and Lorimer D R 1995 Mon. Not. R. Astron. Soc. 276 347
- [27] [] Arzoumanian Z, Cordes J M and Wasserman I 1998 Astrophys. J. 520 696
- [28] [] Kalogera V, Narayan R, Spergel D N and Taylor J H 2001 Astrophys. J. 556 340
- [29] [] Kim C, Kalogera V and Lorimer D R 2003 Astrophys. J. 584 985
- [30] Belczynski K, Bulik T and Kalogera V 2002 Astrophys. J. 571 L147
- [31] Burgay M et al2003 Nature 426 531
- [32] Kalogera V et al2004 Astrophys. J. 601 L179
- [33] Piran T 1992 Astrophys. J. 389 L45
- [34] Totani T 1997 Astrophys. J. 486 L71
- [35] [] Totani T 1999 Astrophys. J. 511 41
- [36] Wijers R A M J, Bloom J S, Bagla J S and Natarajan P 1998 Mon. Not. R. Astron. Soc. 294 L13
- [37] [] Schmidt M 1999 Astrophys. J. 523 L117
- [38] [] Schmidt M 2001 Astrophys. J. 552 36
- [39] [] Schmidt M 2001 Astrophys. J. 559 L79
- [40] Porciani C and Madau P 2001 Astrophys. J. 548 522
- [41] Ghirlanda G, Ghisellini G and Celotti A 2003 Preprint astro-ph/0310861
- [42] Guetta D, Piran T and Waxman E 2003 Preprint astro-ph/0311488
- [43] Rossi E, Lazzati D and Rees M. J. 2002 Mon. Not. R. Astron. Soc. 332 945
- [44] Zhang B and Mészáros P 2002 Astrophys. J. 571 876
- [45] Perna R, Sari R and Frail D 2003 Astrophys. J. 594 379
- [46] [] Firmani C, Avila-Reese V, Ghisellini G and Tutukov A V 2004 Preprint astro-ph/0401580
- [47] Lloyd-Ronning N M, Dai X and Zhang B 2004 Astrophys. J. 601 371