The continued spectral evolution of the neutron star RX J0720.4-3125
Abstract
We observed the isolated neutron star RX J0720.4-3125 with Chandra’s Low Energy Transmission Grating Spectrometer, following the XMM-Newton discovery of long term spectral evolution of this source. The new observation shows that the spectrum of RX J0720.4-3125 has continued to change in the course of 5 months. It has remained hard, similar to the last XMM-Newton observation, but the strong depression observed with XMM-Newton at long wavelengths has disappeared. Contrary to the XMM-Newton observations, the new Chandra observation shows that the flux increase at short wavelengths and the decrease at long wavelengths do not necessarily occur simultaneously.
1 Introduction
RX J0720.4-3125 (Haberl et al., 1997), is one of the best studied isolated neutron stars whose X-ray emission is dominated by radiation from the hot neutron star surface. Their X-ray spectra are best described by blackbody emission with eV, but the emitting areas seem to be significantly smaller than the canonical neutron star surface. This suggests that the X-ray emission is coming from a small, hot, fraction of the neutron star (Motch et al., 2003; Kaplan et al., 2003), or may not be pure blackbody radiation, but instead the result of emission from a reflective condensed matter surface (Lenzen & Truemper, 1978; Turolla et al., 2004). Recently it was observed that the isolated neutron stars RX J1308.6+2127 and RX J1605.3+3249 exhibit broad absorption features that may be caused by proton cyclotron absorption (Haberl et al., 2003; van Kerkwijk et al., 2004).
The spectral behavior of RX J0720.4-3125 is even more surprising. Early observations with Chandra (Kaplan et al., 2003) and XMM-Newton (Paerels et al., 2001) are consistent with a blackbody-like spectrum, but subsequent observations by XMM-Newton indicate a slow evolution of the spectrum between 10-38 Å, resulting in deviations from a Planckian spectrum. The deviations consist of a flux decrease at wavelengths longer than Å, and a flux increase at shorter wavelengths (de Vries et al., 2004). The nature of the emerging spectrum is not clear (modified blackbody, cyclotron absorption in combination with a hotter blackbody?), nor is it clear what causes the emission properties to change. In de Vries et al. (2004) we suggested that RX J0720.4-3125 is precessing, which causes us to observe the hot region of the star under a continuously different angle. This requires that the surface emission is anisotropic, and may alter as result of traversing a magnetized atmosphere (Ho & Lai, 2004).
Whatever the underlying mechanism, it is clear that the spectral evolution of RX J0720.4-3125 potentially provides clues to the nature of the X-ray surface emission from isolated neutron stars, whereas the fact that the spectrum evolves may have implications for the structure of neutron stars, e.g. if the evolution is a consequence of precession. In order to further monitor its spectral evolution, and to investigate the spectrum for Å with high spectral resolution, we were granted Director’s Discretionary Time (DDT) on Chandra for observing RX J0720.4-3125 with the Low Energy Transmission Grating Spectrometer (LETGS) in combination with the HRC-S (High Resolution Camera) microchannel plate detector. In this letter we report on the analysis of this observation. We show that the spectrum has continued to evolve: it has further hardened, but the attenuation at long wavelengths has disappeared.
2 Observation and data analysis
Chandra observed RX J0720.4-3125 for 35 ks on February 27, 2004 (Obs. ID 5305) as part of its DDT program. For our analysis we used the cleaned event list available from the Chandra X-ray Center. Spectral extraction and ancillary response files were made using the standard Chandra reduction package CIAO v.3.0.2. For comparison we also analyzed the longest archival LETGS observation, made on February 2, 2000 (Obs. ID 745, see also Kaplan et al., 2003), and the six archival XMM-Newton Reflective Grating Spectrometer (RGS) data sets discussed in de Vries et al. (2004).
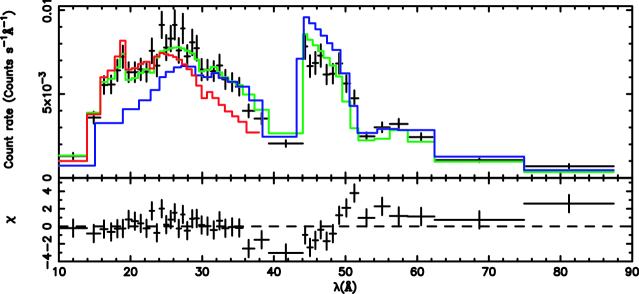
The LETGS DDT spectrum is shown in Fig. 1. The spectrum is clearly harder than the LETGS spectrum of February 2000. This confirms the discovery of spectral evolution of RX J0720.4-3125 (de Vries et al., 2004). However, it is clear that the source has continued to evolve since the last XMM-Newton observation of 27 October 2003, as the attenuation of the emission above 23 Å, which increased with time and was very prominent in the last RGS spectrum, has almost disappeared. In fact, unlike the last RGS spectrum both LETGS spectra can be fitted reasonably well with pure blackbody models, but with different temperatures. The new spectrum requires a hotter blackbody temperature of eV than that of February 2000, which is best fitted with a temperature of eV. The precise values for temperature depend on the modeling assumptions (Table 1), e.g. whether we allow the interstellar absorption to vary from one observation to another (columns free) or whether we fit the two spectra simultaneously, forcing the absorption parameters for the two models to be equal.
| 2/2/2000 | 27/2/2004 | |||
| Parameter | free | jointly fitted | free | |
| (eV) | ||||
| (km) | ||||
| () | ||||
| C-statistic/#bins | 727.5/720 | 735.8/719 | 780.6/719 | 771.3/719 |
We note that the spectral fitting can be further improved for both LETGS spectra by an additional soft emission component, which contributes to Å. However, we do not want to overemphasize this. First, it may be the result of calibration uncertainties regarding the instrument sensitivity. Secondly, assuming that the additional component is real and caused by thermal emission, a very cool blackbody is required ( eV), with an emitting area too large for a neutron star, corresponding to a radius of km (following Kaplan et al., 2003, we assume here, and throughout the rest of the text a distance of 300 pc).
![[Uncaptioned image]](/html/astro-ph/0405407/assets/x2.png)
The flux evolution of RX J0720.4-3125 for the wavelength ranges 10-13 Å, 23-38 Å and the combined range, determined from XMM-Newton-RGS (open squares) and Chandra-LETGS spectra (triangles) The fluxes are normalized to the fluxes of the first RGS and LETGS observations respectively, which are thus per definition 1.
The observed increase of the emission above 23 Å with respect to the last RGS observation is very interesting, but also somewhat unfortunate, as the broad spectral range of the LETGS would have allowed to put better constraints on the spectral shape of the low energy attenuation. For instance, de Vries et al. (2004) showed that the deviations from a blackbody spectrum apparent from the XMM-Newton-RGS spectra, could be either modeled by a broad Gaussian absorption component, or by a blackbody modified by a multiplicative power law. de Vries et al. (2004) favored the characterization by a power law times a blackbody, as it provided good fits to the data with fewer parameters: Apart from the blackbody parameters, only the power-law slope had to be determined. Although there is no clear physical rational for such a model, the spectral evolution could be characterized by just one parameter: the power-law slope. Changing the power-law slope results in a simultaneous hardening and supression of long wavelength emission, which describes well the spectral evolution up to October, 2003, see Fig. 2. 111In order to reduce the effects of x[systematic uncertainties in the sensitivity of the two instruments, we have normalized the fluxes to those of the first observation with each instrument. The normalized fluxes can be converted to absolute fluxes by multiplication with erg s-1cm-2 (23-38 Å) and erg s-1cm-2 (10-23 Å).
The alternative spectral model discussed in de Vries et al. (2004), a blackbody with Gaussian absorption, e.g. caused by proton cyclotron absorption, has three additional parameters: central energy, , width, , and normalization. Such a model has been considered by van Kerkwijk et al. (2004) for RX J1605.3+3249, and for RX J0720.4-3125 by Haberl et al. (2003), who found a central energy of 271 eV and width eV. Reanalyzing the RGS spectra for this study, and simultaneously fitting all spectra with a blackbody model with Gaussian absorption with one central energy and width gives eV (40.5 Å) and eV. The central energy is outside the RGS spectral range and the width is so large that, as far as the RGS spectra are concerned, the Gaussian absorption component is indistinguishable from an exponential absorption feature. However, the RGS spectra are inconsistent with the best-fit Gaussian parameters found by Haberl et al. (2003), mainly because the RGS spectra require a broader absorption feature than a Gaussian absorption with eV.
Whatever the best model to describe the deviations from a blackbody spectrum, the new LETGS spectrum breaks the trend that a spectral hardening is accompanied by a decrease of long wavelength emission. The flux in the spectral range from 10-90 Å has slightly increased since February 2000 by 8%, but the best-fit parameters of the blackbody model imply that the total blackbody flux has hardly changed. Taken at face value this would imply that the emission area must have decreased (Table 1).
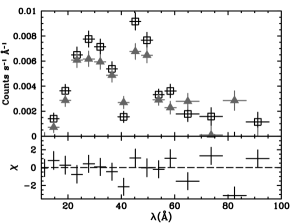
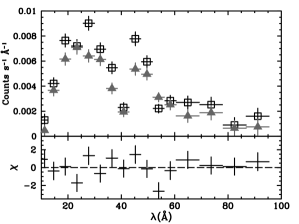
It is of interest that apart from a long term change in the spectrum, XMM-Newton CCD spectroscopy indicates that the spectral shape is also a function of pulse phase (Cropper et al., 2001; Haberl et al., 2003), and is in itself also subject to evolution (de Vries et al., 2004). Unfortunately, the RGS timing resolution (4 s) is not sufficient to check the shape of the long wavelength attenuation as a function of pulse phase. On the other hand, the timing resolution of Chandra’s HRC-S detector is ms. We therefore folded the events of both the February 2000 and 2004 observation with the 8.3911 s period (see Cropper et al., 2004, for the latest timing results), and added a timing offset in order to align the folded light curves so that the maximum emission occurs at phase 0.25 and the minimum at 0.75. We then extracted spectra for the phase bins 0.125 - 0.375 and 0.625-0.875 (Fig. 2).
Apart from an obvious variation in brightness between on and off peak, the overall shapes of the spectra do not change much. In order to test this we statistically compared the two spectra for each observation by direct comparison of the countrates per spectral bin. We assumed that the spectra are the same in both phase bins, except for a normalization factor. The best fitting normalization factors, i.e. the ratio in flux between on and off peak emission, are (Feb. 2000) and (Feb 2004), which is consistent with previous published pulse profiles (Cropper et al., 2001; de Vries et al., 2004). Comparing the on peak spectra with the off peak spectra multiplied by the normalization factor we obtained respectively and , which corresponds to probabilities of 8% and 27% that on and off peak spectra are similar. Our limits for variations are still consistent with the results of Cropper et al. (2001), who found variable absorption of the order of cm-2. Note that although the LETGS has a higher spectral resolution, the XMM-Newton CCD instruments have a much higher effective area. Phase resolved spectroscopy with the LETGS does, however, indicate that whatever the phase dependent spectral changes, they must be rather subtle and are probably caused by broad features.
3 Discussion
Following the discovery of long term spectral changes in the X-ray emission of RX J0720.4-3125 by XMM-Newton, the new Chandra DDT observation shows that the X-ray spectrum of RX J0720.4-3125 has continued to evolve. In particular the spectrum has remained hard from October 2003 to February 2004, but, somewhat unexpected, the attenuation of emission at wavelengths longer than 23 Å has disappeared.
A simple minded explanation would be that part of RX J0720.4-3125 surface must have heated up in the course of the last 4 years, initially accompanied by absorption, but which disappeared between October 2003 and February 2004. The absorption mechanism could be proton cyclotron absorption, as was invoked to explain the broad absorption features in the spectra of other isolated neutron stars.
However, such an explanation is not completely consistent with the evolution of the spectrum of RX J0720.4-3125. First of all, if the surface is heated up by a starquake (Larson & Link, 2002), or by increased accretion from the interstellar medium, we would expect that an additional hot spot at the surface would appear, or that the existing hot spot would become hotter. As a result the total blackbody flux would increase. This is, however, in disagreement with our best-fit blackbody parameters and the flux decrease between 45-55 Å (Fig. 1). Note that heating as a result of accretion from the interstellar medium is also unlikely given the the high proper motion of the neutron star ( mas/yr, Motch et al., 2003).
Our suggestion that the spectral evolution of RX J0720.4-3125 is due to precession (de Vries et al., 2004), can at least qualitatively explain the results. It assumes that the emission remains unchanged, but that we see the hot spot under different viewing angles. Free precession has been observed in some pulsars (e.g. Stairs et al., 2000). Recently Wasserman (2003) has calculated the expected precession period caused by an oblique magnetic field and magnetic stresses in the neutron crust. His model requires a Type II superconducting interior. The expected precession period scales as , with the rotation period. For RX J0720.4-3125, which has an inferred magnetic field of G (Cropper et al., 2004), the expected precession period is yr, which is consistent with the timescale of the spectral evolution. Moreover, XMM-Newton CCD spectra indicate that a modulation of the spectrum with pulse phase is present, and the fact that pulsation can be observed at all requires anisotropic surface emission (Cropper et al., 2001). As the phase modulation of the spectrum also implies a spectral change with viewing angle, it is not unreasonable to assume that precession gives rise to a similar modulation of the spectrum with precession phase.
Theoretically a strong effect of the viewing angle on the observed spectrum from a highly magnetized atmosphere is to be expected. The reason is that protons and electrons in the neutron star atmosphere are constrained to move along the magnetic field lines. This results in radiation that is strongly polarized and angle dependent. This is further enhanced for magnetic fields G, for which vacuum polarization becomes important. This is a quantum electrodynamics effect that changes the polarization mode as the photon traverses a density gradient (Özel, 2001; Ho & Lai, 2004).
The new Chandra observation is not able to confirm that the attenuation has an approximate Gaussian shape, as may be expected for proton cyclotron absorption. However, as the spectrum of RX J0720.4-3125 continues to evolve, future Chandra-LETGS observations may be able to constrain the spectral model further. Long term monitoring is necessary to test the precession idea, since it implies a cyclic spectral evolution. Kaplan et al. (2003) suggested that RX J0720.4-3125 is an off-beam radio pulsar. If it is indeed precessing, there is a possibility that at some point during its cycle the radio beam will be directed toward the earth.
Finally, we point out that other isolated neutron stars may show similar behavior, indicative of precession. Further observations of those sources is therefore important for increasing our understanding of both the hot surface of neutron stars and for probing their internal structure.
References
- Arnaud (1996) Arnaud, K. A. 1996, in ASP Conf. Ser. 101: Astronomical Data Analysis Software and Systems V, Vol. 5, 17
- Cash (1979) Cash, W. 1979, ApJ, 228, 939
- Cropper et al. (2004) Cropper, M., Haberl, F., Zane, S., & Zavlin, V. 2004
- Cropper et al. (2001) Cropper, M., Zane, S., Ramsay, G., Haberl, F., & Motch, C. 2001, A&A, 365, L302
- de Vries et al. (2004) de Vries, C. P., Vink, J., Méndez, M., & Verbunt, F. 2004, A&A, 415, L31
- Haberl et al. (1997) Haberl, F., Motch, C., Buckley, D. A. H., Zickgraf, F.-J., & Pietsch, W. 1997, A&A, 326, 662
- Haberl et al. (2003) Haberl, F., Schwope, A. D., Hambaryan, V., Hasinger, G., & Motch, C. 2003, A&A, 403, L19
- Haberl et al. (2003) Haberl, F., Zavlin, V. E., Truemper, J., & Burwitz, V. 2003
- Ho & Lai (2004) Ho, W. C. G. & Lai, D. 2004, ApJ (in press)
- Kaplan et al. (2003) Kaplan, D. L., van Kerkwijk, M. H., Marshall, H. L., Jacoby, B. A., Kulkarni, S. R., & Frail, D. A. 2003, ApJ, 590, 1008
- Larson & Link (2002) Larson, M. B. & Link, B. 2002, MNRAS, 333, 613
- Lenzen & Truemper (1978) Lenzen, R. & Truemper, J. 1978, Nature, 271, 216
- Motch et al. (2003) Motch, C., Zavlin, V. E., & Haberl, F. 2003, A&A, 408, 323
- Özel (2001) Özel, F. 2001, ApJ, 563, 276
- Paerels et al. (2001) Paerels, F. et al. 2001, A&A, 365, L298
- Stairs et al. (2000) Stairs, I. H., Lyne, A. G., & Shemar, S. L. 2000, Nature, 406, 484
- Turolla et al. (2004) Turolla, R., Zane, S., & Drake, J. J. 2004, ApJ, 603, 265
- van Kerkwijk et al. (2004) van Kerkwijk, M. H., Kaplan, D. L., Durant, M., Kulkarni, S. R., & Paerels, F. 2004
- Wasserman (2003) Wasserman, I. 2003, MNRAS, 341, 1020