An X-ray Timing Study of XTE J1550–564: Evolution of the Low Frequency QPO for the Complete 2000 Outburst
Abstract
We report on RXTE observations of the microquasar XTE J– during a day outburst in April-June 2000. We focus here on the temporal properties of the source and study the behavior of low frequency ( Hz) quasi periodic oscillations (LFQPO), which seem to be of different types. We focus on the so-called type C (according to the classification of Remillard and collaborators), which corresponds to a strong Hz LFQPO, found to be present during at least 17 observations. We find that the frequency of the QPO is better correlated with the soft X-ray ( keV) flux than with the hard flux ( keV). If soft X-rays represent the behavior of an accretion disk, the relation shows that the disk may set the LFQPO frequency. In two cases, the identification of the type of QPO is not straightforward. If the QPOs in those two cases are type A (or B), then we may be seeing the QPO type alternate between type C and type A (or B), and this may represent some rapid changes in the physical properties of the accretion flow, before the system stabilizes and slowly decays toward the end of the outburst. On the other hand, if all the QPOs are of type C, we may be observing an inversion in the frequency vs. flux relation, similar to that seen in GRO J165540. We discuss the QPO behavior in the framework of theoretical models.
Accepted for publication in ApJ
1 Introduction
Soft X-ray transients (SXT) are accretion-powered binary systems,
hosting a compact object (either a neutron star or a black hole), which
spend most of their lives in quiescence, and are detected in X-rays as
they undergo episodes of outburst.
During an outburst, a given source can transit through spectral
states defined by its spectral and temporal properties (see e.g.
McClintock & Remillard 2003 for a recent review on spectral states).
The power density spectrum in the low/hard state
(hereafter LHS) is characterized by strong aperiodic noise. The total
fractional variability is high (often up to 50-60 rms), and strong
( rms) low frequency QPOs (0.1-10 Hz, hereafter LFQPO) are
often observed. The continuum of the power spectra can usually be approximated as a
broken power-law with a flat power spectrum below Hz and a
power spectrum that decreases with frequency above the break.
A powerful compact jet is an ubiquitous property of this state
(Fender 2001). In the High/Soft State (also referred to as the Thermal
Dominant state or TD), the fractional variability is weak (a few ),
and the power spectrum typically has a power-law shape, scaling roughly as
the inverse of the frequency. The power density spectra for the
intermediate and very high states (IS/VHS) are similar to each other,
with a fractional variability between and . Low and
high frequency QPOs are sometimes present in the IS/VHS (e.g. Remillard
et al. 1999, and references therein; Homan et al. 2001; Miller et al. 2001).
Based on the analysis of Ginga data, Rutledge et al.
(1999) showed that the VHS is spectrally intermediate between the
LHS and the TD. The similarity between VHS an IS may indicate that
both are the same state observed at different luminosities (Méndez
& van der Klis 1997, Homan et al. 2001). We will refer to this
state as to Steep Power Law state (SPL, McClintock & Remillard 2003).
XTE J– was first detected by the All-Sky Monitor (ASM) on board
RXTE on 1998 September 7 (Smith 1998) as it was transiting from
quiescence into a LHS. It exhibited, a few days later, one of the brightest
flares ( Crab) observed with RXTE. Extensive spectral
analysis is reported in Sobczak et al. (1999) and Sobczak et al. (2000a).
Homan et al. (2001), based on the spectro-temporal properties of
XTE J1550–564, showed that although the source was generally found in a
TD during the second part of the outburst, hard flares and state
transitions toward SPL and LHS could occur over a wide range of luminosity.
They interpreted this behavior as evidence that spectral states are
set not only by the mass accretion rate, , but that changes in
at least one other physical parameter are also required.
Based on its spectral and temporal properties, it was believed
early-on that XTE J– hosts a black hole rather than a neutron star
(Sobczak et al. 1999, Cui et al. 1999). Its black hole nature was confirmed
with a compact object mass measurement of
(Orosz et al. 2002). Low and high frequency QPOs have been detected in
some RXTE observations (resp. , and Hz),
making XTE J– one of the eight black hole binaries for which high frequency
QPOs have been reported (Remillard et al. 1999; Sobczak et al. 2000b; Homan
et al. 2001, Miller et al. 2001, Remillard et al. 2002a, Homan et al. 2003a,
Homan et al. 2003b). Radio monitoring has shown jet features with an
apparent motion (Hannikainen et al. 2001), firmly establishing the
source as a microquasar. XTE J– is also the first microquasar for which
large scale X-ray jets have been observed (Corbel et al. 2002). After a
month outburst, XTE J– returned to quiescence in June 1999
(MJD 51346).
On 2000 April 6, XTE J– became active again (Smith et al. 2000)
after several months of quiescence, undergoing a new outburst that
lasted for . This outburst was monitored with RXTE,
the Unconventional Stellar Aspect (USA) experiment, and Chandra.
Reilly et al. (2001) report on the USA observations of the entire
period, and Tomsick, Corbel & Kaaret (2001, hereafter TCK01) report on
the energy spectra measured by RXTE and Chandra during the
decay of the outburst. Radio observations showed evidence for a compact
jet on MJD 51697, and a discrete ejection, possibly associated with
a state transition (Corbel et al. 2001). Based on an analysis of
the spectral evolution of XTE J– over its whole 2000 outburst using the
RXTE data, we showed that the source transited from an initial LHS
toward a SPL, which probably reflected a change in the relative importance
of the emitting media, rather than an increase of the accretion rate
(Rodriguez, Corbel & Tomsick 2003, hereafter RCT03). In addition, we
proposed that the decrease of the X-ray luminosity right after the maximum
peak on MJD 51662 might be due to the ejection of coronal material. It is
also interesting to note that the cut-off in the energy spectrum disappears
at the same time (RCT03). During the SPL, the low values of the color
radius returned from the fits and their steadiness over days
suggest that the inner disk is close to its Last Stable Orbit (LSO), in
good agreement with the detection of a HFQPO with little variation in
frequency over this time period (Miller et al. 2001). Kalemci et al. (2001)
(hereafter K01) studied the temporal behavior of the source as it was
entering the LHS, and they report on the detection of a Hz QPO.
K01 discuss the possibility that this QPO could be of the same type as the
higher frequency ( Hz) QPO detected earlier during this outburst
(Miller et al. 2001) at a frequency 249–276 Hz and suggest that if the QPO
is related to the accretion disk (orbiting clumps, Lense-Thirring
precession or diskoseismic oscillations), the frequency of the QPO may
indicate that the inner edge of the disk moves outward during the decay of
the outburst. This interpretation is compatible with the spectral
studies of TCK01 and RCT03.
We present here a detailed analysis of the evolution of a LFQPO during the 2000 outburst of XTE J–, from MJD 51644 until MJD 51690. To the previous study of K01 (covering MJD 51680–51690), we add the complete analysis of the LFQPO during the initial (MJD 51644–51678) part of the outburst, including the beginning of the transition to the LHS. The organization of the paper is as follows: We start by presenting the data reduction and analysis methods used. Then, we describe the characteristics and evolution of the LFQPOs. Finally, we discuss our results in the framework of theoretical models.
2 Observations and Data Reduction
We reduced and analyzed the RXTE data from the dates preceding
those presented in K01, i.e. from April 12 (MJD 51646) to May 14 (MJD 51678),
and we incorporate the results from K01 below, allowing us to study the complete outburst.
We used the LHEASOFT package v5.3 for our analysis.
We restricted ourselves to the times when the target elevation angle was
more than above the limb of the Earth, the satellite
pointing was within of the target, and we rejected the
data taken while crossing the South Atlantic Anomaly.
We then extracted Proportional Counter Array (PCA) light curves using
all Proportional Counter Units (PCUs) that were simultaneously
turned on over a single observation. The data we used came from
several different RXTE programs (P50134, P50137, and P50135),
and not all the observations used the same PCA modes, leading to
different data formats. However, in every case, we were able to
extract light curves with s ( ms) time resolution.
For each observation, we extracted four light curves in the energy
ranges shown in Table 1, and we also extracted
a 2–40 keV light curve. We produced Poisson noise corrected power
spectra for each observation using POWSPEC V1.0 over intervals
of 64 s duration, between Hz and Hz. We averaged power
spectra of observations taken the same day and applied geometrical
rebinning in all cases. For each power spectrum, we estimated the
background rate using pcabackest v3.0, and used the average
rate in order to estimate the true rms normalization following, e.g.,
Berger & van der Klis (1994) and K01111Note that two
observations were made after the loss of the propane layer in PCU 0.
However, this unit was turned off during both observations so that
no PCU 0 background estimate was required.
In order to characterize the QPO with the best possible sampling, we included in our study the data obtained with the USA satellite, as described in Reilly et al. (2001). In particular, we focus on both the QPO centroid frequency and its fractional amplitude. Note that the latter is barely comparable with that obtained from the RXTE observations due to the fact that the USA energy range of 1–16 keV is lower than the RXTE energy range.
| Abs. Channels | Epoch 4 (until May 12, 2000) | Epoch 5 |
|---|---|---|
| 0–9 | keV | keV |
| 10–17 | keV | keV |
| 18–35 | keV | keV |
| 36–91 | keV | keV |
3 Results
3.1 Power Spectra
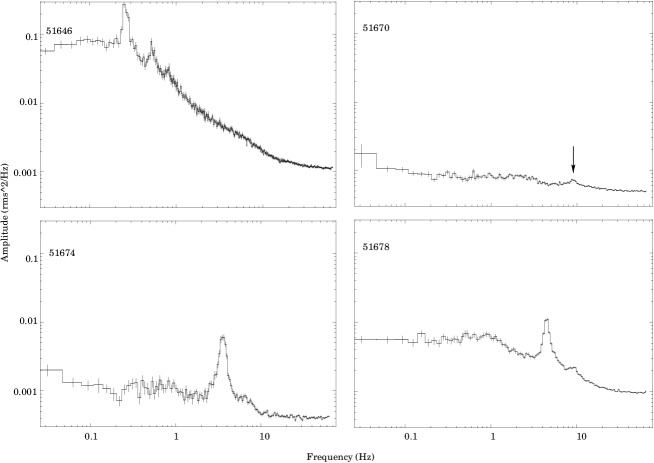
We fit the 2–40 keV power spectra between 0.015 Hz and 20 Hz with a model
consisting of Lorentzians. During the LHS, three such features are
included in the modeling, whereas, during most of the SPL, two are sufficient
to give satisfactory fits. In all cases, one of the Lorentzians is zero-centered,
while the others represent “bumps” visible in the power spectra at higher
frequencies (Fig. 1). Zero-centered Lorentzians are usually
attributed to shot noise in the modeling of power spectra. However, recent
studies have pointed out a more general use of this type of model in the cases
of black hole binaries (Nowak et al. 2002; Belloni et al. 2002). Indeed, the
shape of a broad Lorentzian is similar to a broken power law: it is roughly
flat below a break frequency ,
where is the FWHM, and is the centroid frequency of
the Lorentzian returned from the fits. Above , the Lorentzian
decreases roughly as a power-law. In addition, some peaked noise is also
detected in the Hz range in most of our power spectra. These features
are well fitted by narrow Lorentzians of Q values () ,
leading us to consider them as QPOs. In addition, harmonically related QPOs are
detected in some observations. The QPO parameters are reported in
Table 2, while Fig. 2 shows the evolution of the
frequency of the fundamental QPO during the outburst. In addition to the
RXTE results, we superimposed the results obtained with the USA
instrument (from Reilly et al. 2001). The points plotted after MJD 51678 are
from K01.
| DATE | QPO1 Freq. | Q1 | rms | QPO2 Freq. | Q2 | rms | |
|---|---|---|---|---|---|---|---|
| (MJD) | (Hz) | () | (Hz) | () | (d.o.f.) | ||
| 51646.3 | 162.1 (150) | ||||||
| 51648.7 | (frozen) | 138.2 (113) | |||||
| 51650.7 | (frozen) | 119.4 (112) | |||||
| 51651.4 | 148.8 (110) | ||||||
| 51652.2 | 124.3 (110) | ||||||
| 51653.5 | 96.6 (110) | ||||||
| 51654.7 | 119.8 (110) | ||||||
| 51655.7 | Broad feature | 145.5 (110) | |||||
| 51658.6 | 145.6 (110) | ||||||
| 51660.0 | 379.4 (280) | ||||||
| 51662.1 | 98.2 (85) | ||||||
| 51668.8 | 8.2 | 122.4 (120) | |||||
| 51669.1 | 2.5 | 95.5 (78) | |||||
| 51670.5 | 7.5 | 126.9 (94) | |||||
| 51670.7 | 2.87 | 128.1 (113) | |||||
| 51671.4 | 2.27 | 102.5 (89) | |||||
| 51672.4 | 3.9 | 107.2 (89) | |||||
| 51674.7 | 88.5 (92) | ||||||
| 51675.4 | 124.1 (113) | ||||||
| 51676.3 | 126.6 (108) | ||||||
| 51678.4 | 142.1 (113) | ||||||
From the very beginning of the outburst (in the LHS) until MJD 51662, the
keV power spectra show a strong (up to rms amplitude) LFQPO that
is detected along with its first harmonic (up to rms amplitude).
We note, in some cases, the presence of a second harmonic, but the feature is
weak and is not detected in majority of the observations.
During the first part of the decline (MJD 51664–51672), in the SPL,
while the energy spectra show the presence of a thermal component with a
constant inner disk temperature around 0.8 keV (from MJD 51664 to MJD 51674,
RCT03), we detect a Hz QPO with a rather low rms amplitude ()
in some observations (Table 2). These QPOs are not reported
in the Reilly et al. (2001) paper on the USA observations, and non-detection
of these weak QPOs by USA may be expected due to the smaller effective
area of USA compared to RXTE. As discussed in detail in
Sec. 4.1, these QPOs are a different type from the strong rms
amplitude QPOs seen in the LHS. In some cases, we detect a rather broad feature,
which we do not consider to be a QPO as it has a Q value 2. On MJD 51664,
for example, just after the soft X-ray maximum, we detect a broad feature with a
centroid frequency Hz, and a Q value equal to 1.7. Broad
features can be due to the presence of a frequency evolving QPO (as is sometimes
the case for GRS +, e.g. Rodriguez et al. 2002a). We produced a dynamical power
spectrum for the observation on MJD 51664 to check for frequency evolution in
the components of the power spectrum, and we do not see any evidence
for a variable feature.
On MJD 51674, while the source remains in the SPL, and the spectral
parameters show no particular variations, we detect a LFQPO with a rather
low frequency (3.60 Hz) compared to the previous day (Table 2)
222We note, however, that if the transitions to the LHS are defined through
sharp changes in temporal properties as presented in Kalemci et al. (2004), then
the source was already in the LHS on MJD 51674. For the sake of clarity, however,
we will, in the course of this paper, keep the state transitions identified in RCT03.
They are shown on Fig.2. A harmonic is also detected
on MJD 51674. Both features (QPO+harmonic) are present in the next 12
observations (MJDs 51675-51690, K01).
From Fig. 2, one can see that the frequencies increase during
the rise of the outburst, whereas they decrease during the return to quiescence.
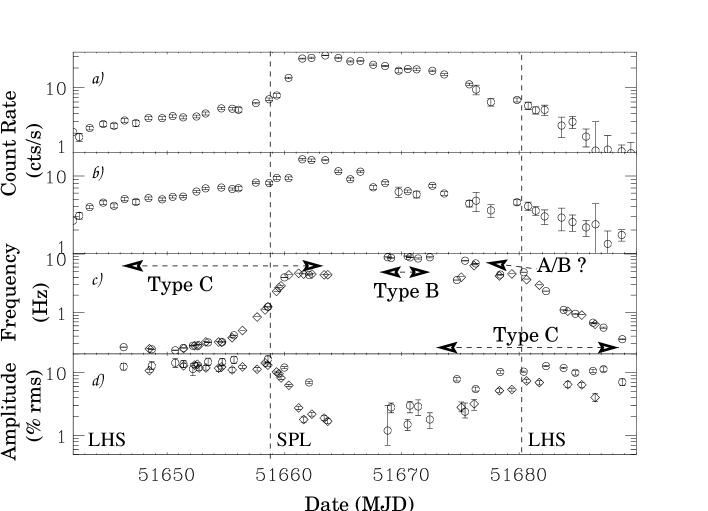
The power of the fundamental is high during the initial LHS and decreases significantly after the state transition. At the maximum of the soft flux on MJD 51662, the rms amplitude has dropped to (Fig. 2). During most of the SPL, the QPO is weak and sometimes no QPO is detected (see also Reilly et al. 2001). For a 1 Hz FWHM QPO, the upper limit on the rms amplitude is around during the SPL ( on MJD 51664, and on MJD 51671). From MJD 51674 through the end of our study, the trend of the amplitude is rather complex. On MJD 51674, when the source was in the SPL state, the rms amplitude is (see Table 2). Interestingly, on the following day (MJD 51675), although there is no significant change in the energy spectrum, the QPO properties are much different with a drop in the rms amplitude to and an increase in frequency from 3.6 Hz to 7.7 Hz. After that day, the amplitude slowly increases, reaching a local maximum once the transition to the LHS has completed on MJD 51682 (K01). The mean amplitude during that period is slightly lower than that of the initial LHS. Given the uncertainties on the harmonic parameters, it is difficult to deduce a precise behavior in that case (Fig. 2 and Table 2).

3.2 Spectro-temporal analysis of the LFQPO
In order to study the energy dependent behavior of the QPO, we extracted
power spectra in four energy bands as explained in section 2.
Each power spectrum is fitted with the same multi-Lorentzian model described
above. The resultant plots of QPO amplitude vs. energy (hereafter referred to
as “rms spectra”) for the fundamental are shown in Fig. 3
(from MJD 51680 through MJD 51690 the results are plotted in Fig. 4 in K01).
During the LHS (MJD 51646–51658), at the level, the rms
spectra are roughly flat (Fig. 3). A clear change
is observed during the SPL (MJD 51660–51678), where the rms spectra increase
with energy, and seem to flatten in the highest energy band. From MJD 51664
through MJD 51674, the Hz feature
appears weak in the 2–40 keV band (). When we look at the energy
dependence of its fractional amplitude, it is detected only in the 7–15 keV
range, at a weak level (), and it is not visible in the other energy
bands.
3.3 Evolution of the Type C QPO frequency with the flux
Given the errors on the disk inner radius returned from the fits (RCT03), the
frequency-radius, or frequency-temperature relation cannot be explored
here. Therefore, we first focus on the dependence of the QPO frequency with the
flux, which also allows us to study the QPO behavior over the whole data set.

The evolution of the QPO frequency with time, as seen by RXTE and
USA is plotted in Fig. 2, while the evolution of the
frequency vs. the flux (as seen by RXTE only) in different energy bands
is plotted on Fig. 4. When looking at the frequency
evolution with time (Fig. 2), it is quite interesting to note
that the QPO appears/disappears at the same frequency during the rise and the
decline of the outburst. After it reappears, the frequency increases and then
decreases, while the ASM count rate decays. The possible inversion could have
different origins as will be discussed in the next sections.
For both epochs (initial LHS and final stage of the outburst from 51674 through
51688), the evolution of the frequency correlates better with the and
keV band fluxes. However, there are some differences between the two epochs. For
the points corresponding to the rising part of the outburst, the evolution of
the frequency vs. the 2-4 keV flux starts out flat and then becomes linear
(above erg cm-2 s-1), up to
erg cm-2 s-1, where a flattening (hereafter
plateau) is visible. A similar trend is seen in the 4–7 keV band.
For the points corresponding to the decline, the evolution of the
frequency with the 2–4 keV flux is linear up to
erg cm-2 s-1. Then, the frequency decreases
from Hz to Hz, while the 2–4 keV flux is still
increasing (Fig. 4). The 4–7 keV band shows a similar
trend. We observe two opposite directions of the QPO frequency vs. flux
evolution: a more common one, where the frequency is positively correlated
with the (soft) flux, and an inversion of this correlation, although based on
few points, occurring at higher flux. The plateau
(Fig. 4) occurs at high soft flux
( erg cm-2 s-1) at times where the disk reaches
the highest temperatures, and contributes the most to the energy spectra,
meanwhile the power law contribution has decreased significantly (Fig.
2 and RCT03). There are no such clear trends in the higher
energy ranges (Fig. 4).
4 Discussion
4.1 Two Different types of LFQPOs ?
The LFQPOs in XTE J– can be classified in three types (Remillard et al. 2002a,
and references therein). The first type, type A, corresponds to broad QPOs
(Q) with low coherence and negative time lags. The second ones
(type B) are narrower (Q), have high coherence, and positive
time lags. Both these types have a rather faint fractional amplitude (a few ),
centroid frequencies between Hz, and are usually observed simultaneously
with HFQPOs. Type C corresponds to narrow (Q 10) QPOs with variable frequency.
They have a high coherence and usually display negative time lags, although
positive time lags are sometimes seen with values up to s.
They are usually not simultaneous with HFQPOs. Fig. 1 shows 2–65 keV
power spectra extracted on MJD 51646 (strong LHS LFQPO), MJD 51670 (weak SPL QPO),
and on MJD 51674 (strong SPL LFQPO). The strong QPOs we observe here, are likely
to be of type C (see also the discussion in Reilly et al. 2001).
The Hz faint QPO appears at times where the soft bands are
dominated by the thermal component (RCT03). Therefore, the non-detection of the QPO
in the soft bands could simply reflect the fact that the disk photons are un-modulated,
making the QPO appear fractionally weaker. However, the type C LFQPO has an amplitude
that is usually higher than rms, whereas the Hz QPO has an amplitude
that is lower (3 at maximum). Even in the 7–15 keV range, where the Hz
QPO has its maximum rms amplitude, it is always weaker than the type C QPOs.
This suggests that the QPOs are different types. The lack of (detected) harmonics
may further confirm the QPO difference, although they might not be detected due to
low fractional amplitudes.
The Hz QPO is observed at the same time that HFQPOs are observed
(Miller et al. 2001). Although no lag study was performed for the observations
before MJD 51674, a comparison with the analysis of Remillard et al. (2002a) indicates
that the Hz QPO may be type B.
The QPO on MJD 51674 has a low frequency, a high amplitude, and is rather narrow. In addition it has a high coherence and a slightly positive time lag ( s, see Fig 4.40 in Kalemci 2002). It is therefore very likely that this QPO is type C. From MJD 51675 to MJD 51676 the QPOs do not satisfy all the criteria in the definition of type C QPOs, and may not be of type B either. This leads us to suggest the possibility that the QPOs seen on MJD 51675 and 51676 are type A, although the type C QPO has re-appeared on MJD 51674. From MJD 51678 through the end of our study, the QPOs manifest all properties of type C (see also Fig. 4.42 in Kalemci 2002). In the following, we will not consider type B QPOs further. Furthermore, the non-detection of this feature in the lowest energy bands prevent any spectral study of this QPO as the one presented below.
4.2 The Type C LFQPOs
There have been several reports on a relation between QPO frequency
and soft flux (e.g. GRS 1915+105, Markwardt, Swank & Taam 1999; Rodriguez et al.
2002b; 4U 1630–47, Trudolyubov et al. 2001). Such a correlation is, however,
not always observed, as e.g. in XTE J1118+480 (Wood et al. 2000), or GX 3394
(Nowak, Wilms, Done 1999). The correlation of the QPO frequency with the soft
flux might indicate a connection with the Keplerian frequency of the inner boundary
of the accretion disk. This interpretation seems in good agreement with
our observations, especially during the outburst decline, during which the QPO frequency
is linearly correlated with the soft flux (Fig. 4), which has been
suggested to track changes in the accretion disk (RCT03, K01). The flatness of the
frequency vs. Flux (Fig. 4) during the rise to outburst may appear
in contradiction with such an interpretation. This apparent lack of correlation,
however, most likely reflects the influence of the corona, and may be a signature of the
source spectral hysteretic pattern (RCT 03, Kalemci 2002, Kalemci et al. 2004).
The observation of a clear change of the shape of the rms spectra
between the LHS and the SPL (Fig. 3) is rather interesting.
This change is clearly related to the source state
(Fig. 3 in this work and Fig. 4 of K01). At low energies, the
amplitude of the QPO is anti-correlated with the soft X-ray flux,
which may simply reflects the influence of the disk on the overall
spectrum of the source. The local maximum at around 10 keV seen in
K01, and the change in slope of the rms spectra (K01) at the end of the outburst
raises challenging questions on the origin of the feature. The fact
that the QPO rms amplitude is higher when the disk thermal component is weak
or absent (and vice versa, RCT03) may indicate that the accretion disk is not
the source of the modulated photons.
We should note that a disk origin cannot completely be ruled out since some
amplification by the corona could lead to the observed QPO spectra (e.g. Lehr
et al. 2000). Furthermore, it is important to note that during the first LHS,
the amplitude of the QPO seems to increase (although very little) when getting
closer to the transition (at least until MJD 51658, Fig. 2),
while the evolution of the source flux is, in part, due to the approach of the
accretion disk (RCT03).
A connection of the QPO frequency with the Keplerian frequency, and an
anti-correlation of its rms amplitude with the flux from the accretion disk can
be understood, if the QPO is produced at
a transition layer between the accretion disk and an inner hot accretion flow
(Chakrabarti & Titarchuk 1995). In that case, the QPO would represent radial
oscillations of the transition layer (the CENBOL for CENtrifugal dominated
BOundary Layer; Molteni, Sponholz & Chakrabarti 1996; Chakrabarti & Manickam
2000), with little or no contribution from the disk photons to the QPO
(Chakrabarti & Manickam 2000). The QPO frequency should be comparable to the
free fall time scale in the inner hot region (Molteni et al. 1996). Therefore,
a smaller inner disk radius will lead to a higher QPO frequency.
Another possibility would involve a QPO produced by a “hot spot,”
vortex, or spiral pattern rotating (at a characteristic frequency) in the disk as e.g.
the Accretion Ejection Instability (AEI, Tagger & Pellat 1999; Tagger et al.
2004). In this model, a spiral pattern rotates at of the Keplerian frequency
at the inner edge of the disk. The relation between the QPO frequency and the
flux is therefore a natural consequence of the instability. Note that in both of
these models, the disk photons do not contain the modulation, explaining the
absence of connection between the disk luminosity and the QPO amplitude, in good
agreement with our observations.
If the two QPOs observed on MJD 51675 and 51676 are of type A
(or even B), as discussed in the previous section, it is interesting to note
that the type C QPO re-appears on MJD 51674 at a frequency close to that
observed just before its disappearance on MJD 51662 ( Hz), and that it
then shows the same kind of plateau value before it decreases after MJD 51680.
This plateau frequency may indicate some saturation, or some limiting value in
the mechanism(s) producing the type C QPO. We should note, however, that during
the 1998-1999 outburst, type C QPOs were observed up to higher frequencies. The
two outbursts are rather different, in particular in their durations and their
maximum luminosities. It is, therefore, conceivable that the accretion flows
manifest different characteristic size or time scales. It is worth mentioning
that in either of the two aforementioned models (CENBOL and AEI), some kind of
symmetry between the rise and fall is expected. We also note that changes in
the physical properties of the source are seen between MJD 51662 and the
following days (disappearance of thermal Comptonization, RCT03), and between
51672 and 51674 (sudden increase of power-law flux, Kalemci et al. 2004). The
transition between two different types of QPOs may indicate some rapid changes
in the physical properties of the accretion flow, before the system stabilizes
and slowly decays toward the end of the outburst.
On the other hand, if the two QPOs observed on MJD 51675 and 51676 are of type C, the inversion of the frequency-flux relation after MJD 51674 (Fig. 4), also visible in the USA data (Fig. 2), is notable. A clear inverted relation was seen during observations of another black hole system, GRO J165540 (Sobczak et al. 2000b; Rodriguez et al. 2002b). In this system, the inverted relation was interpreted as being due to general relativistic effects when the disk was close to its last stable orbit (Varnière et al. 2002). In the case of XTE J1550564, the reversal could have the same origin since it occurs at time when the accretion disk is close to its last stable orbit (RCT03, Kalemci et al. 2004). This would be the first observation of a source showing the “opposite” behavior when the disk is close to the black hole, and the normal relation when it is further out. However, the number of points involved in this inversion is small, and the behavior of the QPO frequency as a function of time has only been observed during this outburst. However, this does not necessarily mean that this is a unique case as a very frequent monitoring campaign was needed to catch the frequency inversion (or the rapidly changing QPO-type). It will be interesting to see if similar behavior is observed from other SXTs with the ongoing observing programs of RXTE.
This research has made use of data obtained through the High Energy Astrophysics Science Archive Center Online Service, provided by the NASA/ Goddard Space Flight Center.
References
- (1) Belloni T., Psaltis D., van der Klis M. 2002, ApJ, 572, 392.
- (2) Berger M. & van der Klis M. 1994, A&A, 292, 175.
- (3) Chakrabarti S.K., Titarchuk L. G. 1995, ApJ, 455, 623.
- (4) Chakrabarti S.K., Manickam S.G. 2000, ApJ, 531, L41.
- (5) Corbel S., Kaaret P., Jain R. K., et al. 2001, ApJ, 554, 43.
- (6) Corbel S., Fender R. P., Tzioumis A. K., et al. 2002, Sci, 298, 196.
- (7) Cui W. , Zhang S.N., Chen W., Morgan E.H., 1999, ApJ, 512, L43.
- (8) Fender R.P 2001, MNRAS, 322, 31.
- (9) Hannikainen D., Campbell-Wilson D., Hunstead R., et al. 2001, Ap& SS, 276, 45.
- (10) Homan J., Wijnands R., van der Klis M., et al. 2001,ApJS, 132, 377.
- (11) Homan J., Klein-Wolt M., Rossi M., et al. 2003a, ApJ, 586, 1262.
- (12) Homan J., Miller J.M., Wijnands R., et al. 2003b, Atel 162.
- (13) Kalemci E., Tomsick, J. A., Rothschild R. E., Pottschmidt K., Kaaret P.,2001, ApJ, 563, 239 , K01.
- (14) Kalemci E. 2002, PhD Thesis, University of California San Diego.
- (15) Kalemci E., Tomsick, J. A., Rothschild R. E., Pottschmidt K., Kaaret P. 2004, ApJ, 603, 231.
- (16) Lehr D.E., Wagoner R.V., Wilms J., submitted to ApJ, astro-ph 0004211.
- (17) McClintock J.E. & Remillard R.A. 2003, in “Compact Stellar X-ray Sources,” eds. W.H.G. Lewin and M. van der Klis, Cambridge University Press/ astro-ph0306213.
- (18) Markwardt C.B., Swank J.H., Taam R.E., 1999, ApJ, 513, 37.
- (19) Méndez M., & van der Klis M. 1997, ApJ, 479, 926.
- (20) Miller J.M., Wijnands R., Homan J., et al. 2001, ApJ, 563, 928.
- (21) Molteni D., Sponholz H., Chakrabarti S.K., 1996, ApJ, 457, 805.
- (22) Morgan E.H., Remillard R.A., Greiner J., 1997, ApJ, 482, 993.
- (23) Muno, M. P., Morgan, E. H., and Remillard, R. A., 1999, ApJ, 527, 321.
- (24) Nespoli, E., Belloni, T., Homan, J., et al. 2003, A&A, 412, 235.
- (25) Nowak M.A., Wilms J., Dove J.B., 1999, ApJ, 517, 355.
- (26) Nowak M.A., Wilms J., Dove J.B., 2002, MNRAS, 332, 856.
- (27) Orosz J.A., Groot P.J., van der Klis M., et al. 2002, ApJ, 568, 845.
- (28) Reilly K.T., Bloom E.D., Focke W., et al. 2001, ApJ, 561, L183.
- (29) Remillard R.A., McClintock J.E., Sobczak G.J., et al. 1999, ApJ, 517, L127.
- (30) Remillard R.A., Sobczak G.J., Muno M.P. & McClintock J.E. 2002a, ApJ, 564, 962.
- (31) Remillard R.A., Muno M.P., McClintock J.E., Orosz J.A. 2002b, APJ, 580, 1030.
- (32) Remillard R.A., Muno M.P., McClintock J.E., Orosz J.A. 2002c, in New Views on Microquasars Eds. Ph. Durouchoux, Y. Fuchs, J. Rodriguez, Center For Space Physics Kolkata, 57.
- (33) Rodriguez J., Durouchoux P., Mirabel F., et al. 2002b, A&A, 386, 271.
- (34) Rodriguez J., Varnière P., Tagger M., Durouchoux P. 2002a, A&A 387, 487.
- (35) Rodriguez J., Corbel C., Tomsick J.A. 2003, ApJ, 595, 1032, RCT03.
- (36) Rutledge R. E., Lewin, W.H.G., van der Klis M., et al. 1999, ApJS, 124, 265.
- (37) Smith D.A., 1998, IAU Circ. 7008.
- (38) Smith D.A., Levine, A.M., Remillard R., Fox D., Schaefer R., RXTE/ASM Team, 2000, IAU Circ. 7394.
- (39) Sobczak G.J., McClintock J.E., Remillard R.A., et al. 1999, ApJ, 517, L121.
- (40) Sobczak G.J., McClintock J.E., Remillard R.A., et al. 2000a, ApJ, 544, 993.
- (41) Sobczak G.J., McClintock J.E., Remillard R.A., et al. 2000b, ApJ, 531, 537.
- (42) Tagger M. & Pellat R. , 1999, A& A, 349, 1003.
- (43) Tagger M., Varnière P., Rodriguez J., Pellat R. 2004, Accepted in ApJ, astro-ph 0401539.
- (44) Tomsick J.A.& Kaaret P. 2001, ApJ, 548, 401.
- (45) Tomsick J.A., Corbel S., Kaaret P. 2001, ApJ, 563, 229, TCK01.
- (46) Trudolyubov S., Borozdin K., Priedhorsky W. 2001, MNRAS, 322,309.
- (47) Varnière P., Rodriguez J., Tagger M. 2002, A&A, 387, 497.
- (48) Vignarca F., Migliari S., Belloni T., Psaltis D., van der Klis M. 2003, A&A, 397, 729.
- (49) Wood K.S., Ray P.S., Bandyopadhyay R.M., et al. 2000, ApJ, 544, L45.