On the cosmological evolution of quasar black-hole masses
Abstract
Virial black-hole mass estimates are presented for 12698 quasars in the redshift interval , based on modelling of spectra from the Sloan Digital Sky Survey (SDSS) first data release . The black-hole masses of the SDSS quasars are found to lie between and an upper limit of , entirely consistent with the largest black-hole masses found to date in the local Universe. The estimated Eddington ratios of the broad-line quasars (FWHM km s-1) show a clear upper boundary at , suggesting that the Eddington luminosity is still a relevant physical limit to the accretion rate of luminous broad-line quasars at . By combining the black-hole mass distribution of the SDSS quasars with the 2dF quasar luminosity function, the number density of active black holes at is estimated as a function of mass. By comparing the estimated number density of active black holes at with the local mass density of dormant black holes, we set lower limits on the quasar lifetimes and find that the majority of black holes with mass are in place by .
1 Introduction
In this proceedings we present a summary of the main results of McLure & Dunlop (2004) which investigates the black-hole masses of a sample of 12698 quasars drawn from the Sloan Digital Sky Survey (SDSS) first data release. In McLure & Dunlop (2004) the black-hole masses of the SDSS quasars are estimated using the so-called virial method. The basic assumption underlying this technique is that the motions of gas in the broad-line region (BLR) of quasars are virialized. Under this assumption the mass of the central black-hole can be estimated from: ; where is the BLR radius and is the orbital velocity of the line-emitting gas. The standard application of this technique uses the FWHM of the H emission line to estimate and the monochromatic Å luminosity to estimate (Kaspi et al. 2000). In addition to this method, the analysis in McLure & Dunlop (2004) employs a re-calibration of the virial mass estimator in terms of the FWHM of the MgII emission line and the Å luminosity (McLure & Jarvis 2002).
The original sample was drawn from the SDSS quasar catalog II (Schneider et al. 2003) which consists of some 17,000 quasars in the redshift range . For the purposes of this study the sample was restricted to 14,000 quasars with , where the upper redshift limit is imposed by the MgII emission line being redshifted out of the SDSS spectra. The flux-calibrated spectra of each quasar was analysed using an automated algorithm to consistently determined the required parameters (principally FWHMs and continuum luminosities). After the removal of objects affected by low signal-to-noise, or artifacts in their spectra, the final sample consisted of 12698 quasars. Although not complete this sample is clearly representative of optically luminous quasars in the redshift interval .
2 Evolution of black-hole mass
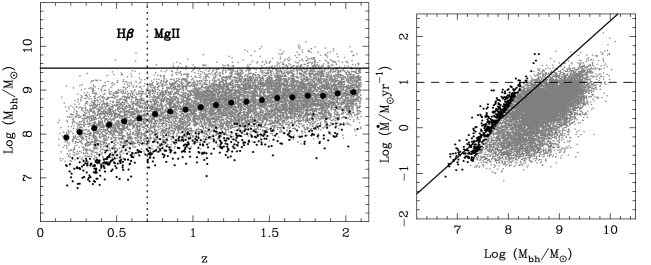
Panel A of Fig. 1 shows the virial black-hole mass estimates versus redshift for the full sample. Two features of this figure are worthy of individual comment. Firstly, although it can be seen that the mean black-hole mass increases with redshift it should be remembered that, because the mean FWHM remains approximately constant with redshift, this is exactly as expected given the flux-limited nature of the SDSS. Secondly, it can be seen that the distribution of the SDSS quasar black-hole masses is entirely consistent with an upper limit of . This limit is consistent with both the most massive black-holes measured dynamically in the local Universe, and the expected black-hole mass limit based on the known properties of early-type galaxies and the locally observed correlation between bulge and black-hole mass (i.e. km s-1 and ). Consequently, in contrast to Netzer (2002), using the MgII-based virial mass estimator no evidence is found for a conflict between quasar black-hole masses at and the contemporary, or ultimate properties of their host-galaxy population.
3 Quasar accretion rates
Panel B of Fig 1. shows the estimated quasar accretion rates versus black-hole mass for the full sample, where the accretion rates have been calculated from the estimated bolometric luminosities assuming a canonical mass-to-energy conversion efficiency of . It can be seen that the vast majority of the broad-line quasars (95%) are accreting at sub-Eddington rates. However, perhaps most interestingly, Panel B shows there to be a significant absence of quasars with black-hole masses accreting close to the Eddington limit. This result is consistent with the existence of a physical limit to the amount of gas which can be supplied to the central regions of quasars of yr-1.
4 The number density of black-holes at z=2

Using a sample of 372 quasars common to the SDSS DR1 and the 10K release of the 2dF quasar catalog (Croom et al. 2001) it was possible to accurately convert the SDSS luminosities into the absolute band magnitudes used in the derivation of the 2dF QSO luminosity function by Boyle et al. (2000). Using the 2dF QSO luminosity function to calculate the number densities of quasars brighter than a given absolute magnitude, it is then possible to use the SDSS black-hole masses to estimate the number density of active black-holes at a given redshift as a function of mass. The results of this calculation are shown in panel A of Fig 2. for a sub-sample of the SDSS quasars centred on . Comparison with the local dormant black-hole mass function (solid/dashed lines) shows an apparently increasing black-hole activation fraction of at rising to at . In panel B of Fig 2. the number density of all black-holes in place by has been estimated by correcting the number densities of panel A using the increasing relationship between quasar lifetime and black-hole mass predicted by Yu & Tremaine (2002). Finally, it can be seen from panel C of Fig 2. that, after a conservative correction of a factor of two to account for geometric obscuration, the direct implication of these results is that the fraction of black-holes with mass which are in place at is .
References
- [1] Boyle B.J., et al., MNRAS, 317, 1014 (2000)
- [2] Croom S.M., et al., MNRAS, 322, L29 (2001)
- [3] Kaspi S., et al., ApJ, 533, 631 (2000)
- [4] McLure R.J., Dunlop J.S., MNRAS, in press, astro-ph/0310267
- [5] McLure R.J., Jarvis M.J., MNRAS, 337, 109 (2002)
- [6] Netzer H., ApJ, 583, L5 (2002)
- [7] Schneider D.P., et al., AJ, 126, 2579 (2003)
- [8] Yu Q., Tremaine S., MNRAS, 335, 965 (2002)