The type IIn supernova 1994W: evidence for the explosive ejection of a circumstellar envelope
Abstract
We present and analyse spectra of the Type IIn supernova 1994W obtained between 18 and 203 days after explosion. During the luminous phase (first 100 days) the line profiles are composed of three major components: (i) narrow P-Cygni lines with the absorption minima at km s-1; (ii) broad emission lines with blue velocity at zero intensity km s-1; and (iii) broad, smooth wings extending out to at least km s-1, most apparent in H. These components are identified with an expanding circumstellar (CS) envelope, shocked cool gas in the forward post-shock region, and multiple Thomson scattering in the CS envelope, respectively. The absence of broad P-Cygni lines from the supernova (SN) is the result of the formation of an optically thick, cool, dense shell at the interface of the ejecta and the CS envelope. Models of the SN deceleration and Thomson scattering wings are used to recover the density ( cm-3), radial extent [ cm] and Thomson optical depth () of the CS envelope during the first month. The plateau-like SN light curve is reproduced by a hydrodynamical model and is found to be powered by a combination of internal energy leakage after the explosion of an extended pre-supernova ( cm) and subsequent luminosity from circumstellar interaction. The pre-explosion kinematics of the CS envelope is recovered, and is close to homologous expansion with outer velocity km s-1 and a kinematic age of yr. The high mass () and kinetic energy ( erg) of the CS envelope, combined with small age, strongly suggest that the CS envelope was explosively ejected yr prior to the SN explosion.
keywords:
supernovae – circumstellar matter – stars: supernovae: individual (SN 1994W)1 Introduction
Recent studies of supernovae (SNe) have made considerable progress in our knowledge of what makes a star explode. From observations of light curves and spectra, theories of pre-supernova evolution are now better constrained than ever. Conventional wisdom says that Type II SNe (SNe II) are caused by core collapse in massive, usually red supergiant stars. In general, theory has no trouble accounting for the main features of the spectra and light curves of these objects. However, some SNe II are remarkably different, and many of their observational properties are not yet understood.
These events, sometimes known as narrow-line Type II SNe or SNe IIn (Schlegel, 1990; Filippenko, 1997), show in early spectra the presence of strong, narrow Balmer emission lines on top of broad emission lines. Examples of prominent SNe IIn include 1978K (Ryder et al., 1993), SNe 1983K (Niemela, Ruiz & Phillips, 1985), 1984E (Dopita et al., 1984), 1986J (Rupen et al., 1987; Leibundgut, 1991), 1987F (Filippenko, 1989; Wegner & Swanson, 1994), 1988Z (Filippenko, 1991; Stathakis & Sadler, 1991; Turatto et al., 1993; Benetti et al., 1998), 1994W (Cumming, Lundqvist & Meikle 1994; Meikle et al. 1994; Sollerman, Cumming & Lundqvist 1998, hereafter SCL98), 1995G (Pastorello et al., 2002) and 1995N (Fransson et al., 2002). More recent examples of SNe II with narrow lines are SNe 1997cy (Germany et al., 1994; Turatto et al., 2000), 1998S (Filippenko & Moran, 1998; Bowen et al., 2000; Leonard et al., 2000; Fassia et al., 2001; Chugai et al., 2002; Fransson et al., 2004), 1999E (Filippenko, 2000; Rigon et al., 2003) and, most remarkably, SN 2002ic, which has been identified as a likely SN Ia in a dense circumstellar (CS) envelope (Hamuy et al., 2003), are more recent examples of SNe with narrow lines.
The general wisdom is that the narrow lines of SNe IIn originate from the ionized, dense circumstellar gas (Henry & Branch, 1987; Filippenko, 1991). The interaction of SN ejecta with the dense CS gas modifies the SN optical spectrum and may fully power the SN IIn luminosity (Chugai, 1990, 1992). Interaction with the dense CS gas is indicated also by strong radio and X-ray flux detected in some SNe IIn. SNe IIn are diverse (Filippenko, 1997), probably reflecting variations in CS gas density and structure (smooth vs. clumpy) and SN ejecta parameters (mass and energy). On top of this there is also the possibility of asymmetry of both the ejecta and CS gas. Nevertheless, the primary factors responsible for the diversity (mass of main-sequence star, explosion mechanism, structure of pre-supernova, mass-loss mechanism and history, and progenitor binarity) are still unknown. All these uncertainties, along with the possibility of using them to probe pre-supernova behaviour prior to core collapse, add to the interest in these phenomena.
SN 1994W, discovered on 1994 July 29 (UT dates are used throughout this paper) at the pre-maximum phase (Cortini & Villi, 1994), is among the brightest known SNe IIn. Its proximity (254 Mpc; SCL98) and early discovery made it an ideal case for detailed study. Preliminary interpretation of the spectra showed that SN 1994W exploded in the dense CS envelope with a characteristic radius of cm, while the amount of ejected 56Ni was low (; SCL98).
Here we further advance our understanding of both the CS envelope properties and the phenomenon of SN 1994W as a whole by analysing the spectra and photometry discussed by SCL98 as well as other, hitherto unpublished, spectra. In our study we take two different approaches to modelling the data. The first is the simulation of the H profile, which provides an efficient and straightforward probe of the Thomson optical depth and density of the CS envelope. The second approach is a hydrodynamical simulation of the SN explosion and the light curve based upon the upgraded version of the code stella (Blinnikov et al., 1998, 2000). An early version of this code proved effective in computing the hydrodynamics and light curve for interaction with a dense CS envelope in the case of SN 1979C (Blinnikov & Bartunov, 1993).
This paper has the following structure. We start with a description of the data (Sections 2 and 3) and the general picture which arises from a qualitative analysis (Section 4). Next we quantify parameters of the CS envelope using a thin-shell deceleration model and a line-profile simulation (Section 5). We then use the gross parameters of the recovered density distribution as input for detailed hydrodynamical modelling (Section 6). Our findings are summarized and discussed in Section 7.
2 Observations
2.1 Photometry
2.2 Spectroscopy
| Date | Phase(a) | Telescope/ | Spectral | Flux | Seeing | Wavelength | Observers |
|---|---|---|---|---|---|---|---|
| (UT) | spectrograph | res. (Å) | standard | (arcsec) | coverage (Å) | ||
| 1994 07 31.9 | 17.9 | BAO/BFOSC | 13 | BD+25∘3941 | 1.6 | 4600-7800 | AB |
| 1994 07 31.9 | 17.9 | INT/IDS | 0.25 | — | 2.6–3.0 | 6507–6675 | EZ |
| 1994 08 04 | 21.5 | Lick/Kast | 7 | BD+17∘4708 | 2.5 | 4250–7020 | AJB, AF, CP |
| 1994 08 13.9 | 30.9 | WHT/ISIS | 2.7 | SP1337+705 | 1.1–1.7 | 4290–8005 | MB |
| 1994 09 01 | 49.5 | Lick/Kast | 5 | BD+28∘4211, | 4+ | 3120–10400 | AJB, AF, TM |
| BD+26∘2606 | |||||||
| 1994 09 08.9 | 56.9 | WHT/ISIS | 11 | Grw+70∘5824 | 0.9–2.9 | 3300–9360 | RR |
| 1994 09 08.9 | 56.9 | WHT/ISIS | 2.7 | Grw+70∘5824 | 1.0–1.5 | 4255–5060, | RR |
| 6345–7150 | |||||||
| 1994 09 09 | 57.5 | Lick/Kast | 4 | BD+28∘4211, | 3–5 | 3140–9920 | AJB, AF, TM |
| BD+26∘2606, | |||||||
| BD+17∘4711 | |||||||
| 1994 10 01 | 79.5 | Lick/Kast | 4 | Feige 110, | 2–3 | 3130–8040 | AF, LH, TM |
| BD+26∘2606 | |||||||
| 1994 10 11 | 89.5 | Lick/Kast | 4 | Feige 110, | 3–4 | 3160–8020 | AF, TM |
| BD+26∘2606 | |||||||
| 1994 11 12.3 | 121.3 | INT/IDS | 6 | — | 1.6 | 5485-7370 | RR, NO |
| 1995 01 26.6 | 196.6 | Keck/LRIS | 6 | HD 19445 | 1.2 | 5628–6939 | AF, LH |
| 1995 02 01.9 | 202.9 | NOT/LDS | 12 | Feige 34 | 0.9 | 5000-10000 | JS, RC |
Note: (a) Days after 1994 July 14.0. (b) Observers: AB – A. Bragaglia; AF – A. Filippenko; AJB – A. J. Barth; CP – C. Peng; EZ – E. Zuiderwijk; JS – J. Sollerman; LH – L. Ho; MB – M. Breare; NO – N. O’Mahony; TM – T. Matheson; RC – R. Cumming; RR – R. Rutten.


The spectroscopic observations are described in Table 1. Some of these, taken from La Palma, were presented in Table 2 of SCL98. We supplement them with spectra taken at the Lick, Keck, and Bologna Observatories. The data cover epochs 18–203 days after explosion. We now describe these spectra in detail.
The La Palma spectra were reduced using the figaro (Shortridge, 1990) and NOAO iraf111IRAF (Image Reduction and Analysis Facility) is distributed by the National Optical Astronomy Observatories, which are operated by the Association of Universities for Research in Astronomy, Inc., under cooperative agreement with the US National Science Foundation. packages. The CCD frames were bias-subtracted, flat-fielded, and corrected for distortion and cosmic rays. Wavelength calibration was carried out using arc spectra of copper-neon and copper-argon lamps, and should be accurate to better than 0.1 Å for the high-resolution WHT and INT spectra, 0.5 Å for the low-resolution WHT and INT spectra, and 1 Å for the NOT spectrum.
The Bologna spectrum was obtained with the Bologna Astronomical Observatory 1.5-m telescope with the spectrograph BFOSC on 1994 July 31.9 and reported by Bragaglia et al. (1994).
Spectra were also obtained at the Shane 3 m reflector at Lick Observatory on days 21, 49, 57, 79 and 89, and at the W. M. Keck II 10 m telescope on day 197. The Lick observations were made with the Kast double spectrograph (Miller & Stone, 1993). The Keck spectrum was obtained using the Low Resolution Imaging Spectrometer (LRIS; (Oke et al., 1993)) with a 1200 lines mm-1 grating. For details, see Table 1.
For the Lick data, all one-dimensional sky-subtracted spectra were extracted in the usual manner, and each spectrum was then wavelength and flux calibrated, as well as corrected for continuum atmospheric extinction and telluric absorption bands (Wade & Horne, 1988; Bessell, 1999; Matheson et al., 2000).
The spectra were flux-calibrated by comparison with the standard stars listed in Table 1. The sky position of SN 1994W in late 1994 meant that the observations were made when the supernova was at rather low altitude, and correspondingly high airmass. We corrected for the difference in atmospheric extinction brought about by the differing zenith distances of the supernova and the standard star. Airmasses at different zenith distances were taken from the relation given by Murray (1983), and we used the tables of extinction coefficient versus wavelength for La Palma given by King (1985).
With two exceptions, all our spectra were taken at the parallactic angle (Filippenko, 1982), minimising slit losses due to atmospheric dispersion. The first exception was the day 18 Bologna spectrum of SN 1994W, which shows considerable loss of flux in the blue. We corrected the slope of the spectrum to match the and photometry from the same night reported by Bragaglia et al. (1994) using filter functions from Gualandi & Merighi (2001).
The second exception was the standard-star observation for the day 31 La Palma spectrum. While the SN 1994W spectrum was taken at the parallactic angle, the standard-star spectrum was taken at an airmass of 1.6, with the slit at position angle 33∘ when the parallactic angle was 119∘. No contemporary filter photometry is available for correcting the supernova spectrum. The effect on the day 31 supernova spectrum depends on how the standard star was positioned in the slit, which in turn depends on the combination of the spectral response of the acquisition camera at the telescope. The acquisition camera at the WHT in 1994 August was a Westinghouse ETV-1625 whose response curve peaked at 4400 Å, with half-power points at 3400 Å and 6200 Å (C. Jackman & D. Lennon, 2004, private communication). The standard star, Grw +70∘5824, is a DA3 white dwarf with a blue spectrum. It therefore seems likely that the slit was positioned so that maximum transmission was at around 4400 Å, at the blue end of the spectrum.
We have estimated the amount of flux that would be lost with wavelength, and find that the losses would largely have been at the red end of the standard spectrum — as much as 80 per cent of the flux at 8000 Å. The effect on the calibrated supernova spectrum was thus to make it appear redder than it really was. Since the day 31 spectrum is already remarkably blue (Section 3.1.3), we have made no further correction to the spectrum; the calibration can be regarded as a conservative estimate of the already extreme continuum slope.
No observations of flux standards were available for the INT spectra taken on days 18 and 121. A very rough flux-calibration of the day 18 INT spectrum was made by assuming that the flux in the wings of the H line (at the red and blue edges of the spectrum) declined at the same rate as the visual magnitude estimates between days 18 and 31, i.e., by a factor of about 1.6 in . A similarly rough calibration of the day 121 spectrum was made by comparing with our -band photometry from day 123 (SCL98).
The spectrum taken on day 197 was scaled so that the flux in the narrow H feature matched that in the day 203 spectrum. The continua then match well in the overlap region.
Spectra from days 18, 57, 121 and 203 were displayed in SCL98 (their Figs. 2 and 3). They also showed the portion of the spectrum on day 31 covering H.
As a final correction, we noted that all the spectra cover the entire band, and we scaled each spectrum to match contemporary -band photometry. The procedure was as follows. We assumed that the day 57 La Palma spectrum was correct. Next, we interpolated the magnitudes in the light curve presented by SCL98. This gave us relative fluxes in for all the epochs. We then integrated all the plateau spectra (days 21–89), multiplying them by a standard filter function (Allen, 1973) with transmission values interpolated between points at 100-Å intervals. The whole spectrum was then scaled linearly in flux so that the integrated magnitude corresponded to the -band photometry in SCL98.
3 Results
During the period of our observations, the spectrum of SN 1994W (Figs. 1 and 2) was dominated by narrow Balmer emission lines, initially with P-Cygni absorption features, and accompanied by a wide variety of weaker lines showing broad emission and/or narrow P-Cygni profiles (cf. Filippenko & Barth, 1994). Line identifications are presented in Table 2 and in Fig. 3. In the following sections, we examine the spectral development for each epoch in turn, and then concentrate on the individual features and ionic species.
In this section, quoted line fluxes (see Table 3) were measured by interpolating the neighbouring continuum across the line in question. The line fluxes are net fluxes and do not correct for the narrow P-Cygni absorption components.

| Identification | 18 | 21 | 31 | 49 | 57 | 79 | 89 | 121 | Identification | 18 | 21 | 31 | 49 | 57 | 79 | 89 | 121 |
|---|---|---|---|---|---|---|---|---|---|---|---|---|---|---|---|---|---|
| Fe ii 3764.11 | Sc ii 5657.90 | ||||||||||||||||
| +H11 3770.63 | p | p | – | – | +Sc ii 5658.36 | – | – | – | – | – | a | a | |||||
| H10 3797.90 | p | p | p | p | He i 5875.61 | – | b | pb | b: | b: | – | – | – | ||||
| H9 3835.38 | p | p | p | p | Na i 5889.95 | ||||||||||||
| Mg ii 3849.3 | p | p | – | – | +Na i 5895.92 | – | b: | b: | ba: | ba: | p | p | ep: | ||||
| H8 3889.05 | p | p | p | p | Fe ii] 5990.60 | ||||||||||||
| Fe ii 3914.51 | – | – | p | p | +Fe ii] 5991.38 | – | – | – | – | – | ep | ep | – | ||||
| Ca ii 3933.66 | p | p | p | p | Fe ii] 6150.10 | – | – | – | – | p | p | p | – | ||||
| Ca ii 3968.47 | Sc ii 6245.63 | ||||||||||||||||
| + H 3970.07 | pb | pb | pb | pb | +Fe ii 6247.58 | – | – | – | pb | pb | pb | pb | – | ||||
| H 4101.73 | pb | pb | pb | pb | Si ii 6347.11 | – | p | p | p | p | p | p | – | ||||
| Fe ii 4233.12 | – | – | – | p | p | p | p | Si ii 6371.37 | – | p | p | p | p | p | p | – | |
| Fe ii 4296.57 | Fe ii 6416.91 | – | – | – | – | p | p | p | – | ||||||||
| +Fe ii 4303.17 | – | – | – | – | p | p | p | Fe ii 6456.38 | – | – | – | – | p | p | p | – | |
| H 4340.46 | – | pb | pb | pb | pb | pb | pb | Fe ii 6517.02 | – | – | – | – | p | p | p | – | |
| Fe ii 4351.76 | – | – | – | – | p | p | p | H 6562.80 | pb | pb | pb | pb | pb | pb | pb | e | |
| Fe ii 4385.38 | – | – | – | p | p | – | – | He i 6678.15 | – | p: | pb | – | – | – | – | – | |
| Fe ii 4416.83 | – | – | – | p | p | p | p | O i 7002.20 | – | – | – | – | – | p | p | – | |
| He i 4471.5 | – | – | ba | – | – | – | He i 7065.22 | – | b | b | – | – | – | – | |||
| Mg ii 4481.2 | – | p | p | p | p | – | – | [Fe ii] 7214.71 | – | – | – | – | p | p | – | ||
| Fe ii 4520.21 | – | – | – | p | p | – | – | Ca ii] 7291.47 | – | – | – | – | – | – | e | ||
| Fe ii 4549.46 | Fe ii 7308.07 | ||||||||||||||||
| +Fe ii 4555.88 | – | p | p | p | p | p | p | +Fe ii 7310.22 | – | – | – | – | p | p | – | ||
| Fe ii 4576.34 | Ca ii] 7323.89 | – | – | – | – | – | – | e | |||||||||
| +Fe ii 4582.83 | – | p | p | p | p | p | p | Fe ii 7449.34 | – | – | – | – | p | p | |||
| Fe ii 4629.34 | – | p | – | p | p | p | p | Fe ii 7462.41 | – | – | – | – | p | p | |||
| H 4861.32 | pb | pb | pb | pb | pb | pb | pb | Fe ii 7711.72 | – | p | p | p | p | ||||
| Fe ii 4923.94 | p: | pb | pb | pb | pb | pb | pb | O i 7773.8 | p | p | p | p | p | p | |||
| Fe ii 5018.44 | p: | pb | pb | pb | pb | pb | pb | Mg ii 7877-96 | b | b | b | – | – | ||||
| Fe ii 5169.05 | – | p | p | p | p | p | p | Mg ii 8213.98 | |||||||||
| Fe ii 5197.59 | – | p | p | p | p | p | +Mg ii 8234.64 | b: | b: | – | |||||||
| Fe ii 5234.63 | O i 8446.36 | p | p | p | |||||||||||||
| +Sc ii 5239.81 | – | – | – | – | p | p | p | Ca ii 8498.03 | – | – | p | ||||||
| Fe ii 5264-84 | – | p | – | p | p | p | p | Ca ii 8542.09 | p | p | p | ||||||
| Fe ii 5316.62 | Ca ii 8662.14 | – | p | p | |||||||||||||
| +Fe ii 5325.54 | – | p | p | p | p | p | p | Mg ii 9218.25 | |||||||||
| Fe ii 5362.85 | – | – | – | – | p | p | p | +Pa9 9229.01 | |||||||||
| Fe ii 5425.26 | – | – | – | – | pe | pe | pe | +Mg ii 9244.26 | b | b | b | ||||||
| Fe ii 5477.66 | – | – | – | – | – | p | p | Pa 9545.97 | pb: | pb: | pb: | ||||||
| Sc ii 5526.79 | – | – | – | – | pb | pb | pb | p: | Pa 10049.4 | ||||||||
| +Mg ii 10092.1 | b: |
3.1 Spectral evolution
3.1.1 Day 18
The low-resolution Bologna spectrum showed a blue continuum with prominent lines of H and H, which are narrow with broad wings. The latter have been interpreted as an effect of multiple Thomson scattering of line photons in the CS envelope (Chugai, 2001). Our high-resolution spectrum for this epoch (Fig. 3 in SCL98) covers only the H line, but shows a narrow P-Cygni absorption at about 800 km s-1 not visible in the low-resolution spectrum. The emission peak is close to the velocity of nearby H ii emission, measured at 12493 km s-1, which we adopt as our best estimate of the heliocentric velocity of the supernova. The interstellar Na i D lines give a somewhat lower value, 118515 km s-1, measured from the day 31 spectrum.
3.1.2 Day 21
The rapid brightening of the supernova at this epoch (SCL98) was reflected in increasingly strong Balmer lines. The spectrum showed a strong blue continuum, and prominent lines of H, H and H, all exhibiting narrow P-Cygni profiles with broad emission wings. The Balmer decrement was remarkably shallow, with flux ratio H:H:H = 1.1:1:0.5 (dereddened assuming mag from SCL98 and the reddening law of Cardelli, Clayton & Mathis 1989). The Balmer lines were accompanied by an asymmetric triangular broad emission feature corresponding to He i , possibly blended with the Na i D doublet, and many narrow P-Cygni lines of Fe ii.
3.1.3 Day 31
By day 31, the blue continuum appeared to have steepened. The calibration of the spectrum is uncertain, as noted in Section 2 above, but the evidence suggests that the spectrum really was as remarkably blue as it appears to be. The Balmer lines still show a flat decrement, as on day 21, with measured ratios 1.2:1:0.6. The blue wings in H and H appear to be stronger relative to the red wings, compared to day 21 (Fig. 5, right-hand panel).
Broad, triangular He i emission lines with full-width at half-maximum velocity width () around 2500 km s-1 were stronger than on day 21 (Figs. 2 and 5). He i was accompanied by strong He i . Broad He i appeared to fill out the red wing of H, and the triplet line at is present as broad emission which underlies neighbouring Fe ii lines. All but He i also showed weak, narrow P-Cygni features with minima around 700 km s-1.
A similarly triangular emission feature is seen at 7890 Å, which we identify with the Mg ii triplet at 7877–7896 Å (see Section 3.3.4).
Stronger narrow P-Cygni lines with absorptions around 600 km s-1 are seen in O i , Si ii , 6371, and a large number of Fe ii lines. The O i and Si ii lines are dominated by absorption, while in Fe ii the equivalent widths of the absorption and emission components are comparable.

3.1.4 Day 49
The day 49 spectrum (Figs. 1, 2 and 3) shows a redder continuum. The Balmer decrement steepened to 1.5:1:0.6. The He i and Na i D blend was again asymmetric as on day 21, and appeared to have a broader blue wing. The only other remaining He i line, , is no longer as prominent as on day 31. The Mg ii 7877–7896 feature was still clearly visible. Similar broad features were detected at 8230 Å and 9220 Å, lending support to the identification with Mg ii.
Many new Fe ii lines are apparent, plus Ca ii H & K and possibly the Ti ii multiplet at around 3500 Å. The wider wavelength coverage picked up a large number of overlapping narrow P-Cygni lines in the blue; most of the identified ones are H i and Fe ii.
3.1.5 Day 57
Eight days later, the Balmer decrement showed no significant change at 1.5:1:0.6. The spectrum showed ever stronger Fe ii lines. No unambiguous trace of He i remained (Fig. 2), suggesting that the emission feature at 6000 Å was now only due to Na i D. The emission in this feature broadened and flattened out, extending from 4000 km s-1 to +6000 km s-1 (Figs. 2 and 5). The Mg ii 7877–7896 feature was still present, but appeared more flat-topped than on day 49. P-Cygni lines of O i 8446 and the Ca ii near-infrared triplet, also weakly present on day 49, were clearly detected in the red.
3.1.6 Day 79
The continuum appeared again to have reddened (Fig. 1). The Balmer lines decreased in strength relative to the now very numerous Fe ii P-Cygni lines (Figs. 2 and 3). The H/H ratio was now , close to Case B. Narrow overlapping absorption and P-Cygni features completely dominated in the blue. In the red, the feature at 7890 Å had disappeared, but O i 8446 and the Ca ii triplet had increased in strength. The narrow absorption in Na i D had increased markedly in strength since day 57, and broad Na i emission was no longer apparent.
Narrow P-Cygni profiles of O i 7002 and Sc ii appeared, the latter possibly accompanied by a broad emission component. Semi-forbidden lines of Fe ii] 5991, 6150 were clearly detected for the first time.
3.1.7 Day 89
The spectrum on day 89 was essentially the same as on day 79, but was weaker and showed a redder continuum. The H/H ratio increased to , and H was now blended with Fe ii lines. Both Na i D and O i 7002 continued to increase in strength.
3.1.8 Day 121
Our spectrum for day 121 (Figs. 1 and 2) has smaller wavelength coverage and rather poor signal-to-noise ratio, but it is obvious that a dramatic change had occurred since day 89, paralleling the supernova’s precipitous fading after day 110 (SCL98).
As reported by SCL98, three narrow emission lines are unambiguously detected: H with a of 780 km s-1, plus much fainter Na i D () with a P-Cygni absorption component, and Ca ii] 7291 () close to the red edge of the spectrum. The emission peak of H had moved farther to the red than on day 89, at about +70100 km s-1. The Sc ii P-Cygni feature at 5530 Å appears also to have survived since day 89, showing a sharp absorption feature at km s-1.
Underlying the narrow features is what appears to be a low, undulating continuum. SCL98 argued that the sharp drop to zero flux at 5620 Å was evidence that the continuum was rather composed of broad, overlapping emission lines. The steepness of the drop at 5620 Å indicates that the velocity widths of such lines can be no greater than 5000 km s-1. Similar features have been seen in late-time spectra of the SN IIn 1997cy (Germany et al., 1994; Turatto et al., 2000). A sharp drop at this wavelength is in fact also typical of SNe Ia and some SNe Ib/Ic at late times, when the emission is dominated by lines of Fe ii and [Fe ii] (see Axelrod, 1980). These similarities suggest that SN 1994W had reached its nebular phase at this epoch.
3.1.9 Day 197
Our spectrum, not shown in Figs. 1 and 2, detected only H, which was perhaps just resolved. Its velocity width was km s-1, consistent with no change since day 121. Na i emission at the same strength relative to H as on day 121 would not have been detected, given the low signal-to-noise ratio of the spectrum.
3.1.10 Day 203
The day 203 spectrum (Fig. 1) confirms that narrow, unresolved H is the only detectable feature from the supernova. The galaxy background probably dominates the remaining, noisy continuum, though photometry indicates that the supernova can account for up to 50 per cent of the flux (SCL98). SCL98 put limits on the flux in broad lines of width 4500 km s-1.
3.2 General spectral appearance
3.2.1 Line profiles
The spectra reveal two major types of line profile-forming components (SCL98; Fig. 5): narrow P Cygni profiles and broad lines. However, careful inspection reveals that while the blue velocity at zero intensity (BVZI) of the broad lines does not exceed km s-1, H at the luminous stage shows a red wing extending at least up to +7000 km s-1. This wing is clearly detectable in H on days 31, 49 and 57 (Figs. 2 and 5). We believe that this wing is caused by a Thomson scattering effect in the expanding CS envelope (see also Section 4). Since the intensity of the Thomson scattering wing is proportional to the line intensity, the wing may be present but not obvious in other, weaker lines.
The intrinsically broad lines typically have a triangular profile. On day 31 they show an apparent skewing toward the blue, possibly due to an occultation effect. The Na i doublet on day 57 shows a flat-topped profile with BVZI km s-1. No other line shows such a flat-topped profile, nor does Na i doublet at other epochs, though the feature is dominated by He i earlier than this. This suggests that the material emitting Na i has a narrower distribution of velocity than the other broad lines (see Section 4.2).
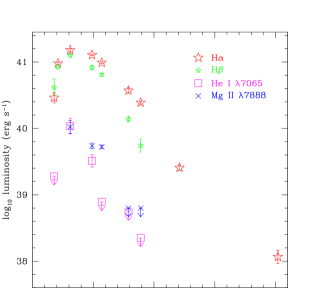
3.2.2 Line strengths
Assuming a distance of 25.4 Mpc to NGC 4041 and mag (SCL98), we have plotted the luminosity evolution of the strongest emission lines in Fig. 4. Note the quasi-exponential decline of the H luminosity with exponential lifetime days. This fast decline is in dramatic contrast to other SNe IIn, for example SN 1995G, whose narrow H luminosity dropped by only a factor of three during the first 600 days (Pastorello et al., 2002). The fast decay of the H luminosity is consistent with a small amount of 56Ni in SN 1994W (SCL98) and also indicates the absence of dense CS gas at large distances from the pre-supernova (see Section 7).
| Day | |||||||||
|---|---|---|---|---|---|---|---|---|---|
| Line | 18 | 21 | 31 | 49 | 57 | 79 | 89 | 121 | 203 |
| H 4340.46 | — | 30(2) | 47(4) | 34(1.5) | 24.5(2) | — | — | — | — |
| H 4861.32 | 30(10) | 61(3) | 91(5) | 60(5) | 47(2) | 10(1) | 4(1) | — | — |
| Fe ii 5018.44 | — | 1.7(0.1) | 0.7(0.1) | 2.1(0.5) | 2.7(0.7) | 2.0(0.7) | 1.6(0.2) | — | — |
| He i 5875.62 | |||||||||
| +Na i(a) 5889-95 | — | 13.6(2) | 14(4) | 12(1) | 5(1) | 1 | 1 | — | — |
| Na i(b) 5889-95 | — | — | — | — | 0.14(0.05) | 0.2(0.02) | 0.6(0.1) | 0.11(0.03) | 0.03 |
| H 6562.80 | 25(5) | 82(3) | 130(6) | 110(2) | 84(2) | 32(3) | 21(1) | 2.2(0.2) | 0.1(0.025) |
| He i 7065.22 | 2 | — | 9.7(3) | 2.9(0.7) | 0.7 | 0.5 | 0.2 | — | — |
| Mg ii(a) 7877-7896 | — | — | 10(2.5) | 5.2(0.5) | 5.0(0.3) | 0.6 | 0.6 | — | — |
| Mg ii 9218-44 | — | — | — | — | 6.3(1) | 7.5(0.8) | 1.0(0.3) | — | — |
Notes: (a) blend, (b) emission
component only.
Error estimates are 1. Upper limits are 3.
3.2.3 Continuum
We carried out black-body fits to the continuum. We obtain colour temperatures of K on day 21, 15000 K on day 31, 10000 K on days 49 and 57, 7200 K on day 79 and 7200 K on day 89. We find that the black-body fits work best for mag, consistent with our estimate from Na i absorption ( mag; SCL98).
3.3 Elements identified
3.3.1 Hydrogen
We detect the Balmer series from H to at least H11, and possibly also members of the Paschen series from Pa to Pa11 (Fig. 3). The profiles seem to be a combination of broad emission line with km s-1 and a narrow P-Cygni absorption component ( km s-1). The ratio of narrow-to-broad emission component decreases from H toward the higher Balmer lines. This indicates a nearly normal Balmer decrement for the narrow component and a flat or possibly inverse Balmer decrement for the broad component (Fig. 5).
A flat or inverted decrement suggests strong deviation from the recombination case, related to collisions and radiative transitions in the field of the photospheric radiation. The observed line ratios suggest an excitation temperature for hydrogen’s excited levels of around 15000 K. Two different thermalization mechanisms for hydrogen levels may operate in this situation: the level populations may be controlled by radiative transitions in the field of the external black-body photospheric radiation, or thermalization may be primarily collisional. Both mechanisms have been exploited to account for flat or inverted Balmer decrements observed in cataclysmic variables (Elitzur et al., 1983; Williams & Shipman, 1988). Both thermalization mechanisms are plausible in SN 1994W as well.
3.3.2 Helium
We observe broad He i lines with triangular emission profiles and narrow P-Cygni features. The He i lines disappear after day 49 (Figs. 2 and 4; Table 2). He i 5876 and 7065 appear only in emission. He i 4471 and 6678 show weak absorption features. A high ratio indicates a large contribution of collisional and/or radiative excitation compared to the purely recombination case. Unfortunately, this fact cannot be used as a straightforward indicator of electron concentration in the line-emitting region. Computations for an extended parameter set (Almog & Netzer, 1989) show that this particular ratio may be reached in a wide range of concentrations ( cm-3), with pronounced dependence on the optical depth in He i 3889.
3.3.3 Oxygen
O i is present with an absorption-dominated P-Cygni profile from as early as day 18 to day 89. From day 79, we tentatively identify O i with a P-Cygni profile. This line has not to our knowledge been seen in a supernova spectrum before, but was identified in the proto-planetary nebula Henize 401 (García-Lario, Riera & Manchado, 1999), whose low-ionization spectrum bears some similarity to that of SN 1994W at these phases.
3.3.4 Other metals
Ca ii H & K were strong in absorption at all epochs when we covered them. The near-infrared triplet lines were weak on day 49, but strengthened dramatically by day 79 (Fig. 3). This may reflect an increase in the Ca ii/Ca iii ratio with the drop in radiation temperature at late epochs.
The Na i D doublet’s development is remarkable (Figs. 1, 2 and 5), even taking into account blending with interstellar absorption and in the earlier spectra with He i . Up to day 49, a flat-topped profile emerged as He i faded. From day 57 on, the strength of the circumstellar P-Cygni absorption increased, presumably as a result of increasing Na i ionization fraction.
Magnesium lines appear both in absorption and emission. Narrow absorption with weak P-Cygni emission is seen in Mg ii from day 21 to day 57. We identify Mg ii 7877–7896 as the source of the broad feature around 7890 Å. As an alternative interpretation, we considered [Fe xi] 7892. Strong [Fe xi] might be expected to be accompanied by emission in [Fe x] , and there may indeed be a broad feature underlying the Si ii absorption lines to the blue of H. However, this feature does not persist to later epochs as the 7890 Å feature does, nor are any other high-ionization lines identified at any epoch. In addition, emission lines with similar widths to the 7890 Å feature are seen at wavelengths corresponding to Mg ii transitions around 9230 Å, and possibly at 8200 Å and 10900 Å. Nevertheless, we find it somewhat surprising that the broad emission in Mg ii 7877–7896 is not accompanied by similar emission in O i 7773.
The doublet of Si ii 6347, 6371 is present from days 21 to 89, showing absorption-dominated P-Cygni profiles. The lines weakened relative to other features on days 79 and 89. Si ii therefore seems to be an unlikely contributor to the feature at 6260 Å (see below), which increases on these dates.
Sc ii emission lines at around 5530 Å and 6250 Å were identified by Pastorello et al. (2002) in the spectrum of the Type IIn SN 1995G. We identify both Sc ii and in our spectra, and Sc ii may contribute to the feature at 6260 Å. In particular, shows some evidence of a broad emission component (Figs. 2 and 3). Its narrow P-Cygni core apparently persisted until day 121.
We identify a host of Fe ii lines (Fig. 3; Table 2), all of which show narrow P-Cygni profiles. They may also be accompanied by broad emission as in the case of other species, since the spectra show hints of underlying broad emission in regions of the spectrum where there are many Fe ii lines (Fig. 1). By days 79 and 89, a few lines of forbidden and semi-forbidden Fe ii are identified. These have emission-dominated P-Cygni profiles (Fig. 3).
4 General picture
The previous discussion of spectroscopic and photometric data on SN 1994W (SCL98) led to the conclusion that the narrow lines originate in a dense CS envelope. However, at present, the spectroscopic and photometric results cannot readily be incorporated into any existing model of a SN II interacting with a CS environment. We therefore present first our qualitative view of what we observe in the case of SN 1994W. We emphasize some basic elements of the physical picture that, in our opinion, are crucial for understanding the phenomenon.
4.1 The opaque cool dense shell
The smooth continuum of SN 1994W and its lack of broad absorption lines is typical of most SNe IIn at an early phase. It is also reminiscent of the early spectrum of SN 1998S (Leonard et al., 2000). For SN 1998S, the smooth continuum and the absence of broad absorption lines was explained as an effect of an opaque cool dense shell (CDS) which formed at the interface of the SN with its circumstellar medium (Chugai, 2001). In this situation, an opaque CDS is physically equivalent to an expanding photosphere with a sharp boundary and without an external, extended SN atmosphere. In comparison, the CDS formed in supernova remnants during the radiative stage (Pikelner, 1954) and in SNe interacting with a moderately dense CS wind (Chevalier & Fransson, 1985) are optically thin in the continuum.
The large optical depth of the CDS requires a relatively large swept-up mass. This may be a natural consequence of shock break-out in SNe II with extended stellar envelopes (Grasberg et al., 1971; Falk & Arnett, 1977; Blinnikov & Bartunov, 1993) and/or with extended CS envelopes of unusually high density. In the model of a pre-supernova with initial radius cm (Falk & Arnett, 1977), a CDS with a mass of forms and remains opaque for about 70 days. We propose that a similar opaque CDS formed in SN 1994W. This suggestion finds support in the exceptionally bright peak of the light curve, mag (SCL98, their Fig. 5). According to the theory of SN II light curves, a broad luminous maximum with mag requires the explosion of a very extended pre-supernova with an envelope radius of cm (Grasberg et al., 1971; Falk & Arnett, 1977).
4.2 The broad-line region
The deceleration of the CDS in the extended pre-supernova envelope and in the dense CS environment is accompanied by the Rayleigh-Taylor (RT) instability (Falk & Arnett, 1977; Chevalier, 1982). The growth and subsequent fragmentation of RT spikes in the dense CDS material results in the formation of a narrow layer () composed of dense filaments, sheets and knots embedded in the rarefied hot gas behind the forward shock (Chevalier & Blondin, 1995; Blondin & Ellison, 2001). This mixed layer on top of the CDS is likely responsible for the broad emission lines observed in SN 1994W. If this is the case, then the expansion velocity of the CDS () should be the same as the velocity of the broad line-emitting gas, i.e., km s-1.
A drawback of this picture of the broad-line formation is that the velocity distribution of the line-emitting gas peaks at the CDS expansion velocity , which means the expected line profile should be boxy. With the exception of the Na i profile on day 57, the broad lines are instead triangular.
A triangular profile can be produced, however, if the spherically symmetric velocity distribution of the line-emitting matter is close to . Actually, given this mass-velocity spectrum and constant emissivity per unit mass, and assuming that the velocity field is spherically symmetric, the luminosity distribution over the radial velocity (in units of ) is
| (1) |
which is indeed triangular.
The broad velocity spectrum of the dense gas in the mixed layer may naturally arise in two plausible scenarios. In the first scenario the CS gas is clumpy. In this case, an ensemble of dense CS clouds engulfed by the forward post-shock gas could provide a broad velocity spectrum of radiative cloud shocks and cloud fragments (Chugai, 1997) in the range of 1000–4000 km s-1, where the lower limit is the CS velocity. This model may be characterized as low-velocity clouds in a high-velocity flow.
Alternatively, dense high-velocity clumps interacting with the low-velocity CS gas could produce a similar spectrum of fragments. This could occur if the forward shock is radiative, forming a thin post-shock layer with . In this situation, dense RT spikes, formed at the previous stage of RT instability of the CDS, can penetrate into the pre-shock zone. The interaction of these protrusions with the CS gas in the pre-shock zone leads to further fragmentation and deceleration of fragments down to the velocity of the CS gas. As a result, a broad velocity spectrum of dense cool fragments emerges in the velocity range of 1000–4000 km s-1.
For this second possibility to hold, a high CS density is needed to maintain the narrow width of the post-shock cooling region,
| (2) |
where is the proton mass, and is the cooling function in the post-shock zone. To reach the required ratio at radius cm, one needs a CS density of cm-3 assuming erg s-1 cm6 and km s-1.
Both scenarios for the velocity spectrum leave open the question of why the velocity distribution of the line-emitting gas in the mixed layer is close to . The following naive model seems to provide a hint.
Let us consider the interaction of a high-velocity fragment with the CS gas. In the rest frame of the initial fragment, the fragmentation process in the rarefied CS flow with the velocity may be thought of as a stripping flow with accelerating velocity and in which the “radius” of fragments progressively decreases as the velocity increases (Klein, McKee & Colella, 1994). Assuming mass conservation of fragments in velocity space, , the mass-velocity spectrum of fragments may be expressed as
| (3) |
which is essentially determined by the acceleration . The latter can be approximately described as acceleration due to the drag force
| (4) |
where the velocity is in units of , is the mass of fragment of the density , and is the density in the rarefied ambient flow. To determine the acceleration we must specify the relation between fragment size and velocity relative to the CS gas. We assume that the fragment size for each new generation of cloudlets is tuned to the Kolmogorov turbulent cascade with spectrum . With this relation, equation (4) leads to . The latter combined with equation (3) leads to a mass-velocity spectrum .
A similar analysis carried out for the case of a CS cloud in the SN flow produces a quite different mass-velocity spectrum, . This spectrum also results in a broad line but with zero slope at and a narrow logarithmic peak: . While this profile resembles the observed H profile, it is at odds with the triangular profile of He i lines. Below (Section 5.4) we argue against a large contribution of CS clouds in the formation of H.

4.3 The circumstellar envelope
4.3.1 Expansion kinematics
The radial velocities of narrow absorption features in SN 1994W are strikingly persistent between days 18 and 89. This implies that the expansion velocity of the CS envelope ( km s-1) has a pre-explosion origin. An alternative possibility — acceleration of a slow wind by SN radiation (see also SCL98) — seems unlikely, since it would require unrealistic fine tuning between the time-dependent luminosity and absorption (scattering) coefficient to arrange the persistence of the velocity of accelerated gas.
Two extreme options are conceivable for the CS envelope’s pre-explosion kinematics: constant-velocity flow and homologous expansion (). The former might be the result of either continuous wind outflow or a succession of ejection events with similar ejecta velocities. Homologous expansion, on the other hand, might be produced by a single explosive ejection. The latter mechanism, though exotic, was in fact proposed by Grasberg & Nadyozhin (1986) to account for the narrow CS lines in SN 1983K.
4.3.2 Envelope size
The light curve of SN 1994W is characterized by a broad maximum around day 30 and a subsequent plateau, terminated by a sudden drop in luminosity at d (SCL98, their Fig. 5). Assuming a CDS expansion velocity of km s-1, we find that during this period the CDS sweeps up the CS gas within the radius cm. Although this estimate refers to d, we adopt it as a rough estimate for earlier epochs as well.
We now argue that this radius should coincide with the outer radius of the dense CS envelope, . If instead , then the light curve of SN 1994W should not have shown such a steep drop, since the CS interaction would have augmented the luminosity at the luminosity decay phase. Equally, if , the narrow lines would have disappeared at epoch , which was not observed. These arguments, therefore, provide strong evidence that the extent of the dense CS envelope is cm. Beyond this radius, the CS density presumably drops steeply, as indicated both by the broad-band light drop after day 100 and the fast decline of the H luminosity (Fig. 4). At larger radii, X-ray observations suggest that other density enhancements may be present (Section 7; Schlegel 1999).
4.3.3 Electron-scattering wings and circumstellar density
We attribute the extended smooth wings observed in H and H between days 18 and 89 to the effect of Thomson scattering on thermal electrons participating in the bulk expansion of the CS envelope (Chugai, 2001). Based on previous computations of Thomson scattering effects in SN 1998S, and the strength of the H wings in SN 1994W on day 57 (when blending with He i 6678 was negligible), we believe that the optical depth of the CS envelope to Thomson scattering () at this stage must have been close to unity.
Adopting a photospheric radius cm on day 57 (where km s-1) and an outer radius of the CS envelope cm, we obtain an estimate of the average electron concentration in the CS envelope assuming :
| (5) |
This value, taken together with the forward shock-wave velocity ( km s-1), after correction for the CS velocity, provides an estimate of the density of the CDS material in the broad-line region (). The pressure equilibrium condition, with sound speed in the CDS matter of km s-1, results in cm-3. This tremendous density provides a natural reason for the strong collisional thermalization of the broad component indicated by the observed inverse Balmer decrement (Section 3.3.1).
4.3.4 Circumstellar density from narrow lines
The strength of narrow subordinate lines indicates a high density in the CS envelope, as noted by SCL98. The simplest density estimate may be taken from the condition that the optical depth in a line of Fe ii, for example 5018, is on the order of unity. This follows from the relative intensity of the absorption component of this line (. Assuming that level populations of Fe ii obey the Boltzmann distribution for K, one obtains for solar Fe/H a hydrogen concentration of cm-3. Here is the linear scale of the line-forming zone in units of cm, is the velocity dispersion in units of cm s-1, and is the ionization fraction of Fe ii. Given the scale of the CS envelope ( cm), we thus have a lower limit cm-3. This lower limit should be considered as a revised version of the estimate reported in SCL98.
A somewhat more elaborate estimate of the density may be obtained using several different lines and assuming a quasi-local thermodynamic equilibrium (quasi-LTE) approximation, i.e., the Saha-Boltzmann equations corrected for both geometrical dilution and dilution of the photospheric brightness . The latter defines the photospheric brightness through the black-body brightness . We adopt a simple density distribution in the CS envelope: a plateau with a steep outer drop
| (6) |
where the cutoff radius cm. We consider two cases for the CS kinematics: free expansion (), with outer velocity at cm equal to km s-1, and constant-velocity flow with km s-1. The photospheric radius on day 79 is estimated as cm, where km s-1, while the temperature is taken to be K according to the value found from the black-body fit to the continuum (Section 3.2.3). The parameter in this case is found to be 0.26.
In Fig. 6 we show calculated profiles of Fe ii 5018, Si ii 6148, the Na i D1,2 doublet and the O i 7773 Å triplet, for solar abundance and hydrogen concentration cm-3. In the case of Na i we have for the sake of simplicity ignored the doublet structure, which explains why our model line is narrower than the observed one. This density seems to be the optimal one: a factor of 1.5 lower density results in too weak O i and Na i lines, while a factor 1.5 higher density makes all the lines too strong.
Although neither kinematic model produces an excellent fit, it is clear that free expansion kinematics better predicts the positions of the absorption minima and, therefore, is preferred compared to the constant-velocity case. The differences between the modelled and observed line profiles in the free-expansion case may be related to the omission of Thomson scattering and the simplicity of our quasi-LTE model.

4.4 Overview of the qualitative model
We summarize the main results of the qualitative analysis in a cartoon (Fig. 7). It shows the basic structural elements of SN 1994W which we believe are responsible for the formation of the optical spectrum when the supernova’s luminosity is high. The ejecta expand with a velocity of km s-1 into an extended ( cm) CS envelope. The characteristic density of the CS envelope is cm-3. The SN ejecta are enshrouded by the opaque CDS within which the photosphere resides during most of the luminous phase. The opaque CDS precludes the formation of absorption lines from the ejecta. The CDS presumably forms primarily during shock break-out and is subsequently maintained by both CS material swept up by the radiative forward shock and SN material swept up by the reverse shock. These shocks are not shown in Fig. 7 but they are presumably located at the distances away from the outer and inner edges of the CDS.
Attached to the CDS is a layer populated by dense ( cm-3) fragments supplied by the RT instability of the dense CDS and, possibly, by radiative shocks in CS clouds. This inhomogeneous layer of dense material is the primary site of the broad emission lines with the characteristic velocity of the line-emitting gas, 4000 km s-1 (e.g., in He i).
The CS envelope, which in turn expands with a velocity of km s-1, is responsible for the narrow lines. Thomson scattering in the CS envelope results in the emergence of broad emission-line wings, which are most apparent in the strong lines such as H and H. Because of the large expansion velocity, the red wing is stronger than the blue wing.
5 A model for H
In order to confirm and refine the above qualitative picture of the formation of the SN 1994W spectrum, we have modelled the H line profile. In many respects our approach repeats the analysis of SN 1998S by Chugai (2001), which involved calculations of the CDS dynamics and Monte Carlo computations of the emergent lines formed outside the CDS. Here we use an updated version of this model, which now includes calculations of CS hydrogen ionization, electron temperature and H emissivity. In the previous model both of the latter were set rather arbitrarily.
5.1 The model
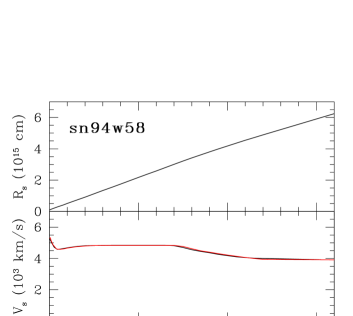
The CDS dynamics are calculated numerically in the thin-shell approximation (Chevalier, 1982). We assume that the SN initially expands homologously () with density distribution , where the parameters of the distribution are defined by the ejecta mass and kinetic energy . At radius (a rather arbitrary value) the SN ejecta begin to interact with the extended stellar envelope. The density of the extended stellar envelope is adjusted in our model by the requirement that a strong initial deceleration of the swept-up thin shell must result in an expansion velocity of km s-1 on day 30 when the photospheric radius reaches cm. The CS envelope is attached to the stellar envelope at cm. A constant pre-shock velocity (1000 km s-1) is assumed for the CS gas. This is a reasonable approximation for the homologous expansion, bearing in mind additional radiative acceleration. For the SN mass and energy we adopt and erg — both values are close to the parameters of the light-curve models B and C of Falk & Arnett (1977). We find that the dynamical model is nearly the same for SN mass in the range . The evolution of the CDS radius and velocity is shown in Fig. 8 for the density profile which is also consistent with the H model. In fact, the optimal density is a compromise between the requirements imposed by the H profile evolution, the CDS velocity, and the bolometric luminosity at the final stage of the light-curve plateau. The density of the CS envelope is nearly flat () in the range cm.
The ionization of the CS envelope is produced by both X-ray emission from the radiative forward shock wave and by photospheric radiation. The latter primarily operates via hydrogen photoionization from the second level. The X-ray luminosity of the forward shock wave is calculated as
| (7) |
where is the pre-shock density, while the pre-shock velocity is the superposition of the pre-explosion velocity and the accelerated velocity term. Half of this luminosity is directed toward the CDS where it is reprocessed into continuum radiation. This component is not treated explicitly in the model. The other half of the X-ray luminosity of the forward shock is emitted outward and is partially absorbed by the CS gas. The X-ray spectrum of the forward shock is approximated as , where is the temperature of the forward shock defined by the shock velocity . The spectral power index roughly describes both the Gaunt factor and the contribution of X-ray lines in the low-energy band (Terlevich et al., 1992). The soft X-rays from the reverse shock at the epoch under consideration are fully absorbed by the CDS (cf. Fig. 9 of Fransson, Lundqvist & Chevalier 1996) and by the SN ejecta, and are reprocessed into the optical.

The energy of the X-rays absorbed in the CS envelope is shared between heating, ionization and excitation. Excitation and ionization by the photospheric radiation are also taken into account. The electron temperature in the CS envelope is determined from the energy balance between heating from ionization by X-rays and photospheric radiation and cooling due to hydrogen. This approximation is quite reasonable in the temperature range of K. The hydrogen atom is treated in the two-level-plus-continuum approximation. The degree of ionization we obtain for hydrogen in the CS envelope lies typically in the range . The H emissivity is due to recombination (Case B) and collisional excitation. Collisional de-excitation of H is included in the computation of the net emissivity. To allow for uncertainties in the flux, model, distance and reddening we use a fitting parameter for narrow H. This parameter is a multiplicative factor in the H emissivity in the CS envelope.
The broad-line region (Fig. 7) is described by an (on average) homogeneous layer, , where and the distribution of the line luminosity for , where is the minimal velocity adopted to be equal to the pre-shock CS gas velocity. We express the average emissivity of the broad component in terms of the pre-shock emissivity, multiplied by a fitting factor , which is restricted by the requirement that the H intensity from the broad-line region cannot exceed the black-body value for the local electron temperature of the CS gas in the pre-shock zone.
We assume free expansion pre-explosion kinematics (), though we have also explored the constant-velocity case. The acceleration by the SN radiation is described as an additional CS velocity term , where is a free parameter.
5.2 Thomson scattering and the broad component
In the H line profile, the broad emission component and electron-scattering wings overlap and at first sight cannot be disentangled unambiguously. Nevertheless, we found that there is not much freedom in the decomposition procedure. In Fig. 9 we show a model narrow-line component on day 31, with the broad component turned off. To emphasize the different behaviours of the broad component and the electron-scattering wings, we show in Fig. 10 models with different Thomson optical depth (0, 1 and 2.8) but with otherwise similar parameters. For optical depth zero, the modelled broad component is strongly skewed toward the blue because of occultation by the photosphere. This asymmetry decreases as increases and Thomson scattering of the line emission in the expanding CS envelope produces an increasingly strong red wing. These different behaviours of the broad line and electron-scattering wings permit us to disentangle the contribution of the two line components in H. In passing, we note that the continuum level also depends on , since the Thomson optical depth affects the escape probability of photons emitted by the photosphere.


5.3 H and the expansion law
The sensitivity of the model line profile to the kinematics of the CS envelope is demonstrated in Fig. 11. The plot shows H profiles on day 31 computed for similar model parameters — all that differs is the velocity distribution. For , homologous expansion without post-explosion radiative acceleration fits the observations quite well. The constant-velocity case is much less successful: it produces an emission component which is too broad, and absorption which is too shallow (Fig. 11). This result, taken together with the results of the narrow CS line modelling (Fig. 6), argues against the constant-velocity case. We checked a model with constant velocity and pre-shock acceleration and found, unsurprisingly, that this gives even worse agreement. The homologous model, on the other hand, works just as well when combined with post-explosion acceleration. In the bottom panel of Fig. 11 we show such a model profile characterized by an amplitude of accelerated velocity term of km s-1.
Although homologous expansion kinematics is certainly preferred, this model shows a rather deep absorption component. This contradiction is not related to the finite resolution since we have smoothed the model profile by a Gaussian with appropriate width. An explanation for the large absorption strength in the model might be hidden in a possible deviation of the kinematics from homologous expansion, some clumpiness of the CS envelope, or lower hydrogen excitation in the outer layers of the CS envelope than the model predicts.


5.4 Modelling the H evolution
We have calculated H for three epochs (31, 57 and 89 days past explosion) using the density distribution of the CS envelope ( cm), and the CDS radius and velocity as shown in Fig. 8. The density parameter at cm on day 31 is g cm-1. Free expansion kinematics is assumed with a boundary velocity of km s-1 at cm on day 31. This implies an age for the CS envelope of yr when the SN explodes. For other values of counted from the moment of envelope ejection, we rescale according to and .
The computed profiles are shown in Fig. 12. In Table 4 we list the corresponding parameters: photospheric (CDS) radius, photospheric temperature, brightness dilution, CDS velocity, post-explosion velocity increase, and emissivity fitting factors for narrow and broad components. The last column displays the calculated Thomson optical depth outside the CDS. On days 31 and 57 we use the approximation of an opaque photosphere. On day 89 we found, however, that this approximation predicts too weak a red part of the profile. The model agrees better with the observations if we suggest that at this late phase the CDS is semi-transparent. To describe this effect in a simple way we allow a photon striking the photosphere to cross it and escape into the CS medium with a finite probability, which we found should be close to . This assumption is qualitatively consistent with the fact that the photospheric brightness on day 89 is diluted () for the optimal continuum temperature. The models for all three epochs demonstrate satisfactory fits to the data. On day 31, the model is consistent with the presence of broad He i 6678 in the red wing of H, while on day 57 the model fit in the red wing does not leave any room for the He i line. This behaviour is consistent with the weakening of other He i lines at this time.
We calculated the H component from the CS envelope in a unified way with a minimum number of free parameters. For this reason, the fact that the tuning parameter of the narrow-line intensity () is close to unity (Table 4) means that within the uncertainties ( per cent) the electron distribution in the CS envelope recovered from the Thomson scattering effects is also consistent with the luminosity of the narrow H component. Because the line luminosity depends on the filling factor as while the Thomson optical depth does not, we conclude that the filling factor in the CS envelope is close to unity in at least most of the line-forming zone.
This last observation is of crucial importance for distinguishing between the two scenarios for the formation of the broad-line region (Section 4.2), and indicates that CS clouds do not play a significant rôle in this process.
We have studied cases with different density power-law indices (defined via ) in the flat part of the CS envelope. In the case , the tuning parameter () must systematically decrease by a factor of 1.25 to fit the profile. For , should systematically increase with time by a similar factor. Bearing in mind the uncertainties in the modelling and fluxing, we do not rule out that the density gradient lies in the range .
5.5 Implications for the origin of the circumstellar envelope
The model for the H evolution presented above for the CS envelope outside cm argues for a total mass of and kinetic energy of erg. Combined with the derived kinematic age of the CS envelope yr, the average kinetic luminosity of the mass-loss mechanism responsible for the ejection of the CS envelope then becomes erg s-1, and the average mass-loss rate is yr-1.
The kinetic luminosity we derive here is enormous compared to stellar values. It exceeds by two orders of magnitude the radiative luminosity of a pre-supernova with a main-sequence mass of . This certainly rules out a superwind as the mass-loss mechanism responsible for the CS envelope around SN 1994W. The CS envelope around SN 1994W must have been born as a result of a rather violent mass ejection initiated by some energetic explosive event in the stellar interior ( erg) at yr prior to the SN outburst.
| Day | ||||||||
|---|---|---|---|---|---|---|---|---|
| ( cm) | (K) | (km s-1) | (km s-1) | |||||
| 31 | 1.2 | 16000 | 1 | 4220 | 400 | 35 | 1.15 | 2.8 |
| 57 | 2.2 | 7760 | 1 | 4160 | 400 | 1 | 1 | 2.0 |
| 89 | 3.3 | 7000 | 0.2 | 3920 | 170 | 0.5 | 1.15 | 0.54 |
6 Light-curve modelling
To model the broad-band photometric light curves, we use the multi-energy group radiation hydrodynamics code stella (Blinnikov et al., 1998, 2000). In the current work, stella solves time-dependent equations for the angular moments of intensity averaged over fixed frequency bands, using 200 zones for the Lagrangian coordinate and up to 100 frequency bins with variable Eddington factors. The transfer of gamma rays from radioactive decay is calculated using a one-group approximation for the non-local deposition of the energy of radioactive nuclei. Except for the latest phases, the gamma-ray deposition is not important for SN 1994W. In the equation of state, LTE ionizations and recombinations are taken into account, but radiation is not assumed to be in equilibrium with matter. The effect of line opacity is treated as an expansion opacity according to the prescription of Eastman & Pinto (1993). In comparison with previous work with stella, here we use an extended spectral line list, the same as in the discussion of SN 1998S by Chugai et al. (2002).
6.1 Pre-supernova models
SCL98 used analytical fits (Litvinova & Nadyozhin, 1983, 1985; Popov, 1993) to estimate the pre-SN radius, mass and explosion energy in SN 1994W. However, those fits are only valid for typical SNe II-P, and from the discussion above we know that SN 1994W was instead dominated by circumstellar interaction. To determine the pre-supernova parameters for such an unusual event, we therefore need to do detailed numerical modelling. This can be done only for a subset of the pre-supernova parameters, so we used a cut-and-trial approach, guessing the initial conditions and computing light curves in order to meet the constraints posed by the photometry and the spectral analysis of Section 5. In the absence of an evolutionary model, we built a sequence of several dozens of non-evolutionary models, converging finally on a reasonably good fit to observations. Our initial models are constructed in hydrostatic equilibrium for the bulk mass, while the outer layers mimic the structure of the circumstellar envelope.
For a given mass and radius , we obtain a model in mechanical equilibrium assuming a power-law dependence of temperature on density (Nadyozhin & Razinkova, 1986; Blinnikov & Bartunov, 1993):
| (8) |
The hydrostatic configuration thus obtained would be close to a polytrope of index if it were chemically homogeneous and fully ionized. The difference from a polytropic model arises due to recombination of ions in the outermost layers and non-uniform composition (Fig. 13).
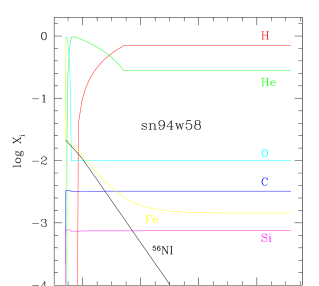
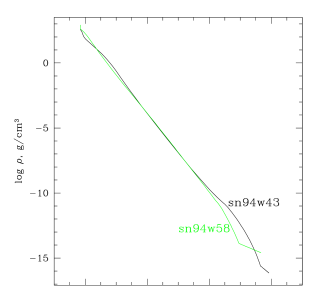
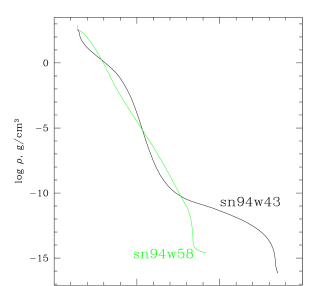
In the centre of this configuration, at the mass cut of the collapsing core, we assume a “point-like” gravitating hard core (with numerical radius — much larger than a real core, but much smaller than the radii of mesh zones involved in our hydrodynamic simulations). The density structure found in this way is shown in Figs. 14 and 15.
The parameters of the models are given in Table 5. The first column is the model label, which is followed by the mass of SN ejecta, pre-supernova stellar radius, 56Ni mass, power-law index , density of the CS envelope () at the radius cm, power-law index () of the CS envelope density distribution , the outer radius of the CS envelope, and the kinetic energy at infinity in units of foe (1 foe = erg).
| Model | 222pre-supernova mass | 333kinetic energy at infinity | ||||||
|---|---|---|---|---|---|---|---|---|
| () | () | () | ( g cm-3) | () | ( erg) | |||
| sn94w43 | 12 | 8 | 0.015 | 0.319 | 5 | 2 | 12 | 1.07 |
| sn94w58 | 7 | 2 | 0.015 | 0.31 | 12 | 1 | 6.6 | 1.25 |
| sn94w64 | 7 | 2 | 0.015 | 0.31 | 0 | - | - | 1.33 |
Each model was exploded by the deposition of heat energy in a layer of mass outside of . Since stella does not include nuclear burning, preservation of the same mixed composition in the ejecta is assured.
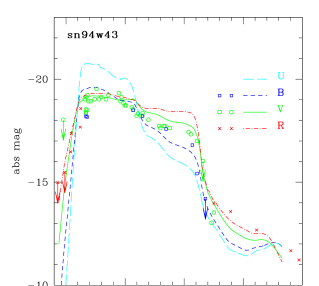
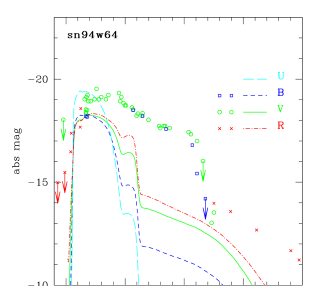
We explored parameter space for the mass () and energy () of the SN ejecta and found acceptable fits to the data for masses in the range 6–15 and with the energy given by the ratio –0.2 foe . In the following sections and in Table 5, we present three representative models which allow us to demonstrate different aspects of the formation of the light curve. Of these three, model sn94w58 provides our best fit to SN 1994W, model sn94w43 shows that a normal SN II-P light curve is not appropriate for SN 1994W, and model sn94w68 illustrates what the supernova light curve might have looked like without CS interaction. All three models have ergs. This energy is typical for good light-curve models. The asymptotic kinetic energy of the ejecta is somewhat lower and is given in the Table 5.
6.2 Hydrodynamics and shock propagation
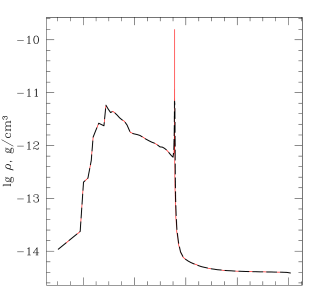
The modelled light curves are dominated by the diffusion of the trapped radiation generated during the shock wave’s propagation in the extended stellar atmosphere and subsequent emission of a radiative shock propagating in the dense circumstellar medium. A dense shell is formed which is found in non-equilibrium radiation hydrodynamic modelling but often missed in equilibrium diffusion modelling. We identify this dense shell as the CDS discussed in Section 4.1. The Lagrangian code stella does a good job of resolving the very fine structure of the opaque shell, which contains approximately one solar mass of the material (Fig. 16).
6.3 Light curves
In Figs. 17 and 18 we show the changes in the colour temperature, , of the best black-body fit to the flux. We compare this to the effective temperature, , defined by the luminosity and the radius of last scattering through (see Blinnikov et al. 1998 for details of finding and from that ). Our multi-group radiative transfer with hydrodynamics obtains this temperature in a self-consistent way, and no additional estimates of the thermalization depth are needed (in contrast to the one-group model of Ensman & Burrows 1993, for example). The large difference between colour and effective temperatures is partly due to a geometric effect (the radius of last scattering is greater than the effective radius of photon creation) and partly due to the blanketing effect of scattering (the average energy of the photons is higher than that corresponding to the value of ; Schuster 1905). The modelled changes in a way similar to the values derived from black-body fits to the spectra (Section 3.2.3).


The light curves are shown in Figs. 19, 20 and 21. The model sn94w43 produces a bright light curve, but the second half of its plateau is dominated by diffusion, not by the shock, so the behaviour of colours is similar to that of a typical SN II-P.
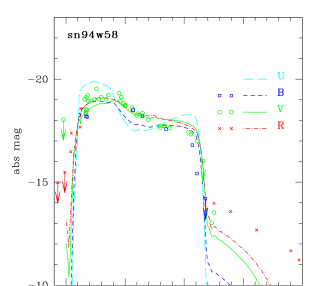
The density of the more powerful wind in the model sn94w58 follows the law . This model produces a much better fit to the colours at the late plateau phase. The flat CS density distribution is consistent with the modelling of H evolution (Section 5.4). Model sn94w64, which is exactly the same as model sn94w58 in the bulk mass, but does not have the powerful wind, is much less luminous at the late plateau phase. This shows the importance of CS interaction for the luminosity.
The time-dependence of the radius and velocity of the cool dense shell in model sn94w58 is shown in Fig. 22. The two nearly indistinguishable lines in the plot are obtained by taking numerically, and by taking the mass-averaged speed of matter inside the shell. A comparison with Fig. 8 shows good agreement with the spectral model, although is somewhat higher in the hydrodynamical model. The difference is at most per cent.
To summarize, the hydrodynamical modelling of the light curve of SN 1994W suggests that the optimal light curve is produced in a model which contains a dense CS envelope at cm with a relatively flat density distribution and an outer radius of cm. This conclusion is fully consistent with the H modelling.
7 Discussion and Conclusions
We have presented and analysed spectra and light curves of SN 1994W, one of the best-observed SNe IIn. During the first three months the spectrum clearly shows the presence of three line components: (i) narrow P-Cygni lines, (ii) intrinsically broad lines and (iii) extended smooth wings in H and H. We attribute these components, respectively, to (i) a dense CS envelope, (ii) shocked, cool, dense gas confined in a narrow layer on top of the photosphere, and (iii) the effects of Thomson scattering in the CS envelope.
Our line profile analysis and hydrodynamical light-curve modelling have led us to a coherent picture. SN 1994W appears to have been the result of explosion of an extended pre-supernova ( cm) embedded in an extended CS envelope [ cm] with Thomson optical depth one month after the explosion.
Although we do not rule out the presence of a wind from a normal red supergiant pre-supernova outside the dense CS envelope, such a wind component cannot have been very dense, considering the low luminosity of H on day 203 ( erg s-1). This luminosity is two orders of magnitude lower than for SN 1979C ( erg s-1) at yr (Chevalier & Fransson, 1985). Attributing this difference to the difference in the interaction luminosity (), we can estimate the density parameter of the outer wind in SN 1994W. The expansion velocity of the CDS in SN 1994W, km s-1, is half that of SN 1979C ( km s-1). Given the SN 1979C wind parameter, g cm-1, the outer wind in SN 1994W should have g cm-1 to account for the difference in the H luminosity. This is at least ten times lower than in SN 1979C, and a factor of two lower than in SN 1980K (e.g., Lundqvist & Fransson, 1988). In this respect, the detection by Schlegel (1999) of X-rays from SN 1994W at days with luminosity erg s-1 appears odd when compared with the expected X-ray luminosity ( erg s-1) at that epoch for a case of SN/wind interaction with g cm-1. To resolve this problem, one would need the wind density to be at least of factor of ten higher at cm, i.e., exceeding that of SN 1979C. This could argue for a possible multi-shell ejection scenario prior to the explosion.
The recovered kinematics, density and linear scale of the CS matter around SN 1994W imply a kinematic age for the CS envelope of yr, mass and kinetic energy erg. The enormous average mass-loss rate ( yr-1) and equally enormous kinetic luminosity ( erg s-1) of the mass-ejection mechanism strongly suggest that the CS envelope has been lost as a result of an explosive event which occurred yr prior to the SN outburst.
In their model for the narrow lines in SN 1983K, Grasberg & Nadyozhin (1986) invoked the violent ejection of the hydrogen envelope 1–2 months before the SN explosion with a velocity on the order of km s-1 and an energy erg. Dramatically high mass loss shortly before explosion has also been derived for the SN IIn 1995G by Chugai & Danziger (2003), on the basis of an analysis similar to the one we have presented here.
The mechanism behind such violent ejections might be associated with a nuclear flash in the degenerate core of the pre-supernova. This conjecture, also presented by Chugai & Danziger (2003), is prompted by the prediction of Weaver & Woosley (1979) that the O/Ne/Mg core of an star may produce strong Ne flashes several years prior to the SN explosion and that the strongest flash could eject most of the hydrogen envelope with velocities of km s-1. Although such flashes do not occur in more recent models with finer zoning (Woosley, Heger & Weaver 2002), we believe that the effect warrants further investigation, especially given the highly complicated nuclear burning regime and hydrodynamics of degenerate O/Ne/Mg cores.
Remarkably, the low 56Ni mass () estimated from the tail -band luminosity of SN 1994W (SCL98) seems to be in accord with the suggested mass of such a progenitor, if at the lower end of our estimated mass range. Such stars are expected to eject only small amounts of 56Ni (Mayle & Wilson, 1988). Our models are, however, not very sensitive to the zero-age main-sequence mass of the progenitor, and, as SCL98 point out, the low nickel content could indicate either a low-mass progenitor which may have lost a few solar masses in shell and wind ejections, or a more massive star that lost several solar masses prior to the ejection of the CS shell. Deep X-ray searches for more extended CS material could help solve this problem, as should more detailed models for stellar evolution just prior to core collapse.
How common are events like SN 1994W? Of the SNe IIn that have been observed so far, it is possible that a close counterpart has been seen but not recognised as such due to sparser temporal coverage or greater distance. Nevertheless, several objects have shown narrow hydrogen and Fe ii absorption lines with velocities of about 1000 km s-1. This family includes SNe 1987B (Schlegel et al., 1996), 1994aj (Benetti et al., 1998), 1994ak (Filippenko, 1997), 1995G (Pastorello et al., 2002), 1996L (Benetti et al., 1999) and 1999el (Di Carlo et al., 2002). We suggest that in at least some of these SNe, a CS envelope was ejected in a violent, explosive manner, as we believe was the case for SN 1994W, and as Chugai & Danziger (2003) have suggested for SN 1995G. Further data and analyses are needed, however, before it can be demonstrated that the energy of the ejected CS envelope is comparable for these events.
In any case, we suggest that at least part of the variety of SNe IIn has been accounted for. Some, like SN 1988Z and SN 1998S, have a dense, slow CS envelope formed by a slow superwind. Others, like SN 1994W, seem to have ejected a CS envelope in a violent event a few years before the SN explosion.
Acknowledgements
We thank Aaron J. Barth, Mike Breare, René Rutten, Luis C. Ho, Neil O’Mahony, Chien Y. Peng and Ed Zuiderwijk for helping take observations for us, and Clive Jackman, Danny Lennon and Marco Azzaro for help assessing the day 31 spectrum calibration. We also thank Itziar Aretxaga, Eddie Baron, Claes Fransson, Seppo Mattila, Peter Meikle, Miguel Pérez Torres, and Luca Zampieri for discussions.
This paper is based on observations made with the Isaac Newton Telescope (INT), the William Herschel Telescope (WHT), and the Nordic Optical Telescope (NOT). The INT and WHT are operated on the island of La Palma by the Isaac Newton Group in the Spanish Observatorio del Roque de los Muchachos of the Instituto de Astrofísica de Canarias. The NOT is operated on the island of La Palma jointly by Denmark, Finland, Iceland, Norway, and Sweden, in the Spanish Observatorio del Roque de los Muchachos of the Instituto de Astrofísica de Canarias. Some of the data presented herein were obtained at the W.M. Keck Observatory, which is operated as a scientific partnership among the California Institute of Technology, the University of California and the National Aeronautics and Space Administration. The Observatory was made possible by the generous financial support of the W.M. Keck Foundation.
This project was supported by the Royal Swedish Academy of Sciences. S.I.B. was supported partly by RFBR 02-02-16500, the Wenner-Gren Science Foundation, MPA Garching and ILE Osaka guest programs. The research of P.L. is sponsored by the Royal Swedish Academy and the Swedish Research Council, and he is a Research Fellow at the Royal Swedish Academy supported by a grant from the Wallenberg Foundation. A.V.F.’s research is supported by National Science Foundation grant AST-0307894.
References
- Allen (1973) Allen, C. W., 1973, Astrophysical Quantities. University of London, Athlone Press, London
- Benetti et al. (1998) Aretxaga, I., Benetti, S., Terlevich, R. J., Fabian, A. C., Cappellaro, E., Turatto, M., Della Valle, M., 1999, MNRAS, 309, 343
- Axelrod (1980) Axelrod, T., 1980, Ph.D. thesis, California Univ., Santa Cruz
- Almog & Netzer (1989) Almog, Y., Netzer, H., 1989, ApJ, 238, 57
- Benetti et al. (1998) Benetti, S., Cappellaro, E., Danziger, I. J., Turatto, M., Patat, F., Della Valle, M., 1998, MNRAS, 294, 448
- Benetti et al. (1999) Benetti, S., Turatto, M., Cappellaro, E., Danziger, I. J., Mazzali, P. A., 1999, MNRAS, 305, 811
- Bessell (1999) Bessell, M. S., 1999, PASP, 111, 1426
- Blinnikov & Bartunov (1993) Blinnikov, S. I., Bartunov, O. S., 1993, A&A, 273, 106
- Blinnikov et al. (1998) Blinnikov, S. I., Eastman, R., Bartunov, O. S., Popolitov, V. A., Woosley, S. E., 1998, ApJ, 496, 454
- Blinnikov et al. (2000) Blinnikov, S., Lundqvist, P., Bartunov, O., Nomoto, K., Iwamoto, K., 2000, ApJ, 532, 1132
- Blondin & Ellison (2001) Blondin, J. M., Ellison, D. C., 2001, ApJ, 560, 244
- Bowen et al. (2000) Bowen, D. V., Roth, K. C., Meyer, D. M., Blades, J. C., 2000, ApJ, 536, 225
- Bragaglia et al. (1994) Bragaglia, A., Munari, U., Barbon, R., 1994, IAU Circ., No. 6044
- Cardelli et al. (1989) Cardelli, J. A., Clayton, G. C., Mathis, J. S., 1989, ApJ, 345, 245
- Chevalier (1982) Chevalier R.A., 1982, ApJ, 258, 790
- Chevalier & Blondin (1995) Chevalier R.A., Blondin J.M., 1995, ApJ, 444, 312
- Chevalier & Fransson (1985) Chevalier R. A., Fransson C., 1985, in Bartel N., ed., Supernovae as Distance Indicators, Springer-Verlag, Berlin, p. 123
- Chevalier & Fransson (1992) Chevalier, R. A., Fransson, C., 1992, ApJ, 395, 540
- Chevalier & Fransson (1994) Chevalier, R. A., Fransson, C., 1994, ApJ, 420, 268
- Chugai (1990) Chugai, N. N., 1990, Sov. Astr. Lett., 16, 457
- Chugai (1992) Chugai, N. N., 1992, SvA, 36, 63
- Chugai (1997) Chugai, N. N., 1997, Ap&SS, 252, 225
- Chugai (2001) Chugai, N. N., 2001, MNRAS, 326, 1448
- Chugai et al. (2002) Chugai N. N., Blinnikov, S. I., Fassia, A., Lundqvist, P., Meikle, W. P. S., Sorokina, E. I., 2002, MNRAS, 330, 473.
- Chugai & Danziger (2003) Chugai, N. N., Danziger, I. J., 2003, Astr. Lett., 29, 732
- Cortini & Villi (1994) Cortini, G., Villi, M., 1994, IAU Circ., No. 6042
- Cumming et al. (1994) Cumming, R. J., Lundqvist, P., Meikle, W. P. S., 1994, IAU Circ., No. 6057
- Di Carlo et al. (2002) Di Carlo, E., et al., 2002, ApJ, 573, 144
- Dopita et al. (1984) Dopita, M. A., Evans, R., Cohen, M., Schwarz, R. D., 1984, ApJ, 287, L69
- Eastman & Pinto (1993) Eastman, R. G., Pinto, P. A., 1993, ApJ, 412, 731
- Elitzur et al. (1983) Elitzur, M., Ferland, G. J., Mathews, S. G., Shields, G. A., 1983, ApJ, 272, L55
- Ensman & Burrows (1993) Ensman, L., Burrows, A., 1992, ApJ, 393, 742
- Fassia et al. (2001) Fassia, A., et al., 2001, MNRAS, 325, 907
- Falk & Arnett (1977) Falk, S. W., Arnett W. D., 1977, ApJS, 13, 515
- Filippenko (1982) Filippenko, A. V., 1982, PASP, 94, 715
- Filippenko (1989) Filippenko, A. V., 1989, AJ, 97, 726
- Filippenko (1991) Filippenko, A. V., 1991, in Danziger, I. J., Kjär, K., eds, Supernova 1987A and Other Supernovae ESO, Garching, p. 343
- Filippenko (1997) Filippenko, A. V., 1997, ARA&A, 35, 309
- Filippenko (2000) Filippenko, A. V., 2000, in Holt, S. S., Zhang, W. W., eds, Cosmic Explosions, AIP, New York, p. 123
- Filippenko & Barth (1994) Filippenko, A. V., Barth, A. J., 1994, IAU Circ., No. 6046
- Filippenko & Moran (1998) Filippenko, A. V., Moran, E. C., 1998, IAU Circ., No. 6830
- Fransson (1982) Fransson, C., 1982, A&A, 111, 140
- Fransson (1984) Fransson, C., 1984, A&A, 133, 264
- Fransson et al. (1996) Fransson, C., Lundqvist, P., Chevalier, R. A., 1996, ApJ, 461, 993
- Fransson et al. (2002) Fransson, C., et al., 2002, ApJ, 572, 350
- Fransson et al. (2004) Fransson, C., et al., 2004, ApJ, submitted
- Fuhr et al. (1988) Fuhr, J. R., Martin, G. A., Wiese, W. L., 1988, J. Phys. Chem. Ref. Data 17, Suppl. 4
- Gaskell (1994) Gaskell, C. M., 1994, IAU Circ., No. 6048
- García-Lario et al. (1999) García-Lario, P., Riera, A., Manchado, A., 1999, ApJ, 526, 854
- Germany et al. (1994) Germany, L., Reiss, D. J., Sadler, E. M., Schmidt, B. P., Stubbs, C. W., 2000, ApJ, 533, 320
- Grasberg et al. (1971) Grasberg, E. K., Imshennik, V. S., Nadyozhin, D. K., 1971, Ap&SS, 10, 28
- Grasberg & Nadyozhin (1986) Grasberg, E. K., Nadyozhin, D. K., 1986, Sov. Astr. Lett., 12, 68
- Gualandi & Merighi (2001) Gualandi, R., Merighi, R., 2001, BFOSC (Bologna Faint Object Spectrograph & Camera) Manuale Utente, version 2.0. Osservatorio Astronomico di Bologna, Bologna
- Hamuy et al. (2003) Hamuy, M. et al., 2003, Nat, 424, 651
- Henry & Branch (1987) Henry, R. B. C., Branch, D., 1987, PASP, 99, 112
- King (1985) King, D. L., 1985, ING Technical Note, 31
- Klein et al. (1994) Klein, R. I., McKee, C. F., Colella, P., 1994, ApJ, 420, 213
- Leibundgut (1991) Leibundgut, B. et al., 1991, ApJ, 372, 531
- Leonard et al. (2000) Leonard, D. C., Filippenko, A. V., Barth, A. J., Matheson, T., 2000, ApJ, 536, 239
- Lewis et al. (1994) Lewis, J. R., et al., 1994, MNRAS, 266, L27
- Litvinova & Nadyozhin (1983) Litvinova, I. Yu., Nadyozhin, D. K., 1983, Astrophys. Sp. Sci. 89, 89
- Litvinova & Nadyozhin (1985) Litvinova, I. Yu., Nadyozhin, D. K., 1985, Pis’ma Astron. Zh. 11, 351 (Sov. Astron. Lett. 11, 145)
- Lundqvist & Fransson (1988) Lundqvist, P., Fransson, C., 1988, A&A, 192, 221
- Matheson et al. (2000) Matheson, T., Filippenko, A. V., Ho, L. C., Barth, A. J., Leonard, D. C., 2000, AJ, 120, 1499
- Meikle et al. (1994) Meikle, W. P. S., Catchpole, R. M., Cumming, R. J., Geballe, T. R., Lewis, J. R., Martin, R., Walton, N. A., 1994, Spectrum, 4, 7
- Mayle & Wilson (1988) Mayle, R., Wilson, J. R., 1988, ApJ, 334, 909
- Miller & Stone (1993) Miller, J. S., Stone, R. P. S., 1993, Lick Obs. Tech. Rep., No. 66
- Murray (1983) Murray, C. A., 1983, Vectorial Astrometry. Adam Hilger, Bristol
- Nadyozhin & Razinkova (1986) Nadyozhin, D. K., Razinkova, T. L., 1986, Nauchnye informatsii, 61, 29
- Niemela et al. (1985) Niemela, V. S., Ruiz, M. T., Phillips, M. M., 1985, ApJ, 289, 52
- Oke et al. (1993) Oke, J. B., et al., 1995, PASP, 107, 375
- Pastorello et al. (2002) Pastorello, A., Turatto, M., Benetti, S., Cappellaro, E., Danziger, I. J., Mazzali, P. A., Patat, F., Filippenko, A. V., Schlegel, D. J., Matheson, T., 2002, MNRAS, 333, 27
- Pikelner (1954) Pikelner, S. B., 1954, Izv. Krymsk. Astroph. Obs. 12, 93
- Popov (1993) Popov, D. V., 1993, ApJ, 414, 712
- Chugai et al. (2002) Pozzo, M., Meikle, W. P. S., Fassia, A., Geballe, T., Lundqvist, P., Chugai N. N., Sollerman, J., 2004, MNRAS, in press (astro-ph/0404533)
- Rigon et al. (2003) Rigon, L., Turatto, M., Benetti, S., Pastorello, A., Cappellaro, E., Aretxaga, I., Vega, O., Chavushyan, V., Patat, F., Danziger, I. J., Salvo, M., 2003, MNRAS, 340, 191
- Rupen et al. (1987) Rupen, M. P., et al., 1987, AJ, 94, 61
- Ryder et al. (1993) Ryder, S., Staveley-Smith, L., Dopita, M., Petre, R., Colbert, E., Malin, D., Schlegel, E., 1993, ApJ, 416, 167
- Schlegel (1990) Schlegel, E. M., 1990, MNRAS, 244, 269
- Schlegel et al. (1996) Schlegel, E. M., Kirshner, R. P., Huchra, J. P., Schild, R. E., 1996, AJ, 111, 2038
- Schlegel (1999) Schlegel, E. M., 1999, ApJ, 527, 85
- Schuster (1905) Schuster, A., 1905, ApJ, 21, 1
- Shortridge (1990) Shortridge, K., 1990, Starlink User Note, 86, Rutherford Appleton Laboratory
- Sigut & Pradhan (2003) Sigut, T. A. A., Pradhan, A. K., 2003, ApJS, 145, 15
- Sollerman et al. (1998) Sollerman, J., Cumming, R. J., Lundqvist, P., 1998, ApJ, 493, 933
- Stathakis & Sadler (1991) Stathakis, R. A., & Sadler, E. M., 1991, MNRAS, 250, 786
- Terlevich et al. (1992) Terlevich, R. J., Tenorio-Tagle, G., Franco, J., Melnick, J., 1992, MNRAS, 255, 713
- Turatto et al. (1993) Turatto, M., Cappellaro, E., Danziger, I. J., Benetti, S., Gouiffes, C., Della Valle, M., 1993, MNRAS 262, 128
- Turatto et al. (2000) Turatto, M., Suzuki, T., Mazzali, P. A., Benetti, S., Cappellaro, E., Danziger, I. J., Nomoto, K., Nakamura, T., Young, T. R., Patat, F., 2000, ApJ, 534, L57
- van Hoof (1999) van Hoof, P., 1999, Atomic Line List v2.04, http://www.pa.uky.edu/peter/atomic/
- Wade & Horne (1988) Wade, R. A., Horne, K., 1988, ApJ, 324, 411
- Weaver & Woosley (1979) Weaver, T. A., Woosley, S. E., 1979, BAAS, 11, 724
- Wegner & Swanson (1994) Wegner, G., Swanson, S. R., 1996, MNRAS, 278, 22
- Williams & Shipman (1988) Williams, G. A., Shipman, H. L., 1988, ApJ, 326, 738
- Woosley et al. (2002) Woosley, S. E., Heger, A., Weaver, T. A., 2002, RvMP, 74, 1015
- Woosley (1986) Woosley, S. E., 1986, in Hauck B., Maeder, A., Meynet, G., eds, Nucleosynthesis and Stellar Evolution, Saas-Fee Advanced Course 16, Geneva Observatory, Sauverny, p. 1