Spectral Index and Quasi-Periodic Oscillation Frequency Correlation in Black Hole (BH) Sources: Observational Evidence of Two Phases and Phase Transition in BHs
Abstract
Recent studies have shown that strong correlations are observed between the low frequencies (1-10 Hz) of quasiperiodic oscillations (QPOs) and the spectral power law index of several Black Hole (BH) candidate sources, in low hard state, steep power-law (soft) state and in transition between these states. The observations indicate that the X-ray spectrum of such state (phases) show the presence of a power-law component and are sometimes related to simultaneous radio emission indicated the probable presence of a jet. Strong QPOs ( rms) are present in the power density spectrum in the spectral range where the power-law component is dominant ( i.e. 60-90% ). This evidence contradicts the dominant long standing interpretation of QPOs as a signature of the thermal accretion disk. We present the data from the literature and our own data to illustrate the dominance of power-law index-QPO frequency correlations. We provide a model, that identifies and explains the origin of the QPOs and how they are imprinted on the properties of power-law flux component. We argue the existence of a bounded compact coronal region which is a natural consequence of the adjustment of Keplerian disk flow to the innermost sub-Keplerian boundary conditions near the central object and that ultimately leads to the formation of a transition layer (TL) between the adjustment radius and the innermost boundary. The model predicts two phases or states dictated by the photon upscattering produced in the TL: (1) hard state, in which the TL is optically thin and very hot ( 50 keV) producing photon upscattering via thermal Componization; the photon spectrum index for this state is dictated by gravitational energy release and Compton cooling in an optically thin shock near the adjustment radius; (2) a soft state which is optically thick and relatively cold ( 5 keV); the index for this state, is determined by soft-photon upscattering and photon trapping in converging flow into BH. In the TL model for corona the QPO frequency is related to the gravitational (close to Keplerian) frequency at the outer (adjustment) radius and is related to the TL’s normal mode (magnetoacoustic) oscillation frequency . The observed correlations between index and low and high QPO frequencies are readily explained in terms of this model. We also suggest a new method for evaluation of the BH mass using the index-frequency correlation.
1 Introduction
The short dynamical time scales and coherence of quasi-periodic oscillations (QPOs) observed in accreting XRB’s strongly suggest that QPOs can provide valuable information on the accretion dynamics in the innermost parts of these systems. In this respect the discovery of low 20-50 Hz QPOs in luminous neutron star (NS) binaries by van der Klis et al. (1985), kilohertz QPOs in NS’s by Strohmayer et al. (1996) and hectohertz QPO’s in BH’s by Morgan, Remillard & Greiner (1997) opened a new era in the study of the dynamics near compact objects. Following these discoveries Psaltis, Belloni & van der Klis (1999), hereafter PBK, demonstrated that these NS and BH low and high frequencies follow a remarkably tight correlation. These features are the “horizontal branch oscillations” (HBO) along with “low frequency noise Lorentzian”, and the lower kHz QPO for NS and BH respectively.
Belloni, Psaltis & van der Klis (2002), hereafter BPK, have updated PBK’s correlation adding data from Nowak (2000), Boirin et al. (2000), Homan et al. (2001), Di Salvo et al. (2001) and Nowak et al. (2002). PBK suggest that the low and high frequencies correlate in a way that seems to depend only weakly on the properties of the sources, such the mass, magnetic field, or possibly the presence of a hard surface in compact object. Mauche (2002) has reported low and high frequency QPO’s in the dwarf nova SS Cygni and VW Hyi (see Wouldt & Warner 2002 for for the VW Hyi observations) and has called attention to the fact that these QPO’s extend the correlation of PBK downward in frequency by more than two orders of magnitude. This frequency correlation observed over such a broad range of sources indicates that a common phenomenon is responsible for QPOs in compact objects and raises the question whether one can find a observational relations which would distinguish BH candidates from other compact sources.
The comparative study of spectral and QPO features in BH candidate sources has yielded important information which can help answer this question. As far as spectral properties are concerned, there is increasing observational evidence that the large complex of spectral “states” originally devised by Belloni (2000) to classify the highly variable X-ray spectra of BH galactic sources like GRS 1915+105, can be reduced to a few simple configurations [see e.g. McClintock and Remillard (2003) and Belloni (2003)]: (1) a low hard power law dominated state where the photon spectral index is near 1.5; (2) a steep power law state in which the index is about 2.7; (3) and a thermally dominated state. The observed variability is explained by transitions between these three canonical configurations.
Low frequency (1-10 Hz) QPO’s are generally observed to present in states (1) and (2), during transitions between states (1) and (2) but never in (3). Both high and low frequency QPO’s have been thought to be associated with the accretion disk, though their specific origin has not widely understood (although see Titarchuk & Wood 2002, hereafter TW02, for explanation of their origin). Attempts to find consistent correlations with observable disk parameters have lead to mixed results. In particular, there are so many exceptions to the observed correlations of frequency to disk spectral values sometimes observed that no general statement about the relation of the QPO with any spectral parameter solely associated with the disk, such as thermal flux, temperature, inner radius, etc. can be made. For example, exceptions to one of the most widely quoted correlations, i.e. between disk flux and frequency, have been presented for the well studied micro-quasar GRS 1915+105 by Fiorito, Markwardt, & Swank (2003) and for XTE 1550-564 by Remillard et. al. (2002a,b).
On the other hand, a number of recent studies have revealed consistent and robust correlations between the photon index of the power-law component of the X-ray spectrum and low QPO frequency. Such strong correlations are observed the well-studied BH binary, GRS 1915+105 in almost all situations in which the QPO is observable and in several other BH’s over a wide range of observations and states.
These studies include:
a. A comprehensive study of correlations between photon index and QPO frequency in BH sources by Vignarca et al. (2003); these results show strong correlations between index and QPO frequency as well as saturation of the index between at the values and for several BH sources and for the same source in different states.
b. Recent studies by Kalemci (2002) for a number of galactic BH X-ray transients observed during outburst decay which confirm the persistence of the correlation between frequency and index during state transitions.
c. Our own studies of GRS 1915+105 of states (Fiorito, Markwardt, & Swank 2003), in which strong correlation of QPO frequency with power-law index have been observed; such states have been traditionally noted as low brightness, power law dominated states (see e.g. Belloni et al. 1999) where the disk is at least tenuous if not undetectable altogether.
d. Studies tracing the QPO frequency and index over time between state transitions shows that the frequency tracks the index during state evolution (Homan, et. al. 2001) and Sobczak et al. (1999, 2000) from a value of about to about , as the QPO frequency varies from about 1 to 10 Hz.
The persistence of the correlation of index with QPO frequency and its tracking with respect to time suggests that the underlying physical process or condition which gives rise to the low frequency QPO are tied to the corona; and, furthermore, that this process varies in a well defined manner as the source progresses from one state to another. Moreover, the fact that the same correlations are seen in so many galactic X-ray binary BH sources, which vary widely in both luminosity (presumably with mass accretion rate) and state, suggests that the physical conditions controlling the index and the low frequency QPOs are characteristics of these sources, and by virtue of the low-high-frequency correlations of PBK-BPK, may be a universal property of all accreting compact systems.
The above data have motivated us to develop a detailed model of the physics of the corona surrounding a BH s which directly predicts the behavior of the spectral index with fundamental properties of the corona. The model we have developed incorporates fundamental principles of fluid mechanics, radiative transfer theory and oscillatory processes. It identifies the origin of the QPO as a fundamental property of a compact coronal region near the BH and shows how the photon index of this corona changes as a function of mass accretion rate.
It has been already shown in a number of papers (see below) that the absence of the firm surface in the BHs leads to the development of the very strong converging flow when the mass accretion rate is higher than Eddington rate . The main observational features of the converging flow should be seen in high/soft phase, while the thermal Comptonization spectrum of the soft (presumably disk) photons should be seen in the hard phase.
In series of papers (Chakrabarti & Titarchuk 1995, hereafter CT95; Titarchuk, Mastichiadis & Kylafis 1996, 1997; Ebisawa, Titarchuk & Chakrabarti 1996; Titarchuk & Zannias 1998; Shrader & Titarchuk 1998, 1999; Borozdin et al. 1999; Laurent & Titarchuk 1999, 2001, hereafter LT99 and LT01 respectively; Titarchuk & Shrader 2002; Turolla, Zane & Titarchuk 2002) the authors argue that the drain properties of black horizon are necessarily related to the bulk inflow in BH sources and that the spectral and timing features of this bulk inflow are really detected in the X-ray observations of BHs. The signatures of the inflow are:
i. an extended steep power law where the photon index saturates to the value as the mass accretion rate increases - the precise value of the index is a function of the temperature of the flow but its relatively high value is a result of inefficient photon upscattering in the converging flow due to photon trapping. LT99 demonstrated that the spectral photon index varies in narrow range from 3 to 2.7 with mass accretion rate (in Eddington units) increases from 2 to 7. Moreover, LT99 demonstrated using Monte Carlo simulations that in the low hard state when the plasma temperature is of order 50 keV the bulk inflow spectrum is practically identical to thermal Comptonization spectrum (there is no any noticeable effect of the bulk Comptonization in the spectrum). In fact, the effect of the bulk Comptonization compared to thermal one is getting stronger when the plasma temperature drops below 10 keV. The small variation of the photon index around 1.7 is a characteristic signature of the low hard state that was pointed out in earlier work by CT95 and later it was confirmed by LT99.
ii. the QPO high frequency (100-300 Hz), which is inversely proportional to BH mass. It is worth noting that the QPO frequency scales as is a generic feature of any QPO model in which QPO frequency is scaled with the Schwarzchild radius.
Furthermore, Titarchuk, Osherovich & Kuznetsov (1999), hereafter TOK, presented observational evidence that the variability of the hard X-ray radiation in NS’s and BH’s occurs in a bounded configuration. Ford & van der Klis (1998) found that the break frequency in the power density spectrum (PDS) is correlated with QPO frequency for some particular NS sources (4U 1728-32). Wijnands & van der Klis (1999) later found a similar correlation in BH sources. Titarchuk & Osherovich (1999), hereafter TO99, and TOK explained this correlation in NSs and BHs respectively. They argue the observed PDS is the power spectrum of an exponential shot, which is the response of the diffusion propagation to any perturbation in a bounded medium. The inverse of the characteristic diffusion time and the normal mode QPO frequency has a well defined relation to the size of the bounded configuration, because and where is the specific pertrubation (magneto-sonic) velocity and is a charactestic size of the configuration (see TO99).
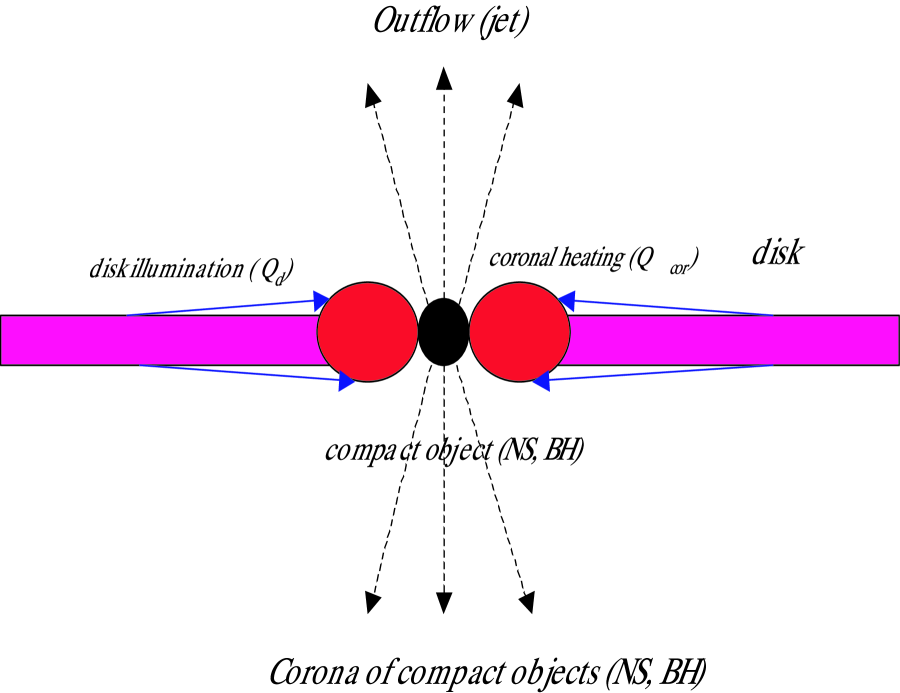
Titarchuk, Lapidus & Muslimov (1998), hereafter TLM98 proposed that this bounded configuration (cavity) surrounding compact objects is the transition layer (TL) that is formed as a result of dynamical adjustments of a Keplerian disk to the innermost sub-Keplerian boundary conditions. They argued that this type of adjustment is a generic feature of the Keplerian flow in the presence of the sub-Keplerian boundary conditions near the central object and that it does not necessarily require the presence or absence of a hard surface. TLM98 concluded that an isothermal sub-Keplerian transition layer between the NS surface and its last Keplerian orbit forms as a result of this adjustment. The TL model is general and is applicable to both NS and black hole systems. The primary problem in both NS and BH systems is understanding how the flow changes from pure Keplerian to the sub-Keplerian as the radius decreases to small values. TLM98 suggested that the discontinuities and abrupt transitions in their solution result from derivatives of quantities such as angular velocities (weak shocks). They were first to put forth the possibility of the transition layer formation to explain most observed QPOs in bright low mass X-ray binaries (LMXBs). In Figure 1 we illustrate the main idea of the transition layer concept for NS’s ans BH’s.
In this Paper, we explain the general correlation between photon index and low frequency in the frameworks of the transition layer model and we give more arguments for the nature of the spectral phases (states) and phase transition observed in BHs. The main features of the TL model are given in §2.1 The formulation of the problem of low frequency oscillations and the relationship with MA oscillations in the transition layer are also described in §2.1. The coronal model and the spectral index-optical depth relation is given in §2.2. The derivation of the low frequency-index correlation and the details of modeling of the spectral phase transition are present in §2.3. We analyze specific QPO and spectral data in terms of the TL model in §3. We discuss the signatures and the methods of the identification of BH and NS sources using timing and spectral characteristics in §4. Our summary and conclusions also follow in §4.
2 Transition Layer Theory
2.1 The main features of the transition layer model
TLM98 define the transition layer as a region confined between the the inner sub-Keplerian disk boundary and the first Keplerian orbit (for the TL geometry, see Fig. 1 and Fig. 1 in TLM98 and TOK). The main idea at the basis of our investigation is that a Keplerian accretion disc is forced to attain sub-Keplerian rotation close to the central object (a neutron star or a black hole). The transition between the Keplerian and the sub-Keplerian flow takes place in a relatively narrow, shock-like region [the size of the region of order radius of the central object (NS, BH)] where dissipation occurs. As a consequence, the gas temperature increases and the disc puffs up, forming a hot corona. Then the corona intercepts the soft disc photons, up-scatter them via thermal and dynamical Comptonization finally giving rise to the hard power-law tail.
The power-law index value strongly depends on the coronal optical depth and temperature (see CT95, TMK97, LT99). When the mass accretion rate in the disk increases and consequently the disk soft photon flux increases, the corona is drastically cooled down to a temperature of order 5-10 keV (in §2.2 we present a detailed analysis of this effect). For such a low plasma temperature the bulk motion of the converging flow is more efficient in upscattering disk photons than thermal Comptonization. Furthermore, the indices saturates to the asymptotic values around 2.7 as the mass accretion rate of the converging flow increases. The exact asymptotic value of the index is determined by the plasma temperature only (LT99).
TLM98 evaluate the size of the transition layer as a function of a nondimensional paramerer (often called the Reynolds number) which is the inverse of the parameter for the accretion flow (Shakura & Sunyaev 1973, hereafter SS73),
| (1) |
where is the accretion rate in the disk, is a half-thickness of a disk, is a characteristic radial velocity at a given radius in the disk, is electron (proton) number density , is the proton mass and is the diffusion coefficient. can be defined as using the turbulent velocity and the related turbulent scale, respectively or as for the magnetic case where is the conductivity (e.g. see details of the definition in Lang 1998). It is worth noting that the viscosity is a function of .
Because is related to and the TL Thomson optical depth , which is a product of (, are the TL inner and the outer radius respectively), electron number density and Thomson cross-section (namely, ) are both related to one can, in principle, determine as a function of parameter. Because of the uncertainties of the disk equation of the state, of the viscosity in the disk there is still uncertainty in the precise determination of this relation. We address to this issue in §2.3.
TLM98 determine the dependence using the equation of motion in the disk where the radial motion is controlled by friction and the angular momentum exchange between adjacent layers, resulting in the loss of initial angular momentum by the accreting matter (e.g. SS73). We define an adjustment point where a Keplerian accretion disc is forced to attain sub-Keplerian rotation close to the central object (NS or BH). In order to determine the adjustment radius one should solve this equation of motion subject to three boundary conditions – one at the innermost disk radius and two at the adjustment radius – namely, at the disk rotational frequency matches the rotational frequency of the central object (spin), at there is no break in the rotational frequency and the left-hand and right-hand side derivatives of R are equal. Thus, for a given value of parameter the rotational frequency profile and the outer radius of the transition layer are uniquely determined by the three boundary conditions and the equation of motion (see for example, Eqs. 8-9 in T099).
The adjustment of the Keplerian disk to the sub-Keplerian inner boundary creates conditions favorable for the formation of a hot plasma outflow at the outer boundary of the transition layer, because the Keplerian motion (if it is followed by sub-Keplerian motion) must pass through the super-Keplerian centrifugal barrier region (TLM98).
The equation (see TLM98, Eq. 11, or TO99, Eq. 9) determines as a function of . For given values of one can find values of the Keplerian frequencies (see Eq. 1 in TO99). For example for the observed range of the high QPO frequencies in BH sources, from 1 to 100 Hz (the low QPO frequencies from 0.1 to 10 Hz) (see Fig. 2), and for a BH mass of ten solar masses one can find from TLM98 Eq. (11) that varies from 2 to 20 (a variation which is related to the mass accretion rate see Eq. 1). We remind a reader that in the framework of the TLM these high QPO frequencies are interpreted as Keplerian frequencies at .
It is worth noting that in the literature is treated as a constant and a free parameter independent of the mass accretion rate (or the spectral state), whereas we find that varies from 0.5 to 0.05 with , i.e. is a very strong function of .
Soria (1999) inferred the effective value of the viscosity parameter as a function of the magnetic field. He showed that regardless of the true viscosity in the disk the parameter is always higher than if the ratio of the magnetic pressure to the gas pressure is about 10% and more. Below (see also TW02 for details) we show that using the low frequency-high frequency correlation the inferred ratio of that is consistent with the values of and the Soria’s predictions of the high values of as
The TL model identifies the low frequency QPO as that associated with the viscous magnetoacoustic (MA) oscillation of the bounded TL; this mode is common to both BH’s and NS’s. The correlation of the MA frequency with the gravitational (Keplerian) frequency were derived by TO99, Titarchuk, Bradshaw & Wood (2001) for NS and then it was generalized by TW02, for BH and WD. The MA frequency is derived as the eigenfrequency of the boundary-value problem resulting from a MHD treatment of the interaction of the disk with the magnetic field. The problem is solved for two limiting boundary conditions which encompass realistic possibilities. The solution yields a velocity identified as a mixture of the sound speed and the Alfvén velocity. The TBW treatment does not specify how the eigenfrequency is excited or damped. However, it makes clear that the QPO is a readily stimulated resonant frequency [see Titarchuk, Cui & Wood (2002) and Titarchuk (2002) for details of excitation of the eigenfrequencies].
A linear relation was derived between and (see Fig. 2 and TW02)
| (2) |
where is a proportionality coefficient which is “universal” to the extent that and remain about the same from one source to the next. Here is the ratio of the gas pressure to the magnetic pressure and the coefficient for stiff and free boundary conditions respectively and is the half-width of the Keplerian part of the disk.
Identification of , with respectively, leads TW02 to determination of and using the observed value of . On the other hand at the adjustment radius as of function of parameter can be readily obtained using Eq. (9) in TO99 [see above for details of determination]. Thus, as a result of the identification of with , we obtain the relation of as a function of , namely
| (3) |
In Figure 3 we present the inferred as a function of . We derive this relation using equations (9) in TO99 with the assumptions that (see Eq. 7 in TO99 for definition ) and .
It is evident that the inferred are inversely proportional to because
| (4) |
and
| (5) |
where is the TL characteristic size which is proportional to .
We calculate the outer radius of the TL, as a function of using relations [Eq.2 (or Eq. 3) here and Eqs. 1, 9 in TO99], keeping in mind that . Because the radius of interest, which in our case is the outer TL boundary radius , is related to one can relate to using formula (3). We present this function in Figure 4.
The spectral indexfrequency correlation can be derived if we find a spectral indexTL optical depth correlation. Because is is a function of the mass accretion rate and the optical depth is a function of , we are lead to a correlation of and and ultimately to the indexfrequency correlation. It is worth noting that and dependences on implies that a correlation between these quantities exist but does not mean a linear correlation between and because parameter also depends on the accretion flow viscosity which is also a function of .
2.2 Spectral index-optical depth relation. Corona model
The TL model first proposed by TLM98 naturally provides a compact corona for Comptonization upscattering of the illuminating accretion disk photons which is just the region of adjustment of Keplerian accretion flow (disk) to the sub-Keplerian innner boundary condition. The essential sub-Keplerian rotation of NS in LMXBs is a well established observational fact due to the direct measurements of NS spins (which are in the range of 200-400 Hz, see the review by van der Klis 2000 for details). Thus it is quite reasonable that the presence of a TL for NSs exists. In the case of BHs no direct spin measurements are yet available and hence the presence of the TL may at first glance seem less clear. On the other hand, the Bulk Motion Comptonization model which requires the existence of the innermost region of non Keplerian flow onto a slowly rotating or static Schwarschild BH, is very consistent with observations and in fact its signature is the saturation of the photon index which is observed (see LT01 for details) and thus one can conclude that fast rotating Kerr BH is ruled out by the observations. In fact, there is no space between the the inner edge of the disk and the horizon in the fast rotating Kerr BH to upscatter the disk soft photons by the bulk motion to the energies of order 500 keV that are detected in the high energy observations (Grove et al. 1998). Thus we can reasonably conclude that BH may also undergo sub-Keplerian rotation and the existence of a TL for slowly rotating BHs.
It is likely that this adjustment to sub-Keplerian flow is not smooth and that near the adjustment radius the strong or weak shocks can be formed. The adjustment radius (shock) region can be treated as a potential wall at which the accreting matter releases its gravitational energy in a geometrically thin target. As a consequence of this the shock plasma temperature is much higher than that in the surrounding regions of the Keplerian disk. The shock region gets puffed up oscillating with frequencies close to (Titarchuk 2003). Additional oscillations can appear (at least in NS case) because of the rotational configuration above the disk which is a magnetosphere in NS case (see details in TOK). The shock formation leads to the formation of the hot inner bounded region. The hard photons in the shocked region illuminate the surrounding material evaporating some part of the disk. It is obvious that the evaporated fraction depends on the mass accretion rate in the disk (see CT95). Some small fraction of the hard photons (at maximum 6 %) can be reflected by the cold parts of the disk (CT95 and see also Basko, Sunyaev & Titarchuk 1974).
Let us assume the column density of this region is a few grams or that the Thomson optical thickness is a few (see SS73 for the thickness estimate of the innermost part of the disk). The rate of energy release at this region is a few percent of the Eddington luminosity since the adjustment radius is located within 4-100 Schwarzschild radii (see Fig. 4). The heating of gas due to the gravitational energy release should be balanced by the photon emission. For high plasma temperature, Comptonization and free-free emission is the main cooling channel, and the heating of electrons is presumably due to the Coulomb collisions with protons (see Fig. 1 for the picture of disk corona).
Under such physical conditions the energy balance can be written as [see also Zeldovich & Shakura (1969), hereafter ZS69 and TLM98]
| (6) |
where is the optical depth within the shock, is a distribution function for the radiative energy distribution, is the relativistic correction factor, is the electron temperature in K, cm s-1 K-1 and erg K-1/2cm s-1 are a dimensional constants. In this formula we neglect the gas heating due to recoil effect.
The distribution is obtained from the solution of the diffusion equation (ZS69),
| (7) |
subject to two boundary conditions. Here we assume that the region of the gravitational energy release (corona) is a spherical shell surrounding the central object and the total flux in the corona is a sum of the gravitational energy release and the illumination flux from outside of the corona (disk) . The inner and outer boundary conditions for a BH corona are that there are no scattered radiation from outside of the corona. Then in the Eddington approximation (see Sobolev 1975) the boundary conditions can be written as follows :
| (8) |
where and are at the inner and outer boundaries respectively.
For a NS corona one should assume that inside of the inner corona boundary the energy density constant, namely that the radiation flux emitted towards the central object at some point of the inner boundary returns back (reflected by the NS surface), namely this condition is equivalent to the reflection condition:
| (9) |
Below we present a general formula of the coronal temperature which combines the BH and NS cases.
The solution of equations (7-8) provides us with the distribution function for the energy density in the BH corona
| (10) |
We neglect the dependence of on to derive this formula. Furthermore, we take a representative value of for the maximum value in the corona which is very close to mean value of i.e.
| (11) |
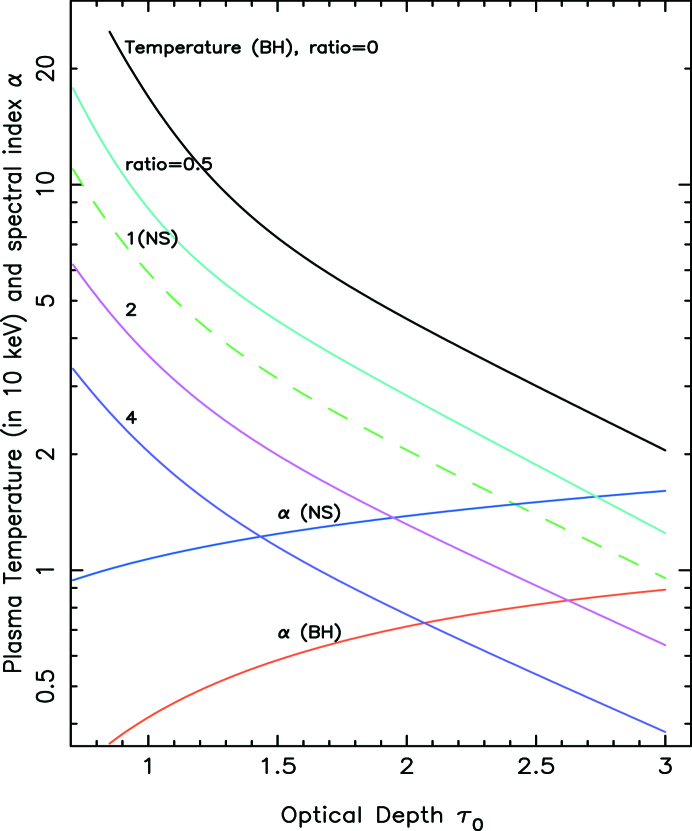
in order to approximate the coronal temperature. In Figure 5 we present the results of calculations of the temperatures (keV) and the energy spectral indices of the Comptonization spectrum (photon index ) as a function of the optical depth of the shell . The different curves of are related to the different ratios of . The calculations have been made for values of g cm-3 and erg cm-2 s-1 which are characteristic values of the density and luminosity for the standard disk model (SS73). In fact, the calculation results weakly depend on and if
is of order a few or less. In this case the equation for the temperature is simplified
| (12) |
which has the solution
| (13) |
It is easy to show that the case for which is identical to the NS case (the inner reflective boundary) when the disk illumination is neglected. One can see from Eq. (13) that is a function of (only) if . It is also worth noting that is insensitive to the total luminosity if (Eq. 12).
The spectral index as a function of the product of are insensitive to too for because the the Comptonization parameter
and
(see Rybicki & Lightman 1979 and Sunyaev & Titarchuk 1980). This inferred property of the Comptonization spectra reproduces the observed independence of on the bolometric luminosity (see e.g. Tanaka 1995) when varies within the range (). This defines the so called the low/hard state in BHs.
Below we show that the observed plateau of the index-frequency correlation at low values of Hz is the result of this behaviour because the lower frequency values are related to the low mass accretion rates and is of order one when .
We calculate the exact values of the spectral indices for a given and using the relativistic formulas developed by Titarchuk & Lybarskij (1995) [see formulas (17), (for plane geometry, note their is our ) and (24) there]. In Figure 5 we present the spectral indices as a function of for BH and NS cases when the disk illumination is negligible small with respect to the coronal energy release (a condition which can be a model for the low/hard state in these systems). The plasma temperature values of 20-150 keV for and (for ) are typical values of these quantities for low/hard state in BHs.
When is comparable with the cooling becomes more efficient due to Comptonization and free-free processes and therefore unavoidably decreases [see values for in Fig. 5].
This illumination effect and mass accretion rate increase may explain the hard-soft transition when the Compton temperature drops substantially with increase of the soft (disk) photon flux (for illustration, see Figure 1 ). In Figure 5 we show that temperature drops from 50-60 keV for to 7-10 keV for . The temperature may drop also due to an increase in the optical depth (presumably because increases) even when .
2.3 Modeling of spectral phase transition from the hard state to the soft state
LT99 studied the Comptonization of the soft radiation in the converging inflow (CI) into a black hole using Monte Carlo simulations. The full relativistic treatment has been implemented to reproduce the spectra. LT99 show that spectrum of the soft state of BHs can be described as the sum of a thermal (disk) component and the convolution of some fraction of this component with the CI upscattering spread (Green’s) function. The latter boosted photon component is seen as an extended power law at energies much higher than the characteristic energy of the soft photons. LT99 demonstrate the stability of the power law index (the photon index, ) over a wide range of the plasma temperature 0-10 keV, and mass accretion rates (higher than 2 in Eddington units) due to upscattering and photon trapping in the converging inflow. The spectrum is practically the same as that produced by standard thermal Comptonization when the CI plasma temperature is of order 50 keV (the typical ones for the BH hard state) and the photon index is around 1.7
LT99 also demonstrate that the change of the spectral shapes from the soft state to the hard state is clearly related to the temperature and optical depth of the bulk inflow. We combine our results of calculations of index and Compton cloud temperatures for thermal Comptonization case (see §2.2 and Fig.5) and LT99’s results of the spectral calculations (see Table 2 in LT99 for the spectral index values) to evaluate the power law index as a function of the optical depth of the Compton cloud . We use the values of the index and of the temperature for (see Fig. 5) when varies from 1 to 3 to decribe the index behavior and the plasma temperature variation in the hard state. Figure 6 presents the photon index as a function of . This function can be fitted analytically as follows:
| (14) |
where and , and .
In order to derive the index dependence on one should relate the parameter to and then combine the two derived relationships vs and vs (see Figures 3-6 ). The optical depth and parameter are functions of . To fit the data we assume that . We have three free parameters, black mass , and to fit the model to the data if we assume that the converging inflow (CI) is essentially cold (the CI temperature keV). This relationship is all that is needed to fit the observed correlations.
3 Data and Analysis
We analyze data points for photon index vs low frequency correlation obtained from Trudolyubov et al. (1999) and Vignarca et al. (2003) for GRS 1915+105 and Sobczak et al. (1999, 2000) for XTE J1550-564. Also we make use data for GRS 1915+105 by Fiorito, Markwardt & Swank (2003) hereafter FMS, which is a detailed study of QPO and spectral features of the steady low hard states of GRS 1915+105 for representative 1996 and 1997 observations. FMS computed the power spectra of combined Binned and Event Mode data for PCA channels 0-255 and sampled at 0.25-64 Hz for 4-second intervals. The spectra were averaged over the entire observation duration. The PDS spectra were fit with a combination of Lorentzian lines and exhibited a break frequency, a central QPO frequency and in some case the presence of the first harmonic. Background subtracted energy of each OBSID were obtained and time average over the entire observation duration using Standard 2 PCA and HEXTE data where available (both clusters). The XSPEC model used to fit the energy spectra consisted of a multi-temperature thermal disk component (DISKBB), a simple power law and a small Iron line component. For the 1996 data (OBSID10408), it was found that the disk component could be neglected without affecting the fit. Acceptable were obtained in all cases.
3.1 Correlations between QPO Frequency and Spectral Parameters
The first part of the FMS study was to first to look for correlations of different spectral components, presumably thermal disk components, with QPO frequency to try to determine the reason for the non-unique total flux correlations previously observed. In the case of OBSID 20402 (1997) we did observe the expected positive correlation of QPO frequency with disk flux in agreement with previous analyses of Muno et al. (1999) and Markwardt et al. (1999), which were done in other states. However, we observed an anti-correlation of frequency with disk flux for OBSID 10408 (1996); and no correlation of frequency with disk flux for OBSID 10258 (1996). Furthermore, no correlation of QPO frequency with disk temperature is seen for any of the OBSIDS we studied. These results are at variance with the often-quoted result that disk parameters are closely associated with QPO frequency. Remillard, et. al. (2002b) show a comparison of low QPO frequency and the apparent disk flux for the source XTE J1550-564 during its 1998-1999 outburst. The QPOs are reported with differences in phase lags. Again, it is clear that a frequency-disk flux correlation is observed for this source is only observed at lower ( Hz) QPO frequencies and fluxes than usually observed for GRS 1915+105.
However, robust correlation between index and the central frequency of low frequency QPOs are also seen in a wide variety of BH sources radiating in different states and during transition between states. The QPO frequencies in such studies are observed in the PDS obtained by integrating over time intervals ranging from the complete time of the observation to segmented time bins where the luminosity remains constant, [see e.g. Markwardt, et. al (1999)]. Strong frequency-index correlations are observed by Kalemci (2002) in outburst decay (presumably state transitions) of a number of sources and by Vignarca, et. al. (2003), in a comprehensive study which focuses its attention on the behavior of the power law index and QPO frequency in several BH candidate sources. We will use the data of Vignarca, our studies and that of other as well in our analysis (see §3.2 below).
Observation of low term tracking of the QPO frequency with the variations of the photon index has been observed in at least two BH sources. Tracking is seen in the data of Rossi (2003) and Homan (2001) in observations of XTE J1560-500 taken over a 30-day period. In this period the source apparently transits from the low hard state () to the intermediate state and the soft state where the index apparently remain close to the constant at a value ( ). In this transition the QPO frequency varies from about 1 to 10 Hz. Similar tracking is observed in XTE J1550-564 by Sobzcak et al. (1999), (2000). However, the index and QPO frequency does not track with the total X-ray flux (Vignarca et al. 2003, Figure 7).
3.2 Comparison of the inferred index-frequency correlation with the data. Low/Hard-High/Soft State Transitions
GRS1915+105
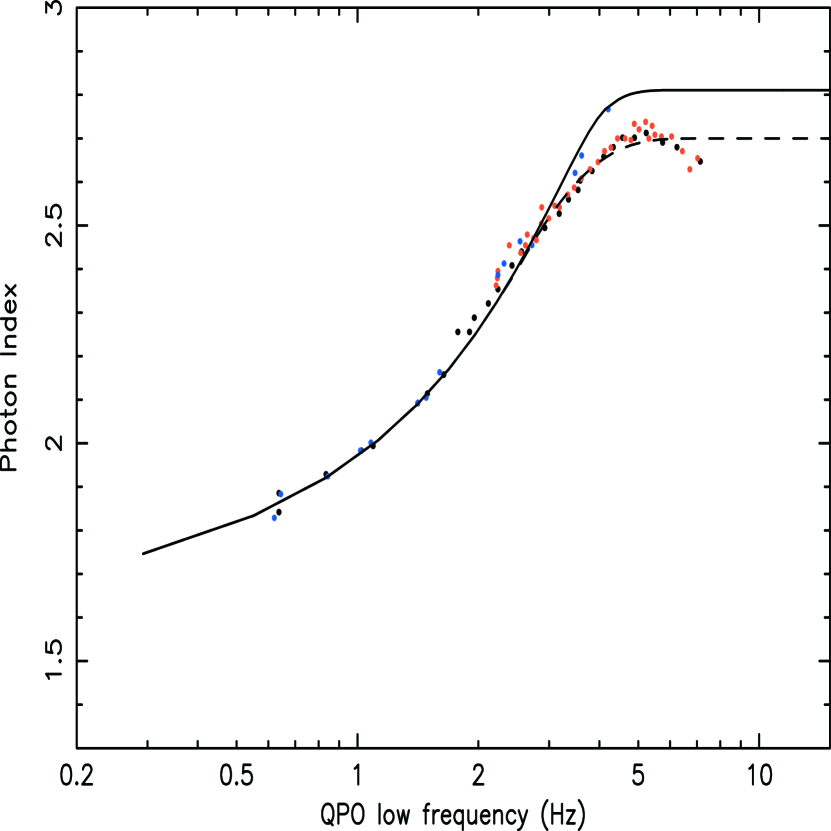
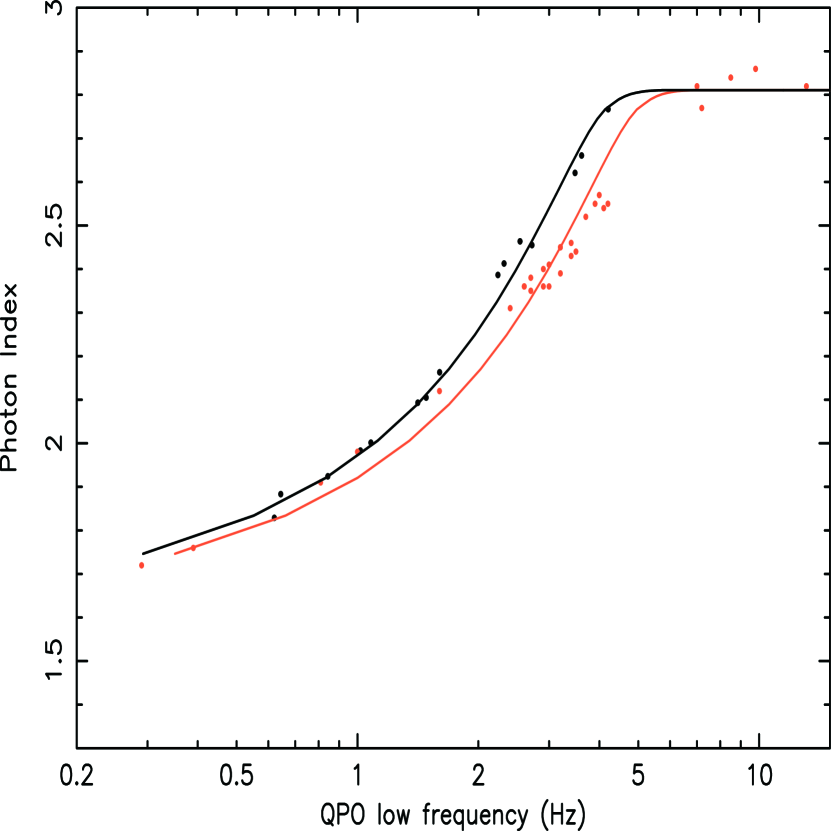
In Figure 7 we present the results of our fits to the data of Vignarca, et. al (2003) for the plateau observations of the microquasar GRS 1915+105 using the TL model. The best fit parameters are , and . We note that the value is consistent with the BH mass evaluation obtained by Greiner et al. (2001) using the IR spectra and by Shrader and Titarchuk (2003) (see also Borozdin et al. 1999) using the X-ray spectra. The observable index saturations at low and high values of are nicely reproduced by the model. The low and high frequency plateau regions of the data and fit are signatures of the two spectral phases which are explained by two different regimes of Comptonization ( upscattering): (1) bulk flow Comptonization in the soft state ( saturation at ) and (2) thermal Comptonization in the hard state ( the photon index tends to level at ).
A comparison of the index-frequency correlation of plateau observations with Vignarca’s and data [Belloni (1999) classification scheme] and the model fits are plotted in Figure 8. The only difference in the data is different saturation values at high that can be readily explained by a change of plasma temperature in the converging inflow . For upper value of the temperature keV as for the temperature keV. The best-fit parameters for the latter data are the same as for the plateau observations except that in the model function (see Eq. 14) the coefficents , and are replaced by , and for .
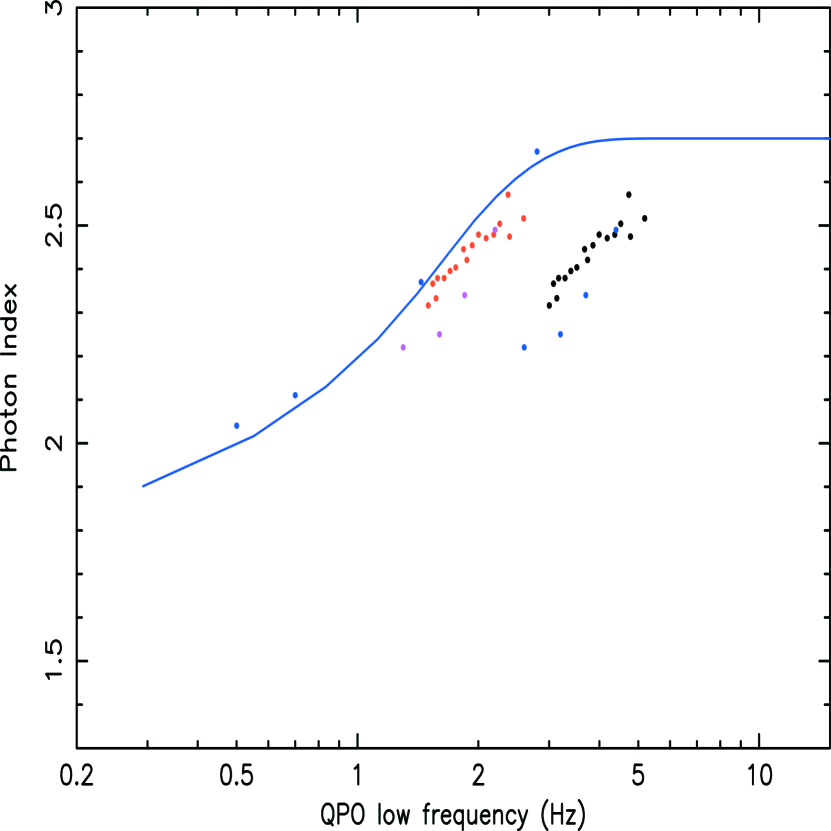
In Figure 9 we present a plot of power-law index versus QPO centroid frequency for the observations of class and of GRS 1915+105 from Vignarca et al. (2003) (black points=obs. 18). Blue points correspond to the values for observations by Fiorito et al (2003) for OBSID 20402 and OBSID 10258. Magenta points correspond to positions where the OBSID 20402 data points are shifted to one half the measured QPO low frequency values. This suggests that the latter data points are related to the second harmonics of the frequencies. It is well known that data for NS QPOs is a mixture of the first and the second harmonics of horizontal branch oscillation (HBO) frequencies (see e.g. van der Klis 2000). Red points correspond to positions where should be points with half of frequencies for Vignarca’ s obs. 18. A theoretical curve (blue solid line) obtained using (see Eq. 14) (for coefficents , and for ) for and fits the FMS OBSID 10258 data points.
It is worth noting that relation between and is slightly different from that we obtained for the best-fits presented in Fig. 8. Namely, the index of , increases from 1.25 to 1.5. It means that for the same value of the optical depth is slightly higher than that in state presented in Fig. 8. This change can be explained by a slightly higher accummulation of plasma in the transition layer. For example, if we fix the disk viscosity , then the parameter is determined by only. But the mass accretion rate depends on the product of number density and the flow radial velocity , i.e . Thus, for a given value of the optical depth varies as varies. Smaller values of corresponds to the higher values of and consequently to higher values of , namely higher plasma accummulation in the transition layer can be related to smaller velocities .
It is interesting to note that the suggested half-frequency points (magenta and red ones) are located in a narrow corridor between these inferred curves (presented in Fig. 8 and Fig. 9 respectively).
XTE J1550-564
Figure 10 shows a plot of power law index versus QPO frequency for XTE J1550-564. All data points presented in Figures 10, 11 see also (see also Fig. 6, 8 in Vignarca et al.) were obtained by Sobczak et al. (1999), (2000); Remillard et al. (2002a,b).
The data again show a flattening out or saturation of the index at a value . It is clearly seen from Fig. 8 of Vignarca et al. that most of the points presented there can be fit by a smooth line except for a few points on the right that we temporarily exclude from our consideration. The shift transformation of the GRS 1915+105 curve, (see Fig. 7) into produces a fit for the XTE 1550-564 data. This means that if two sources are in the same accretion regime [i.e. when is the same] their relative BH masses can measured by the simple shift transformation . In our case we use for GRS 1915+105 and for XTE 1550-564. These values are very close to the values that have been obtained by Shrader & Titarchuk (2003) for these sources using X-ray spectroscopic methods (Shrader & Titarchuk 1999). Thus the TL model provides an independent way to estimate the mass of one or more BH’s in the same accretion state.
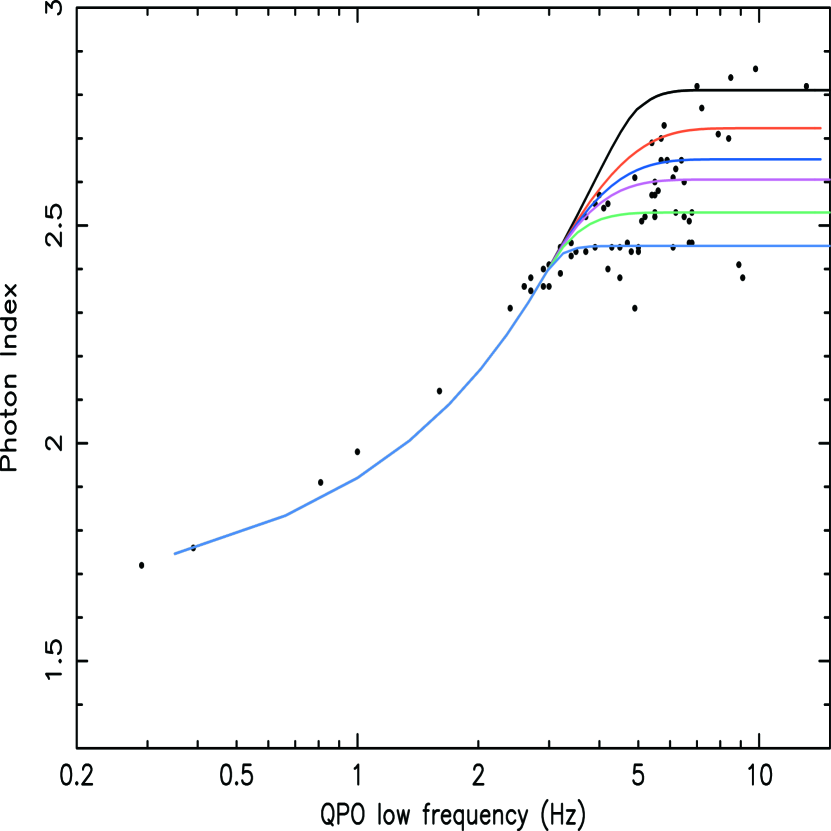
A comparison of all data points of correlating photon index vs QPO low frequency for XTE 1550-564 (black points) with the inferred correlation is shown in Figure 11. The saturation index value in the theoretical curve is related to specific value of the plasma temperature of the converging inflow , which changes from 5 keV to 20 kev from the top curve to the bottom respectively. Slightly different cooling regimes of the site of the converging bulk inflow can explain the different saturation levels of the index observed in XTE 1550-564. The temperature of the converging inflow is determined by the disk illumination geometry and by the intrinsic heating of the flow by pairs produced very close to the BH event horizon (see Laurent & Titarchuk 2004). All these effects may be manifested by the observed index-frequency correlation at high values of .
4U 1630-47
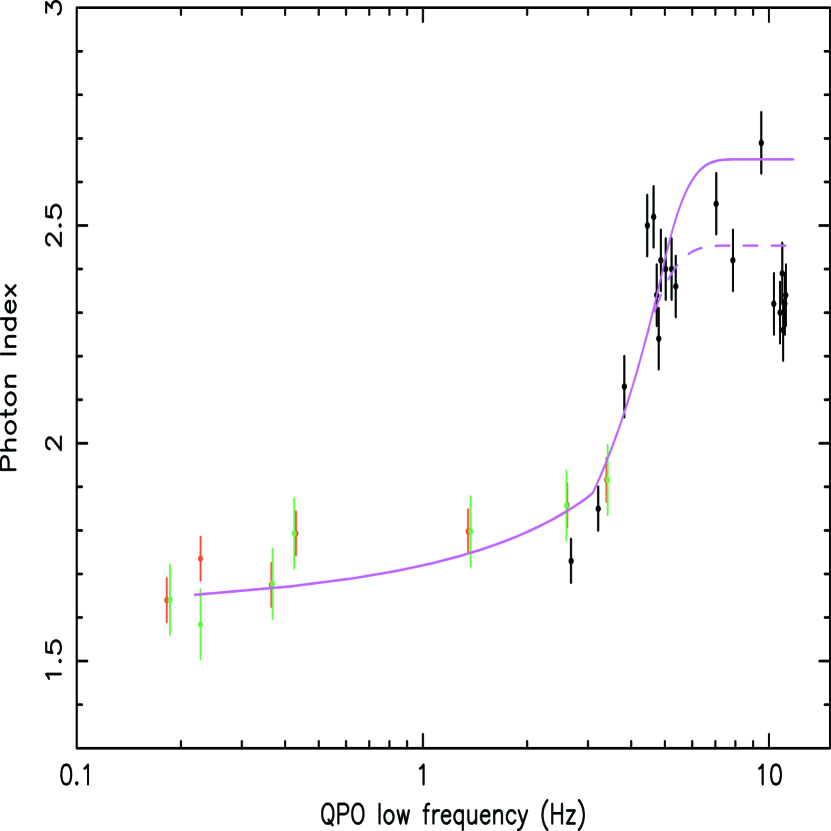
Figure 12 shows a plot of index versus QPO frequency for 4U 1630-47 [Trudolyubov et al. (1999); Tomsick & Kaaret (2000), Kalemci (2002)]. The data again show a similar behavior to that of XTE J1550-564 with an index saturation at and . One can see two phases with the index level at and and a transition between them that is much sharper than that observed in the other sources dicussed above. The best-fit curve (solid line) is obtained using for and for and function (see formula 14) for the best-fit BH mass which is close to the estimate made by Borozdin et al. (1999) using the X-ray spectroscopic method. The solid and dash curves are for saturation index value (related to keV) and (related to keV) respectively. Coefficients , and for and for solid and dash curves respectively.
Our explanation for the observed anomalously sharp transition of the spectral index is as follows. Because at the sharp spectral transition QPO frequencies do not change we can speculate that the TL size also does not change at the sharp transition. But if the TL size is almost the same then the parameter is almost the same because the TL size depends on parameter only (see section 2.1). But the spectral index is a function of and the TL plasma temperature. If the index rises drastically this means that upscattering is also drastically suppressed during the transition. Then we have only one possibility i.e. that we are observing a sharp switching from the thermal Comptonization to the Bulk Motion Comptonization regimes. At the end of this transition we see a signature of the Bulk inflow in terms of the index saturation. The Bulk Motion Comptonization is dominant when the plasma temperature drops significantly to the value of order 10 keV. This can happen when a strong cooling emerges either because the optical depth increases due the accumulation matter in the transition layer or because an additional source of cooling such as a soft photon supply from the disk appears (see investigation of these cases in section 2.2). The latter case can be realized if the corona intercepts more disk soft photons due to a puffing up of the disk or a build up of the disk beneath the corona.
4 Discussion and Summary of the Results
We have developed a model of accretion onto a Black Hole which greatly simplifies and reclassifies the plethora of “states” observational assigned to categorize the X-ray observations of variable BHC into two generic phases (states):
I) soft state where we see the effect of the BH as a “drain”. Bulk inflow upscattering of disk photons dominates the behavior of the BH spectrum. The power law spectrum is steep in this situation. The observed high energy photons are emitted from a compact region, where soft energy photons of the disk are upscattered by bulk matter inflow forming the steep power law with photon index around 2.8, and low QPO frequencies (above 10 Hz) and high QPO frequencies (of the order of 100 Hz) are observed. In terms of the relativistic particle acceleration in the region of the corona and its effect on upscattering the soft disk photons, the soft state spectrum is a result of the first order Fermi acceleration with respect to , i.e. a relative photon energy change . We would like to emphasize that bulk inflow is present in BH when the high mass accretion is high but not in NS, where the presence of the firm surface leads to the high radiation pressure which eventually stops the accretion. The bulk inflow and all its spectral features are absent in NSs, in particular, the saturation of the index with respect to QPO frequency, which is directly related to the optical depth and mass accretion rate, observed in the soft spectral state of only BHs and is therefore a particular signature of a BH.
II) hard state, which is comparatively starved for accretion. The hard phase (state) is related to an extended thermal Compton scattering cloud (cavity) characterized by a photon index and the presence of low QPO frequencies (below 1 Hz). The low-hard spectrum is a result of the Fermi acceleration of the second order with respect to , i.e. . The effect of the first order on is smeared out by the quasi-symmetry of the particular dynamic, predominantly thermal motion of the Compton cloud plasma.
The Transition Layer Componization Model: i. specifies the precise behavior of the power law index for each state; ii. identifies the origin and nature of low frequency and high frequency QPOs; iii. predicts and explains the observed relationship between them and their dependence mass accretion rate and spectral photon index for each of the phases; iv. predicts and explains the observed robust correlation of low frequency QPOs with spectral index observed in BHCs; v. predicts and explains the observed correlation between low and high frequency QPOs in BHs, neutron stars and white dwarfs. We interpret the correlation between low frequency and power-law photon index investigated by Sobczak et al. (1999), (2000); Remillard (2000b); Homan et al. (2001); Kalemci (2002), Vignarca et al. (2003) and Fiorito, Markwardt & Swank (2003) for a variety of BH sources and states. The observed correlation strongly constrains theoretical models and provides clues to understanding the nature of the QPO phenomena particularly in BHs and in compact objects in general.
The key assumptions and limitations of the model are:
i. a sub-Keplerian rotation of central object (NS and BH) which is observationally well established fact in NSs of LMXB but it still needs verification for BHs. However the existence of an adjustment region i.e. the TL is quite reasonable assumption for all but very rapidly rotating BHs. Unfortunately up to now there is no direct measurement of a BH spin.
ii. Our fit to the data uses the model predicted dependence of the index on the TL optical depth and the model predicted dependence of the QPO frequencies on the parameter. It is clear from the model that and are correlated but within TLM model one can not determine the exact dependence because of the uncertainty of the disk equation of the state and the viscosity in the disk. Therefore we have determined the relation by fitting the observed data, i.e. the correlation between the QPO low-frequency and the photon spectral index. As a result of our analysis of the observed index-QPO correlation we conclude that the function is almost the same for GRS 1915+105 and XTE J1550-564 but it is drastically different for 4U 1630-47. For this source the inferred shows a very strong dependence of on the QPO frequencies produced during a sharp spectral state transition. We speculate that this peculiar behavior of the index vs QPO frequency and consequently the inferred vs is a result of the plasma accumulation in the transition layer. It is possible that a similar index-frequency correlation can be detected in other sources.
iii. The model fits to the data gives us the relatively low values of (corresponding to viscosity parameter from to 0.05 to 0.5). Such low values of can be understood in the framework of MHD treatment of the disk viscosity. In fact, Soria (1999) inferred of order 0.1 (regardless of the true disk viscosity) and higher if in the disk a magnetic pressure is 10% of the gas pressure or higher.
iv. Within TLM one can estimate the absolute normalization of the magnetoacoustic (QPO low) frequencies (see e.g. TBW01) but a more precise normalization can be only obtained using the observed low-high frequency correlation (see Fig. 2).
v. In some very soft (or extended power law) regimes the positive correlation of frequency and index appears to be unbounded, i.e. there is no indication of saturation of the index value (FMS). Explanation for this effect is out of scope of the present TL model. We can only suggest here that the extended power law regime occurs when strong outflows obscure the bulk inflow and the relatively cold outflow from winds downscatters the emerging high energy photons and soften the observed spectrum (we will provide the details of this picture elsewhere).
vi. Vignarca’s Figure 6 plots the indexfrequency for two sources XTE J1550-564 and GRO J1655-40 together. The behavior of the later sources is quite distinct from all others analyzed - it shows a reverse or negative correlation between photon index and frequency. This is the only case known to exhibit this type of behavior. We propose that at a high accretion rate regime the pair production heating adds to and can dominate the heating in the cavity causing a transition back to thermal Comptonization phase. In this phase a reverse correlation between low QPO frequency can result and is our explanation of the single case where this phenomena is observed. Further theoretical investigation of this case will be addressed in future studies.
The main results of this paper are:
(1) We find that the observed low frequency - the index correlation is a natural consequence of an adjustment of the Keplerian disk flow to the innermost sub-Keplerian boundary conditions near the central object. This ultimately leads to the formation of the sub-Keplerian transition layer (TL) between the adjustment radius and the innermost boundary (the horizon for BH).
(2) In the framework of the TL model is related to the gravitational frequency at the outer (adjustment) radius and is related to the magnetoacoustic oscillation frequency . Using a relation between and the mass accretion rate and the photon index and the mass accretion rate we infer a correlation between and the spectral index .
(3) Identification of with , allow us to make a comparison of the theoretically predicted correlation with the observed correlation. For this identification we use the one temperature plasma assumption. We apply the plasma temperature obtained from the Comptonization spectra (electron temperatures) for calculations of magnetoacoustic frequencies which strongly depend on the proton temperature. The one temperature assumption is quite consistent with the data.
(4) We present strong arguments that in BHs the two particular distinct phases occur in which one of them, the steep power-law phase is the signature of a BH.
(5) We found that a hard phase (state) related to an extended Compton cloud (cavity) characterized by the photon index around 1.7 and the low QPO frequencies below 1 Hz. This is the regime where thermal Comptonization dominates the upscattering of soft disk photons and the spectral shape (index) is almost independent of mass accretion rate.
(6) We find that the soft phase (state) is related to the very compact region where soft energy photons of the disk are up scattered forming the steep power law spectrum with photon index saturating around 2.8. This is the regime where Bulk Motion Comptonization dominates and the effect of an increase in the mass accretion is offset by the effect of photon trapping in the converging flow into the BH.
(7) In the context of distinquishing between NS and BH sources we would like to note the following for low hard states. The source can only be a NS if a soft blackbody-like component with the color temperature of order of 1 keV is observed in the spectrum (Torrejon et al. 2004). On the contrary, such a high temperature is necessarily related to a high disk luminosity in the case of a BH and this case is never observed for BH’s in the low hard state
(8) We offer a new method of BH mass estimation using the index-frequency correlations; namely, if the theoretical curve of the index-frequency dependence related to the BH mass parameter fits the data for a given source then the simple slide of the frequency axis with respect to may allow us to obtain the mass by fit of to the observed correlation for another source.
We acknowledge Tomaso Belloni for kindly supplying us data published in Vignarca et al. (2003). We also acknowledge and thank the referee for his/her suggestions to clarify our results and explain the limitations of our model.
References
- (1) Basko, M.M., Sunyaev, R.A., & Titarchuk, L. , 1974, A&A, 31, 249
- (2) Belloni, T., 2003, astro-ph /0309028
- Belloni et al. (2002) Belloni, T., Psaltis, D., & van der Klis, M. 2002, ApJ, 572, 392 (BPK)
- Belloni,et.al. (2000) Belloni, T., et. al. 2000, A&A, 355, 271
- Boirin et al. (2000) Boirin, L., Barret, D., Olive, J.F., Bloser, P.F., & Grindlay, J.E. 2000, A&A, 361, 121
- Borizdin et. al. (1999) Borizdin,K., et. al. 1999, ApJ, 517, 367
- Chakrabarti and Titarchuk (1995) Chakrabarti, S.N. & Titarchuk, L. 1995, ApJ, 455, 623 (CT95)
- Ebisawa, Titarchuk and Chakrabarti (1996) Ebisawa, K. , Titarchuk, L. and Chakrabarti, S. 1996, Publ. Astron. Soc. Jpn. 48, 59
- Di Salvo et al. (2001) Di Salvo, T., Mendez, M., van der Klis, M., Ford, E., & Robba, N.R. 2001, ApJ, 546, 1107
- Fiorito, Markwardt and Swank (2003) Fiorito, R., Markwardt, C., Swank, J. 2003, HEAD03 (FMS)
- Ford & van der Klis (1998) Ford, E., & van der Klis, M. 1998, ApJ, 506, L39
- Greiner et al. (2001) Greiner, J., Cuby, J.-G., McCaughrean, M.J. 2001, Nature, 414, 522
- (13) Grove, J.E., 1998, ApJ, 500, 899
- Homan et al. (2001) Homan, J., et al. 2001, ApJS, 132, 377
- (15) Kalemci, E., 2002, Thesis, UC San Diego
- Lang (1998) Lang, K. R., 1998, Astrophysical Formulae, (Berlin: Springer)
- Laurent & Titarchuk (2004) Laurent, P. & Titarchuk, L. 2004, in preparation
- Laurent & Titarchuk (2001) Laurent, P. & Titarchuk, L. 2001, ApJ, 562, L67 (LT01)
- Laurent & Titarchuk (1999) Laurent, P. & Titarchuk, L. 1999, ApJ, 511, 289 (LT99)
- Markwardt,et. al. (199) Markwardt, C. et al. 1999, ApJ, 513, L37
- McClintoch and Remillard (2003) McClintock, J. and Remillard, R. 2003, astro-ph/0306213
- Mauche (2002) Mauche, C. 2002, ApJ, 580, 428
- Morgan, Remillard & Greiner (1997) Morgan, E.H., Remillard, R.A., & Greiner, J. 1997, ApJ, 482, 993
- Nowak (2000) Nowak, M.A. 2000, MNRAS, 318, 361
- Nowak et al. (2002) Nowak, M.A., Wilms, J., & Dove, J.B. 2002, MNRAS, 332, 856
- Psaltis et al. (1999) Psaltis, D., Belloni, T. & van der Klis, M. 1999, ApJ, 520, 262 (PBK)
- (27) Remillard, R. et al. 2002a, ApJ, 580, 1030
- (28) Remillard, R. et al. 2002b, ApJ, 564, 962
- (29) Rossi, S. et al. 2003, astro-ph/0309129
- (30) Rybicki, G.B. and Lightman, A.P. 1979, Radiative Processes in Astrophysics, John Wiley & Sons
- Shakura & Sunyaev (1973) Shakura, N.I. & Sunyaev, R. A. 1973, A&A, 24, 337
- Shrader & Titarchuk (2003) Shrader,C. and Titarchuk, L. 2003, Ap J, 598, 168
- Shrader & Titarchuk (1998) Shrader,C. and Titarchuk, L. 1998, Ap J, 499, L31
- (34) Sobolev, 1975, Light Scattering in the Atmosphere, (Oxford: Bergamon)
- (35) Sobczak, G.J., et al. 1999, ApJ, 517, L121
- (36) Sobczak, G.J., et al. 2000, ApJ, 531, 537
- Soria (1999) Soria, R., 1999, Thesis, The Australian National University, Canberrra
- Strohmayer et al. (1996) Strohmayer, T.E., et al. 1996, ApJ, 469, L9
- (39) Sunyaev, R. & Titarchuk, L. 1980, A&A, 86, 121
- (40) Tanaka, Y. and Lewin, G.H., X-ray Binaries, (Eds. Lewin W.G.H., van Paridis, J. and van den Heuvel, E.P.J.), p 126, Cambridge Univ.
- (41) Titarchuk, L., 2003, ApJ, 591, 354
- (42) Titarchuk, L., Cui and Wood, K., 2002, ApJ, 576, L49
- Titarchuk et al. (2001) Titarchuk, L., Bradshaw, C. F., & Wood, K.S. 2001, ApJ, 560, L55 (TBW)
- Titarchuk et al. (2001) Titarchuk, L., Bradshaw, C. F., Geldzahler, B.J., & Fomalont, E.B. 2001, ApJ, 555, L45
- Titarchuk, Lapidus & Muslimov (1998) Titarchuk, L., Lapidus, I.,& Muslimov, A. 1998, ApJ, 499, 315 (TLM98)
- (46) Titarchuk, L. and Lybarskij, Yu. 1995, ApJ, 450, 876
- Titarchuk, Mastichiadis, Kylafis (1997) Titarchuk, L., Mastichiadis, A. and Kylafis N., 1997, ApJ, 487, 834
- Titarchuk, Mastichiadis, Kylafis (1996) Titarchuk, L., Mastichiadis, A. and Kylafis N., 1996, Astron. Astrophys. Sup. 120, C171
- Titarchuk, & Osherovich (1999) Titarchuk, L. & Osherovich, V. 1999, ApJ, 518, L95 (TO99)
- Titarchuk et al. (1999) Titarchuk, L., Osherovich, V., & Kuznetsov, S., 1999, ApJ, 525, L129 (TOK)
- Titarchuk, & Shrader (2002) Titarchuk, L. and Shrader, C. 2002, ApJ, 567, 1057
- Titarchuk and Wood (2002) Titarchuk, L. and Wood, K. 2002, ApJ, 577, L23 (TW02)
- Titarchuk, & Zannias, T. (1998) Titarchuk, L. and Zannias, T. Ap J, 493, 863
- Tomsick & Kaaret (2000) Tomsick, J.A., & Kaaret, P. 2000, ApJ, 537, 448
- Torrejon et al. (2004) Torrejon, J.M., et al. 2004, A&A, in press
- Trudolyubov et al. (1999) Trudolyubov, S.P., Churazov, E.M. & Gilfanov, M.R. 1999, Astr. Lett., 25, 718
- van der Klis, (2000) van der Klis, M. 2000, ARA&A, 38, 717
- van der Klis, et al. (1985) van der Klis, M., et al. 1985, Nature, 316, 225
- Vignarca et al. (2003) Vignarca, F., Migliari, S., Belloni, T., Psaltis, D., & vander Klis, M. 2003 A&A, 397, 729 (V03)
- Wijnands & van der Klis (1999) Wijnands, A.D. & van der Klis, M. 1999, ApJ, 514, 939
- Woudt & Warner (2001) Woudt, P.A., & Warner, B. 2002, MNRAS, in press, astro-ph/0202441
- (62) Zeldovich, Ya. B., & Shakura, N.I. 1969, Sov. Astron. 13,175