The kinematics of the bi-lobal supernova remnant G 65.3+5.7 – Paper II
Further deep, narrow-band images in the light of [O iii] 5007 Å have been added to the previous mosaic of the faint galactic supernova remnant G 65.3+5.7. Additionally longslit spatially resolved [O iii] 5007 Å line profiles have been obtained at sample positions using the Manchester Echelle Spectrometer at the San Pedro Martir observatory. The remnant is shown to be predominantly bi-lobal with an EW axis for this structure. However, a faint additional northern lobe has now been revealed.
Splitting of the profiles along the slit lengths, when extrapolated to the remnant’s centre, although uncertain suggests that the expansion velocity of this remnant is between 124 and 187 km s-1 ie much lower than the 400 km s-1 previously predicted for the forward shock velocity from the X–ray emission.
An expansion proper motion measurement of 2.1 0.4 arcsec in 48 years for the remnant’s filamentary edge in the light of H + [N ii] 6548 & 6584 Å has also been made. When combined with an expansion velocity of 155 km s-1, a distance of 800 pc to G 65.3+5.7 is derived.
Several possibilities are considered for the large difference in the expansion velocity measured here and the 400 km s-1 shock velocity required to generate the X–ray emission. It is also suggested that the morphology of the remnant may be created by a tilt in the galactic magnetic field in this vicinity.
Key Words.:
ISM:general–ISM: supernova remnants–ISM: individual objects: G 65.3+5.71 Introduction
Mavromatakis et al. (2002 - hereafter called Paper I) presented the deepest optical images of the supernova remnant (SNR) G 65.3+5.7, discovered by Gull et al. (1977), yet obtained. They revealed a filamentary structure 3∘ 4∘ in size, emitting the [O iii] 5007 Å nebular line brightly and predominantly composed of two irregular filamentary rings with displaced centres; a bi-lobal morphology is implied.
Also presented in Paper I are low–dispersion spectra at eight positions (P1–8) around the remnant’s perimeter; these are consistent with ionization by a 90–140 km s-1 shock with a local ionized gas density of 200 cm-3 typical of an 20,000 yr old SNR. ROSAT observations by Aschenbach (1994) and Lu & Aschenbach (2004) reveal clumpy X–ray emission from G 65.3+5.7, assuming a distance of 1 kpc, from a forward shock of 400 km s-1 in a tenuous ambient medium of density 0.02 cm-3.
Losinskaya (1980), from H interferograms obtained with a classical Fabry–Perot interferometer, had extrapolated line splitting over the bright filamentary edge of G 65.3+5.7 (called ‘A newly discovered SNR in Cygnus’ in that paper) to give a global expansion velocity = 400 200 km s-1.
Deep, spatially resolved profiles of the [O iii] 5007 Å emission line have now been obtained with an echelle spectrometer at positions P1–5 & 7–8 where the Paper I low–dispersion spectra were obtained, and at a further position, P9, over the centre of G 65.3+5.7 with the intention of measuring the maximum expansion velocity directly as well as obtaining accurate line profiles at representive positions. Further deep CCD images, again in the [O iii] 5007 Å line and neighbouring continuum, were also obtained, with the same wide–field imaging system employed in Paper I; a more complete continuum subtracted image of this SNR has resulted.
2 Observations and results
2.1 New imagery
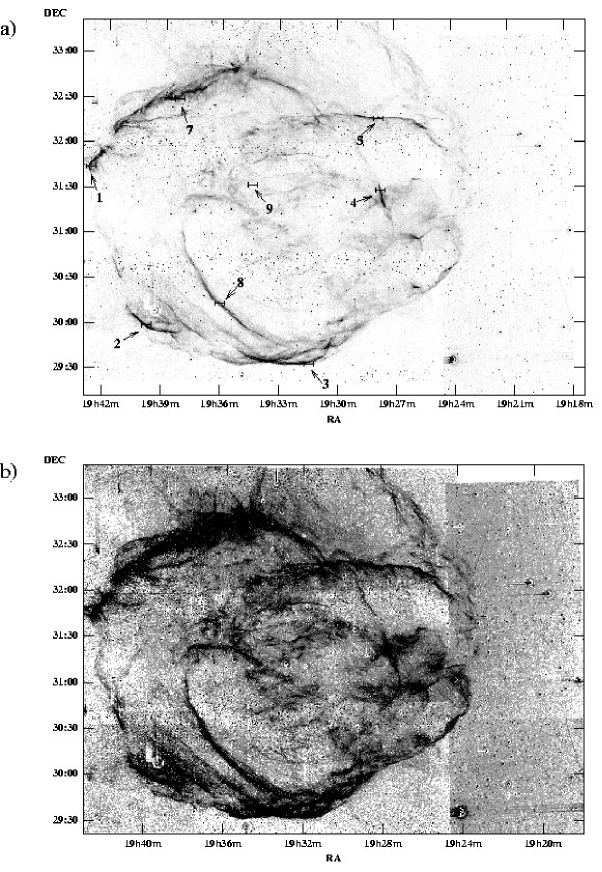
Three further [O iii] 5007 Å and continuum images were obtained on June 2003 27-28 with the 89′ 89′ field (5″ per pixel) 0.3 m Schmidt Cassegrain telescope at the Skinakas Observatory, Crete, Greece to complete the coverage of the westerly edge of the SNR. These were then combined, after an identical analysis, with the [O iii] 5007 Å image described in Paper I. Light and deep negative grey-scale representations of the whole field are shown in Figs. 1a-b respectively.
2.2 Long-slit spectroscopy
The present spectral observations were made with the Manchester Echelle Spectrometer (MES-SPM - see Meaburn et al. 1984; 2003) combined with the 2.1-m San Pedro Martir telescope. A SITe3 CCD was the detector with 10241024, 24 m pixels although 22 binning was employed throughout the observations on the nights of the May 2003 29-31.
Spatially resolved, long-slit line profiles at high spectral resolution were obtained with the MES–SPM. This spectrometer has no cross–dispersion. For the present observations, a filter of 60 Å bandwidth was used to isolate the 114th echelle order containing the [O iii] 5007 Å nebular emission line.
The 512 increments, each 0.626″ long, give a total projected slit length of 534 on the sky. ‘Seeing’ was always ″ during these observations. A 150 m wide ( and 1.9″) single slit was used.
The data were bias corrected, cleaned etc. in the usual way using the STARLINK figaro and kappa software packages. All spectra were calibrated in heliocentric radial velocity ( ) to 3 accuracy against spectra of a thorium/argon lamp. Absolute surface brightnesses, B erg s-1 cm-2 sr-1 Å-1, of the line profiles were obtained by comparing the spectra to the slitless spectrum of the standard star Feige 56. All spectra were obtained in photometric conditions, and without correction for interstellar extinction are accurate to around 10 percent.
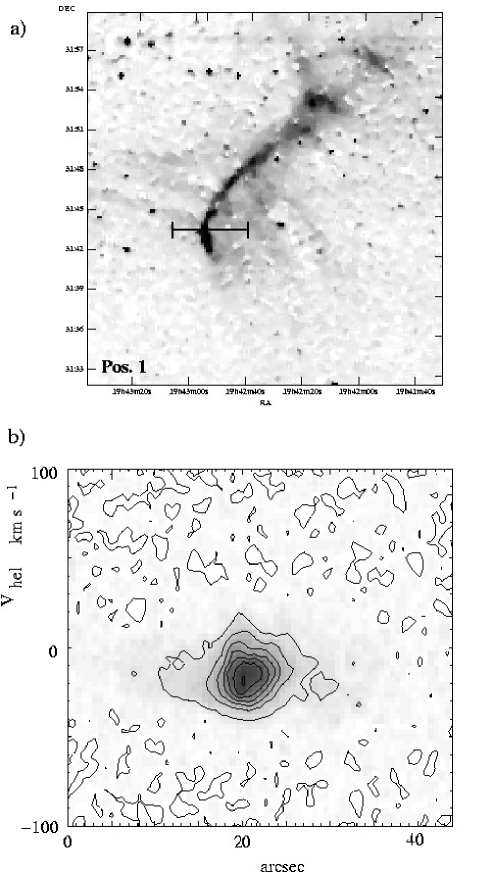
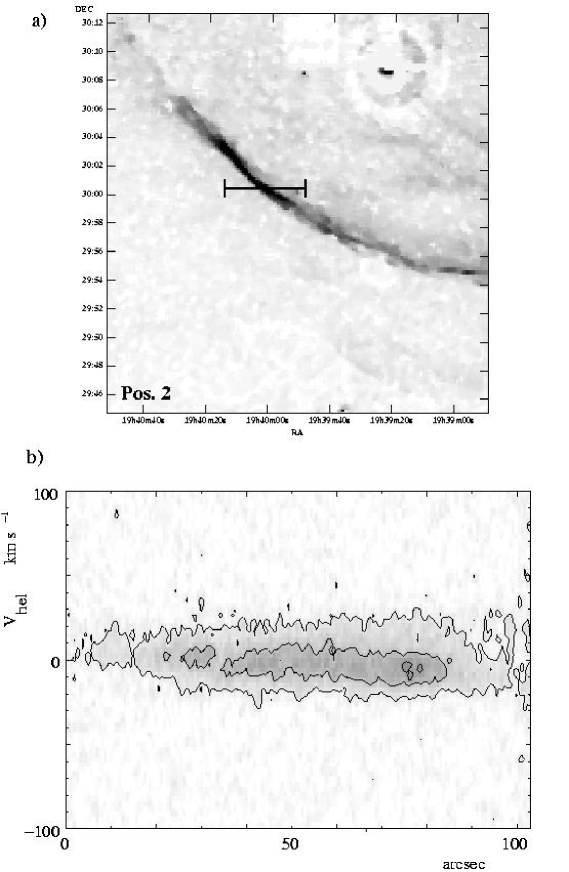
The slit was orientated EW on the centres P1-5 & P7–8 from Paper I with integration times of 1800s. The integration time for a further slit position (P9) was 3600s. These slit positions are shown against the lightly printed image of the SNR in Fig. 1a.
Negative grey-scale representations of the position–velocity (pv) arrays of [O iii] 5007 Å line profiles are shown in Figs 2a–h for slit positions P1–5 & P7–8. More details of the imagery and pv arrays over the brighter filaments are shown in Figs. 3a–b and 4a–b for slits P1 and P2 respectively.
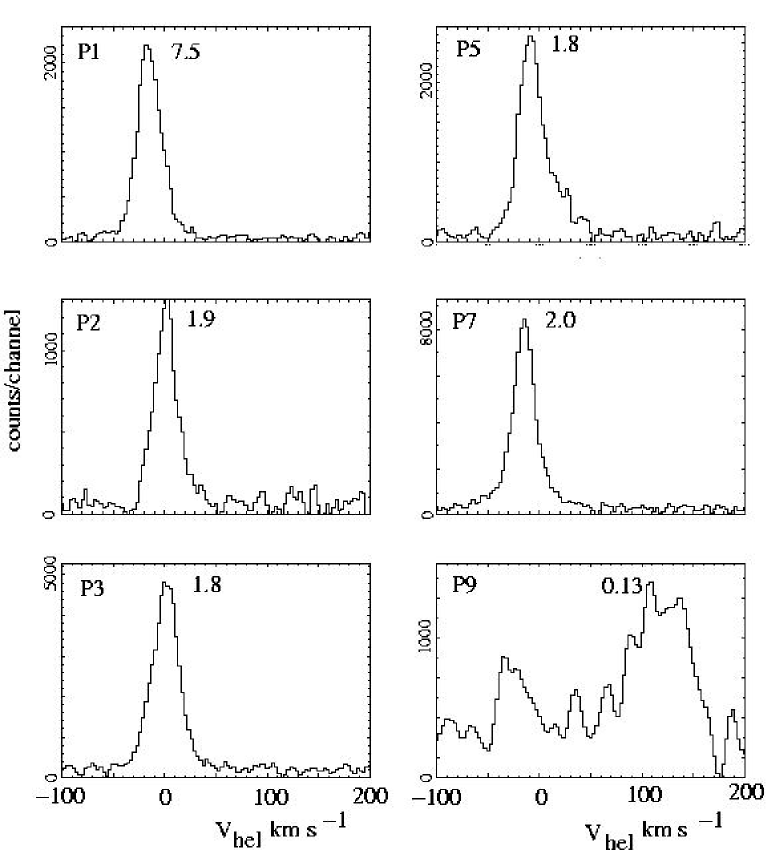
The line profiles extracted from various lengths of the pv arrays in Fig. 2a–h and for P9, where the emission is very faint, are shown in Fig. 5. The observed peak value of B in units of 10-6 erg s-1 cm-2 sr-1 Å-1 is given next to each profile.
2.3 Expansion Proper Motions
The filament at Pos. 2 (Fig. 1a) was detected by the Palomar Observatory Sky Survey POSS–E red plate taken in 1951. This is 48 yr before the H + [N ii] 6548 & 6584 Å image was obtained (taken in 1999 July 13 similarly to those in Fig. 1a & b – see Paper I for details). Both images are predominantly in the light of the H + [N ii] 6548 & 6584 Å lines and the Digitized Sky Survey of the POSS plate has a very similar angular resolution to the 1999 imagery. A measurement of the expansion proper motion of G 65.3+5.7 has therefore been made.
Firstly, the two time-separated images were rotated identically until the filament covered by Pos. 2 became vertical in both arrays. Profiles were then extracted along identical lines where there were no confusing stellar images on the filament but many reference star profiles further away. Gaussians were fitted to both faint stellar and filament profiles to give a measured shift perpendicular to the filament’s length, and away from the centre of the supernova remnant, of = 2.1 0.4 arcsec in 48 years.
3 Discussion
3.1 Kinematics and distance
The first useful parameter to determine for such an extended SNR is its systemic heliocentric radial velocity ( ). This is given most plausibly by the mean of the profiles of the brightest filaments on the perimeter of the remnant for it is assumed that these are being viewed tangentially. The centroids of the single profiles in Figs. 3, 4 & 5 for the filamentary edges along slits P1, 2, 3, 5 and 7 are at = -19, 0, 0, -10 and -15 km s-1 respectively to give a value of = -7 km s-1 for G 65.3+5.7 (i.e. halfway between the mean radial velocities of the northern and southern filaments). Note that the profiles for the northern filaments (P1, P7 and P5) are significantly displaced to approaching radial velocities compared with their southern counterparts (P2 & P3). The halfwidths of the same profiles (for P1, 2, 3, 5 & 7) fitted by single Gaussians and corrected for the instrumental broadening are 0.42 0.02, 0.44 0.03, 0.47 0.01, 0.46 0.08 & 0.36 0.01 Å respectively. As the post-shock interstellar gas emitting [O iii] 5007 Å has most likely cooled to Te = 104 K then these widths imply residual turbulent motions, combined with non-turbulent motions due to curvature of the shock fronts, of around 23 km s-1 in all of these filamentary edges for the width of the thermal component of the [O iii] 5007 Å line will only be 0.09 Å as given by = 8.927 10-4 T Å.
Knowledge of the global expansion velocity for such a complex remnant is also desirable. In the pv arrays in Fig. 2, as detected by Lozinskaya (1980), there is evidence of expansion along slits P2 and P7: the profiles are split by about 70 km s-1 away from the bright filamentary edge, towards the westerly end of P2 (and see this trend along the short length shown in Fig. 4b) and go from -15 to -60 km s-1 along the length of P7. If it is assumed that this splitting towards the westerly end of P2 is due to the spherical expansion of the 91′ radius easterly lobe of G 65.3+5.7 then, after taking account of the slit orientation with respect to the filamentary edge, by extrapolation = 187 50 km s-1 is derived for this lobe of the remnant. The lower end of the values given by Losinskaya (1980) ( to 200 km s-1 accuracy) is therefore favoured.
Other clues to the true value of are also in the present observations. For instance velocity components further from are found along slit positions P8 and 9 which are well inside the remnant’s outer perimeter (Fig. 1a). In the pv array in Fig. 2 for P8 a component at 75 km s-1 can be seen. If this reflects the expansion of the easterly lobe in Fig. 1a, and assuming = -7 km s-1 and spherical expansion, then 124 km s-1 for the lobe for this position is 0.25 of the remnant’s radius towards the lobe’s centre; whereas the component with = 0 km s-1 along the same slit length must be from the filamentary edge of the western lobe (see Fig. 1 a). Similarly, the faint profile from P9 in Fig. 5 from near the center of the eastern lobe but just inside the edge of the western lobe of the remnant has a velocity component at = +130 km s-1 which when compared with = -7 km s-1 could imply 140 km s-1 maybe for the eastern lobe and most likely for the whole remnant.
All of the current estimations of (between 124 to 187 km s-1) are well short of the value of the 400 km s-1 forward shock velocity required for the X-ray emission (Lu & Aschenbach 2004) and below the bottom end ( = 200 km s-1) of the large range given by Losinskaya (1980). If spherical expansion is assumed at ( km s-1) in T (yr) to give (arcsec) then the distance D(pc) is given by D = 0.2168 T in which case for = 2.1 arcsec in 48 yr then D/ = 4.955. This gives D = 770 200 pc for 155 km s-1 but a large 1980 pc for 400 km s-1.
3.2 Energetics
As discussed above the optically measured expansion and shock velocities and the X-ray derived shock velocities differ sharply. This is also observed for other similar SNR, particularly the Cygnus Loop. Lu & Aschenbach (2004) and others have assumed that G65.3+5.7 is still in its adiabatic phase of evolution, thus enabling a Sedov analysis of the energetics. The low ambient density derived from this analysis suggests a lower than usual post-shock cooling rate () and thus make it less than likely that the SNR will have moved into the momentum conserving phase. The simplest solution to the discrepancy is that the central regions were indeed subject to a shock in a rarified medium which produced the X-ray emission but that the shock speed has recently encountered much denser material which has reduced the shock speed and led to the optical emission that is observed. Two possible sources of this dense material are a cloudy ISM and a pre-existing dense circumstellar shell and these are now discussed in turn.
Lu & Aschenbach (2004) favour a shock wave propagating into a cloudy ISM as described in detail by McKee & Cowie (1975). The two shock speeds are then due to cloud shocks and the main shock travelling through the intercloud medium. Less obviously explained is the fact that the measured expansion velocity of the SNR as measured by the optical filaments is also much less than the X-ray shock velocity. The X-ray emission does not extend measurably beyond the boundary delimited by the optical filaments. This requires that the clouds are promptly disrupted by the shock, incorporated into the postshock flow and that recombination takes place. For small clouds, the disruption takes a few ‘cloud crushing’ times, as defined by Klein, McKee and Colella (1994), by which time the leading shock will be a few times ahead of the cloud, where is the density contrast between the cloud and intercloud medium. For a this leads to a displacement of a few tens of the cloud size. As long as the density contrast or cloud sizes are not too large the optically emitting gas will be close to the boundary of the SNR and moving with a velocity a fraction of the initial shock speed. The difficulty with such a picture is that a very large number of small clouds are required to get the very smooth O iii distribution as seen in our figures.
Note that the X-ray shock velocity estimate comes from the current X-ray temperature and if this has been cooled significantly by the addition of cold stationary clouds then the actual X-ray shock velocity should be even higher. However, McKee & Cowie (1975) argue that the acceleration and evaporation of the over-run clouds will have little effect on the energetics of the SNR as long as their filling factor is not too large. Some support for this model comes from the clumpy nature of the X-ray emission as mapped by Lu & Aschenbach (2004).
An alternative is that a pre-existing dense circumstellar shell has been encountered by the blast wave and this has led to the two different shock velocities. If the progenitor was a massive star then an H ii region and wind blown shell will have been set up around the star. Shull et al. (1985) discussed the effects of a SN explosion in a cloudy medium around a massive star. The formation of the H ii region destroys any H i clouds and thus the SN explosion takes place in a cavity created by the star and then encounters a clumpy shell. Similarly, Charles, Kahn & McKee (1985) argue that the Cygnus loop SNR was caused by a SNR exploding in a pre-existing cavity, presumably generated by the progenitor. Such a model has the attraction that it accounts for the relatively low ambient medium density implied by a Sedov analysis of the X-ray shock emission. It also offers a possible explanation for the morphology of G65.3+5.7, discussed further below, since an axisymmetric mass-loss rate prior to the SN explosion could later govern the evolution of the shape of the remnant.
The local electron densities in the recombination zone, as measured in Paper 1, ranged between . For a temperature of the thermal pressure is then . In contrast, the thermal pressure of the X-ray gas implied by the shock speed and density measured by Lu & Aschenbach (2004) is only . This is another X-ray/optical discrepancy that has been observed before: Raymond et al (1988) found a similar effect in the Cygnus loop SNR. There, the shock ram pressure exceeds the thermal pressure in both the optical and X-ray emitting gas. Raymond et al (1988) discuss a possibility that could be relevant here. If a blast wave impacts a large enough cloud, a reverse shock is generated that halts the expansion of the rarefied X-ray emitting gas (McKee & Cowie 1975). This produces a temporary overpressure in the remnant that then accelerates the shock. The obstacle that causes this sequence of events could be a previously generated wind blown shell as discussed above.
3.3 Morphology
The more extended, deep image in Fig. 1b reveals clearly the prominent, nearly circular, filamentary structure, 3∘ diameter, that must define the edge of the eastern lobe which is most probably expanding at 155 km s-1. The prominent but less well–defined westerly lobe appears to be composed of at least two substructures and to complicate matters further a fainter northern lobe outside of the main perimeter of the remnant can now be seen. The northern perimeter of the easterly lobe is approaching the observer at around 16 km s-1 with respect to its southern counterpart. All that can be assumed is that the two edges have formed in separate interstellar clouds with different radial velocities.
G65.3+5.7 appears to be a very good example of a barrel–shaped supernova remnant (see Kestevan & Caswell 1987 for a full discussion and many examples). There is a clear axis of symmetry, approximately east-west, either side of which are two bright limbs of emission. Such a morphology is common and the mechanisms for producing it can be divided into extrinsic and intrinsic effects (Gaensler 1998). An example of the former is a well ordered local ISM magnetic field that is then incorporated into the shell of the SNR. An example of the latter is a previous axisymmetric outflow from the progenitor that then influences the evolution of the SNR (see above). Gaensler (1998) presents evidence that the barrel axes tend to be aligned with the galactic plane which then suggests an extrinsic effect (specifically, the galactic magnetic field stratifying the ambient medium) is responsible in many cases. The barrel axis of G65.3+5.7 is at approximately 45 degrees to the plane and the remnant is displaced from the plane by . This is of the order of the gas scale height and so the orientation of the field could be begining to depart from being parallel to the plane. Though the exact orientation is unclear, 45 degrees is not unreasonable. It does seem unlikely however that interstellar clouds will be flattened and stratified at this angle to the ISM. One of the several proposed mechanisms involving the compression of magnetic field (discussed by Gaensler 1998) and the generation of the bright limbs could be responsible instead.
4 Conclusions
New images of G65.3+5.7 emphasize that this is a good example of a barrel–shaped supernova remnant.
The high resolution line profiles presented here suggest that the global expansion is 155 km s-1 which is around the shock velocity deduced from previous low–resolution spectra but well short of the 400 km s-1 forward shock velocity required to generate the X-ray emission.
This expansion velocity combined with an expansion proper motion measurement (2.1 0.4 arcsec in 48 yr) gives a distance of 770 200 pc.
It would be desirable to derive a more certain expansion velocity by obtaining further deep line profiles near the remnant’s geometrical centre. The spectral resolution could be relaxed to 30 km s-1 by broadening the slit width to ensure sufficient signal to noise ratio in a reasonable observing time for such faint nebulosity.
Furthermore, a more accurate expansion proper motion could be derived by obtaining current higher resolution (say 1″) images of the filamentary edges though a filter that matches that of the baseline POSS image.
Acknowledgements.
We acknowledge the excellent support of the staff at the Skinakas and SPM observatories during these observations. JAL gratefully acknowledges financial support from CONACYT (Méx) grants 32214-E and 37214 and DGAPA-UNAM IN114199. Skinakas Observatory is a collaborative project of the University of Crete, the Foundation for Research and Technology-Hellas, and the Max-Planck-Institut für extraterrestrische Physik.References
- (1) Aschenbach, B. 1994, Rosat observations of supernova remnants, in Proc. of New Horizon of X–ray Astronomy, ed. F. Makino & T. Ogashi (Universal Academy Press), 103.
- (2) Charles, P.A., Kahn, S.M., McKee, C.F. 1985, ApJ 295, 456.
- (3) Gaensler, B.M. 1998, ApJ 493, 78.
- (4) Gull, T. R., Kirshner, R. P., Parker, R. A. R., 1977, ApJ, 215, L69.
- (5) Kesteven, M.J., Caswell, J.L. 1987, A&A 183, 118.
- (6) Klein, R.I., McKee, C.F., Colella, P. 1994, ApJ 420, 213.
- (7) Lozinskaya, T. A., 1980, A&A, 84, 26.
- (8) Lu, F. J. & Aschenbach, B., 2004, to be submitted.
- (9) Mavromatakis, F., Boumis, P., Papamastorakis, J. & Ventura, J., 2002. A&A, 388, 355 – Paper I.
- (10) McKee, C.F., Cowie, L.L., 1975, ApJ 195, 715.
- (11) Meaburn, J., Blundell, B., Carling, R., Gregory, D. E., Keir, D. F. & Wynne C. G., 1984, MNRAS, 210, 463
- (12) Meaburn, J., López, J. A., Gutiérrez, L., Quiróz, F., Murillo, J. M., Valdéz, J., Pedrayez, M., 2003, RMxAA, 39, 185.
- (13) Raymond, J.C., Hester, J.J., Cox, D., Blair, W.P., Fesen, R.A., Gull, T.R., 1988, ApJ, 324, 869.
- (14) Shull Jr, P., Dyson, J.E., Kahn, F.D., West, K.A. 1985, MNRAS 212, 799.
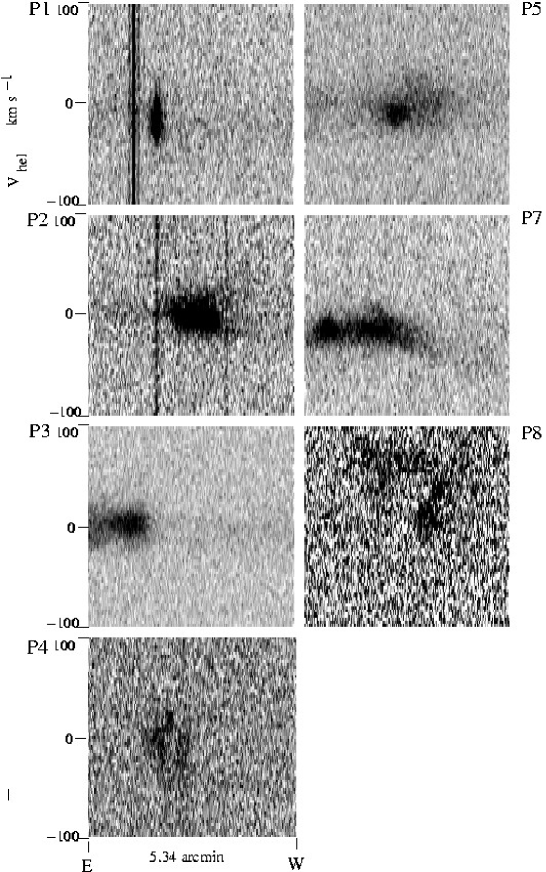
P1–5 and 7–8.