A Chandra X–ray Observation of Abell 1991: The Late Stages of Infall?
Abstract
We present results from a ks Chandra X–ray observation of the galaxy cluster A1991. The cluster has a bright X-ray core and a central temperature gradient that declines inward from keV at kpc to keV at the cluster center. The radiative cooling time of the gas in the inner kpc is about Gyr, and rises to Gyr at a radius of kpc. The cooling rate of the gas within the latter radius is . The Chandra ACIS-S3 image shows that the intracluster medium has an asymmetric surface brightness distribution with respect to the central galaxy. Bright knots of soft X-ray emission embedded in a cometary structure are located approximately 10 arcsec north of the optical center of the cD galaxy. Unlike the structures seen in other cooling flow clusters, the knots have no obvious association with the radio source. The structure’s temperature of keV makes it nearly keV cooler than its surroundings, and its mass is . Based on its bow-shaped appearance and modest overpressure with respect to its surroundings, we interpret the structure as a cool mass concentration that is breaking apart as it travels northward through the center of the cluster.
1 Introduction
The intracluster medium (ICM) in the central kpc of many clusters of galaxies has a high density, and a radiative cooling time that is short relative to the age of clusters. In the absence of heating, the hot ICM should cool, condense, and flow inwards in a so-called cooling flow (Fabian 1994). A cooling flow can deposit up to in the form of atomic and molecular clouds that may fuel star formation in the brightest cluster galaxy. However, the observed quantities of cooler gas (e.g., Edge 2001) and star formation in the central galaxy (e.g., Johnstone, Fabian, & Nulsen 1987; McNamara & O’Connell 1989) are at the level of of the cooling rates determined with the ROSAT or ASCA X–ray missions. Recent high–resolution spatial and spectral data obtained with the Chandra and XMM-Newton X–ray observatories have placed upper limits on the cool mass deposition rates that are lower by an order of magnitude compared to previous estimates (Molendi & Pizzolato 2001; Peterson et al. 2003; see McNamara 2002 for a review). Though the cooling time of the gas may be as small as a few hundred million years, very little of the ICM cools below roughly a third of the ambient cluster temperature, contrary to the model prediction where the gas cools below X–ray temperatures.
The cooling times and cooling rates of the ICM as well as the star formation rates and radio powers of the central cluster galaxies span a large parameter space. A definitive test of the cooling flow paradigm requires comparisons of reliable, locally–determined cooling rates, star formation rates and histories, and cold gas masses in cluster cores spanning the range of these properties. However, the literature contains detailed studies of mostly clusters with the largest cooling rates and very powerful radio sources, e.g., Hydra A (McNamara et al. 2000; David et al. 2001), Abell 1795 (Fabian et al. 2001), NGC 1275/Perseus (Fabian et al. 2000), that are extreme in many respects. This paper discusses a galaxy cluster that hosts a moderate cooling flow and a low–power radio galaxy, typical of the class of cooling flow clusters as a whole.
Abell 1991 is a galaxy cluster of Abell richness class at a modest redshift of (Struble & Rood 1999). Its X–ray luminosity , and temperature keV (White, Jones, & Forman 1997) are characteristic of richness clusters. A1991 purportedly hosts a moderate cooling flow of (Stewart et al. 1984), and its brightest central galaxy (BCG), NGC 5778, hosts a compact, relatively low-power radio source with (Owen & Ledlow 1997). Only modest levels of star formation (McNamara & O’Connell 1992) and accreted gas (; McNamara et al. 1990) are in evidence in NGC 5778, implying that the cooling flow is largely in remission.
In this paper, we report the results of high spatial resolution X–ray imaging and imaging spectroscopy of Abell 1991. In § 2, we describe the observations using the Chandra X–ray Observatory, and the data analysis. § 3 discusses the X–ray morphology of the ICM. We present the average spectral properties of A1991 in § 4.1, and the spatial variation of the X–ray temperature and abundance in § 4.2.1. From the spectral analysis, we determine the distribution of the gas density, pressure and entropy in § 4.2.2. We have identified a knotted substructure in the ICM; we discuss its nature in § 4.3. We summarize and discuss our results in § 5.
We employ the cosmological parameters of a flat universe with km s-1 Mpc-1, and throughout this paper, which gives a linear scale of 1.14 kpc arcsec-1 and luminosity distance of Mpc at the redshift of A1991.
2 Observation and Data Reduction
Chandra observations of A1991 (ObsID 3193) employed the ACIS instrument for a total exposure time of 38 ks on 2002 December 16 and 17. The data and read modes were Very Faint and Timed Event, respectively, and the focal plane temperature was C. Five CCD chips (ACIS-I2, I3, S1, S2 and S3) were switched on during the observation. In this analysis, we use data from the S3 chip only, concentrating on the bright central kpc region of the cluster.
We reduced the level 1 event data received from the Chandra X–Ray Center pipeline. We used CIAO Version 2.3 and calibration products CALDB Version 2.21. To convert counts to event PI values and photon energies, we used the gain file acisD2000-08-12gainN0003.fits in the CALDB. We modeled the secular gain change in ACIS-S3 using the program and calibration data of Vikhlinin et al.111Available at http://hea-www.harvard.edu/alexey/acis/tgain/ We excluded bad pixels, bad columns, and node boundaries. We retained only events with ASCA grades of 0, 2, 3, 4, and 6. During the observation, the particle background was generally stable with no flares, and there were no periods of bad aspect. Since the central region of the cluster is bright, we opted for a less conservative strategy in cleaning the lightcurve and retained data from the entire length of the observation. For observations performed in Very Faint mode, a filter222See http://cxc.harvard.edu/cal/Acis/Cal_prods/vfbkgrnd/index.html proposed by A. Vikhlinin can reduce the particle background. On applying the filter and checking the image of events flagged by it, we discovered that some source photons were being identified as background particles. Therefore, we decided not to use such screening. We also found that cosmic ray afterglows add a negligible fraction to the total event rate, and therefore did not remove the afterglow correction included in the pipeline level 1 event file.
The aspect offset for the A1991 observation is arcsec. For source detection, we used the wavelet-based CIAO “Wavdetect” program with the source detection threshold set to . For all analyses of the diffuse cluster gas, we used an image from which we eliminated the point sources so detected. We converted the counts image to a flux image by dividing it by an exposure map created using the aspect histogram and an instrument map.
For spectral analysis, we accounted for the position–dependent variations in scale and resolution of the energy of the recorded events by appropriate choice of the Redistribution Matrix File (RMF) and the Auxiliary Response File (ARF) for the source. We used the “Acisabs” program supplied by the Chandra X–ray Center to correct for the degradation in the quantum efficiency of the ACIS detector at low energies before performing spectral fits. The correction generates a small but noticeable effect on temperature fits at low photon energies, and affects determination of the equivalent hydrogen column in the spectral models.
For background subtraction or modeling, we used the source–free extragalactic sky event file of M. Markevitch333See http://cxc.harvard.edu/contrib/maxim/acisbg/ to avoid issues with spatial nonuniformity that might arise from using source–free sky regions in the cluster observation itself. We reprojected the appropriate ACIS-S3 background file to match our observation.
3 Morphological Analysis
3.1 The Chandra Image
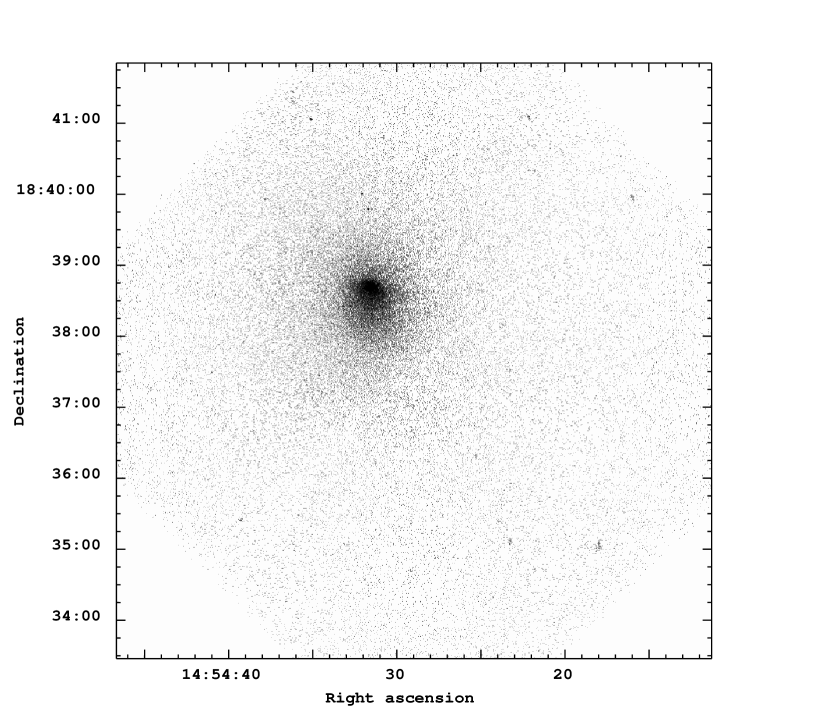
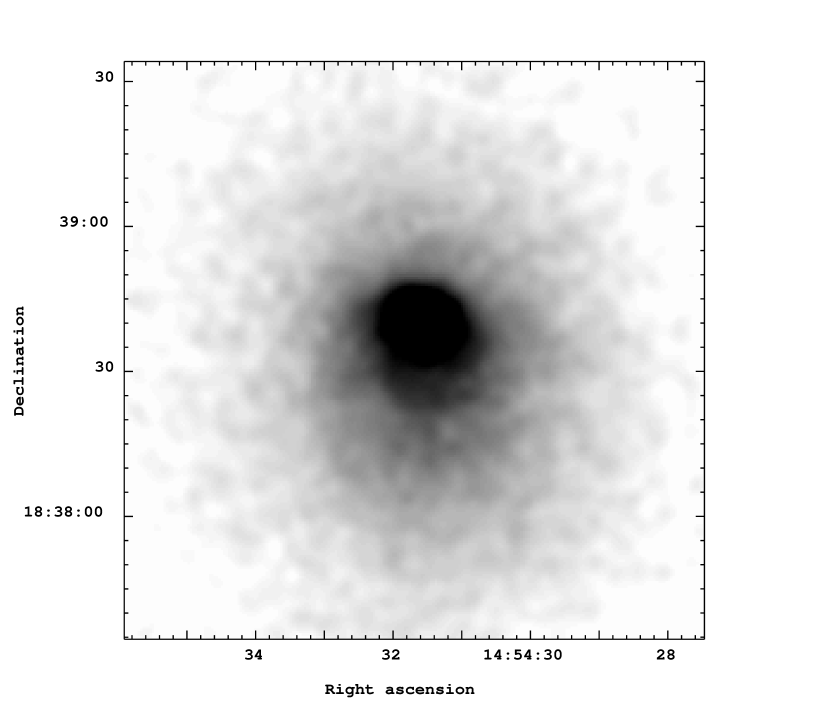
Figure 1 (top panel) depicts the full–resolution Chandra ACIS-S3 image of A1991 in the keV band. Within the central area of arcsec, the net count rate is . The X–ray emission of the cluster appears to be regular, except at the center. The X–ray centroid (J2000 RA, Dec=14:54:31.7, +18:38:35) and peak (J2000 RA, Dec=14:54:31.5, +18:38:42), determined over a roughly arcsec central region of the X–ray image, are offset by a few arcsec from the optical/radio position (J2000 RA, Dec=14:54:31.5, +18:38:32.0) of the brightest cluster galaxy (BCG), NGC 5778. At about arcsec north of the X–ray centroid, there is enhanced emission (shown in the lower panel of Fig. 1 and discussed in § 3.2 below). Further, there appear to be weak “edges” in the surface brightness similar to those in several rich clusters studied with Chandra (e.g., Abell 3667; Vikhlinin, Markevitch, & Murray 2002).
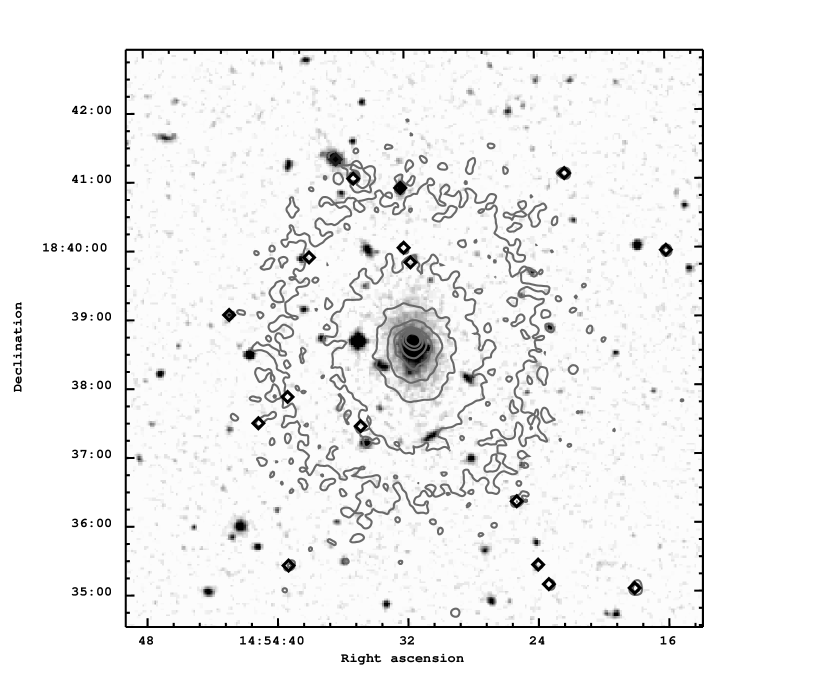
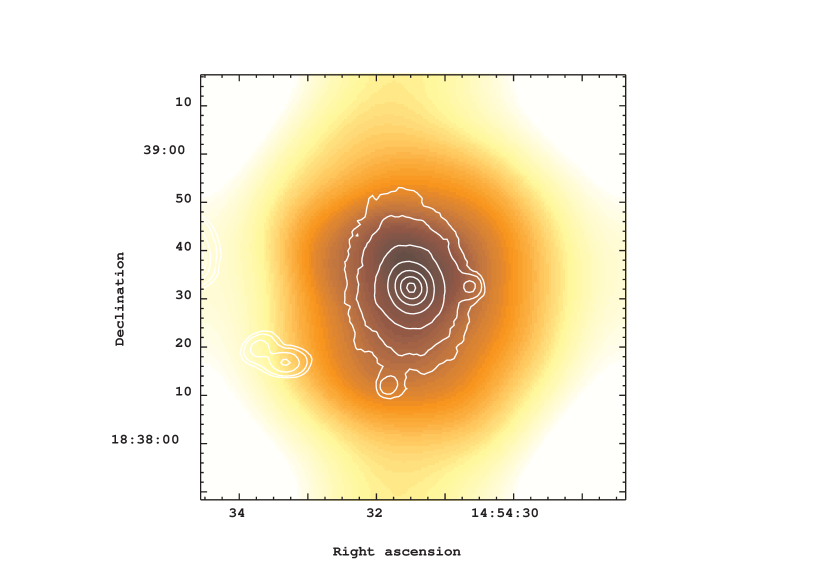
Figure 2 shows the optical image from the Digitized Sky Survey overplotted with the contours of the Chandra X–ray image in the energy range keV. In addition to the diffuse ICM, discrete sources appear on the Chandra image; 17 are detected by the CIAO “Wavdetect” program over the area of the ACIS-S3 CCD. We overplot these as diamonds in Fig. 2. Appendix A provides some details of the sources.
Figure 3 plots the cluster X–ray surface brightness profile centered on the BCG, corrected for exposure and background, and cleaned of point sources. In the image, the diffuse cluster emission extends at least arcsec from the central galaxy. White et al. (1997) found a core radius of kpc for A1991 (corresponding to an angular size of approximately arcsec using their cosmological parameters of km s-1 Mpc-1 and ). In this work, we study a similar kpc inner region of A1991.
3.2 Substructure in the ICM
The full–resolution image of A1991 shows a complex structure roughly arcsec north of the optical center of the BCG. Such knotty features have been frequently reported from Chandra studies of cores of galaxy clusters, e.g., in 2A0335096 (Mazzotta et al. 2003) and others.
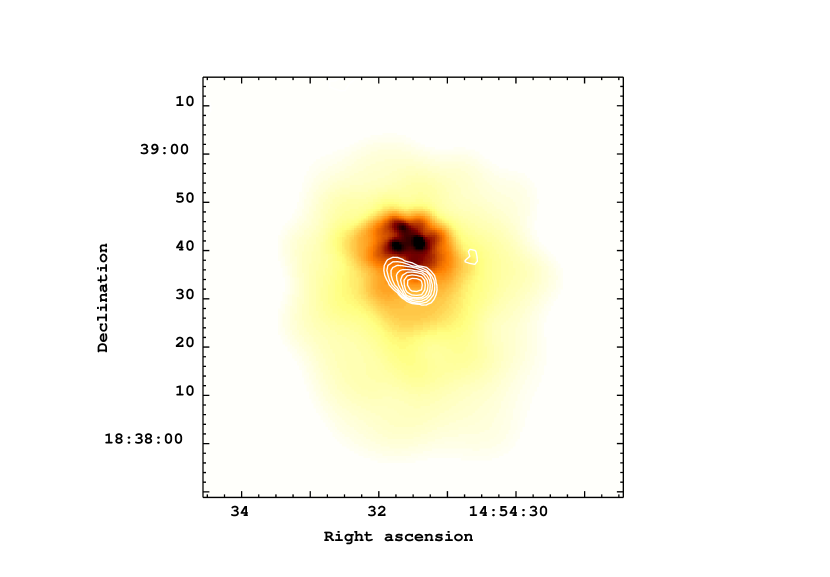
To study any possible temperature dependence of the structure, we filtered the Chandra image by energy and created separate soft ( keV) and hard ( keV) band images. Figure 4 depicts the adaptively smoothed soft and hard X–ray images of the arcmin square region centered on the BCG. The centroids of the soft and hard emission are within 1 arcsec of each other and of the centroid of the total X–ray emission. The hard emission has a nearly smooth, rhomboid shape, while the keV map shows interesting structure in the form of a region of enhanced soft X–ray emission located at the north edge of the cD galaxy. Indeed, this knotty structure shows little corresponding emission above 2 keV; in § 4.3, we demonstrate that it has a spectral identity distinct from that of the cluster. The structure (called the knots, henceforth) is slightly elliptical in projection, with semi-major and semi-minor axes of approximately arcsec (7.7 kpc) and arcsec (6.8 kpc), respectively. It actually consists of several finer structures on arcsecond scales that appear to be connected. As the bottom panel of Fig. 1 shows, the bright structure has a sharp edge to the north, and a less sharp one to the south. In Fig. 4, we overplot contours of a cm radio image acquired at the VLA on the soft X–ray image. Interestingly, the X–ray knots lie adjacent to the radio source, but the radio and X-ray emission appear to be unrelated to each other.
4 Spectral Analysis
We extracted spectra in pulse invariant (PI) channels from the events file cleaned of point sources. We grouped the spectra to have a minimum number of 20 counts per bin. We generated background spectra from corresponding regions of the blank sky background of Markevitch, except where indicated otherwise (Sec. 4.3). For spectral model fitting, we used the XSPEC program (Arnaud 1996). Despite recent improvements, the ACIS response below keV and around energies of keV has calibration uncertainties. To assess their significance, we modeled the average spectrum both including and excluding this energy interval. Excluding the keV energies resulted in the values becoming marginally better, but the best–fit parameter values and 90% confidence intervals remained virtually unchanged from the fits over the full energy range. In this work, we report only results from spectral analyses over the full energy range with the lower cut–off at keV and high–energy cut–off at keV, or keV for the knots.
The soft X–ray spectrum is subject to absorption by neutral hydrogen in the Galaxy. We parametrize the interstellar X–ray absorption using the XSPEC/WABS model that uses the absorption cross-sections of Morrison & McCammon (1983). We calibrate the abundance measurements relative to the solar photospheric values of Anders & Grevesse (1989).
We first study the average Chandra spectrum of the ICM in A1991 for comparison with the literature. Next, we profile the radial variations in temperature, metallicity, pressure, electron density. Subsequently, we study the spectral nature of the knots (Sec. 4.3).
4.1 Average Cluster Spectrum
In order to compare the global properties of the cluster to earlier, low resolution X-ray observations, we extracted a spectrum over the energy range keV within the largest circular area fully circumscribed by the ACIS-S3 chip without spilling over the CCD edges. This region, centered on the optical position of the BCG, has a radius of about 190 arcsec ( kpc), and contains about net counts. We wish to point out at the outset that due largely to the temperature decline in the inner 100 kpc of the cluster, none of the model fits to the global spectrum provide a satisfactory fit to the data.
We fitted the following models to the average spectral energy distribution: (i) MEKAL (Mewe, Gronenschild, & van den Oord 1985; Liedahl, Osterheld, & Goldstein 1995), an absorbed single-temperature, optically thin plasma model that includes line emissions from several elements, and (ii) MEKALMEKAL, a combination of two MEKAL models with metallicities set to be identical. For both the above models, we left the temperature(s), metal abundance and normalization free to vary but fixed the redshift.
We ran the fitting programs twice, with the equivalent hydrogen column density first left as a free parameter and next, frozen to the Galactic value of (Bonamente et al. 2002). We found, however, that allowing to vary resulted in its being poorly–constrained in most of the model fits, with fitted values sometimes significantly below Galactic. While the presence of the lower values could be a reflection of the models being unable to fully describe the average spectrum, it could also be due to uncertainty in the correction to the ACIS quantum efficiency at low energies. We repeated the fits for a slightly higher lower energy cut–off of keV. The resulting values of the absorption column density were again close to or below Galactic, and remained weakly constrained. Below, we discuss only results after fixing the equivalent hydrogen absorption to the Galactic value in the WABS model. The errors we quote correspond to 90% confidence limits for one interesting parameter.
For the Chandra spectrum between keV, a single–temperature MEKAL model fit gives a temperature of keV and chemical abundance of solar. However, this model is not a good fit to the data with for 355 degrees of freedom. As we show in § 4.2.1, there is a temperature gradient over this aperture, implying the ICM cannot be described as isothermal. In comparison, Ebeling et al. (1996) estimated keV over the ROSAT energy range of keV within a arcmin radius.
The model that seems to best fit the average cluster spectrum (still with for 353 degrees of freedom) needs a combination of two MEKAL components. The best–fit temperatures for the cool and hot thermal components are keV and keV, respectively. The temperature for the cooler MEKAL component is comparable to that derived from deprojection analysis of the total spectrum by Stewart et al. (1984) who found keV over the Einstein keV band. White et al. (1997) estimated keV for the deprojected Einstein spectrum between keV over a arcmin radius. The chemical abundance, assumed to be identical for both the MEKAL components, is solar, similar to that determined by the single-temperature MEKAL fit. For this two–MEKAL model, the total unabsorbed flux ( keV) is erg cm-2 s-1, with a little less than one half contributed by the soft component. This model computes temperatures and abundance that are virtually unchanged regardless of whether is fixed or free to vary.
4.2 Radial Profiles of Spectral Parameters
To estimate the radial variations in temperature, metallicity, pressure, and electron density, we extracted X–ray spectra in concentric, circular annuli starting from the optical center of the BCG. Since the overall cluster emission is nearly circular, and as we assume spherical symmetry in deprojection, circular annuli are a reasonable choice. As we show in § 4.3, the soft X–ray knots in the cluster core have a spectrum that is different from their surroundings. So, in estimating the radial dependence of the spectral parameters, we excised the knotty region from annuli inside about arcsec. In the deprojection (see below), we accounted for the volume missing due to these excised regions. Each annulus includes approximately counts before background subtraction.
We modeled the projected spectrum between keV at each radial distance with an absorbed single–temperature MEKAL model. We initially allowed the equivalent hydrogen column density, along with the temperature, metallicity, and normalization to vary freely in the fitting process. The best-fitting absorption value for many of the annuli was, as in the case of the global spectrum (§ 4.1), close to or below the Galactic value. It is unlikely that there is an actual decrement in the Galactic along the line of sight of A1991. To avoid complications in interpreting further results, we performed spectral fits with the value of absorption frozen at the Galactic value. In projection, the inner annuli to approximately 15 arcsec of the cluster center are not very well fitted with a single–temperature MEKAL model (average reduced of for about 90 degrees of freedom). However, the simple MEKAL model does represent the spectra reasonably well at larger radii.
We also performed deprojection of the spectra to account for contributions from the outer regions of the cluster to its inner regions. The deprojection algorithm first fits an absorbed single-temperature MEKAL model to the spectrum of the outermost annulus. It then works inwards, fitting to each annulus a MEKAL model in addition to a weighted combination of the best–fit models of all the annuli exterior to it. The weights given to the spectra of the outer annuli are commensurate with the volume contributions of the total outer annuli to the current one. Note that we make no allowance for the fact that the outermost annulus also has contribution from cluster emission outside it; therefore, the fluctuations in the deprojected quantities for the outer one or two rings are not to be considered physical. We also found that the spectrum of the innermost approximately arcsec of the cluster was unstable in deprojection due to the displacement of the centroid and the peak of the X-ray emission from the chosen center. We therefore present deprojected spectral parameters outside this radius only. The deprojected fits up to the outer two annuli have reduced chi-squared values close to one.
4.2.1 Temperature and Abundance
The left panel of Fig. 5 presents the radial variation of the projected (filled circles) and deprojected (open circles) ICM temperatures. Error bars show the confidence intervals. The emission weighted temperatures of the various annuli bracket almost a keV range over the cluster, with a slow positive radial gradient. The projected temperature drops from keV at a radial distance of about arcsec ( kpc) to keV near the cluster center. After deprojection, which accounts for the overlying hotter layers, the temperature at all radii but the outermost (for which no correction is applied) expectedly falls to a value lower than seen in projection. The three dimensional temperature falls to a low of keV in the center. The constraints on deprojected temperature, where the errors are correlated between annuli, are not so strong as in the projected case.
The right panel of Fig. 5 shows the radial profile of the chemical abundance of the ICM. Both the projected (filled circles) and deprojected (open circles) profiles are noisy. The metallicity values in the various annuli average around . This compares reasonably well with the overall cluster abundance found from the best–fitting two–MEKAL model of the total cluster spectrum (§ 4.1).
4.2.2 Gas Density, Pressure and Entropy
From the deprojected spectral fits presented in § 4.2.1, we also compute the electron density, pressure, and cooling time of the gas. The top panel of Fig. 6 plots the radial profile of the deprojected gas density calculated from the MEKAL model normalizations. Over the inner kpc cluster region, where the deprojected gas temperature declines inwards, the gas density climbs by about a factor of ten, reaching a central value of . Further, there is no obvious constant density core in the cluster. Over the same annuli, the specific entropy (Fig. 7, bottom panel) of the ICM increases outward, as is seen in other cooling flow clusters (e.g. David et al. 2001). As the top panel of Fig. 7 shows, the ICM pressure climbs by nearly an order of magnitude from the exterior regions towards the cluster center. It approaches at the location of the cD galaxy. This pressure is smaller by a factor of several compared with clusters hosting massive cooling flows and powerful radio sources like Hydra A (McNamara et al. 2000).
4.2.3 Cooling Mass Deposition Rate
The middle panel of Fig. 6 shows the radial variation of radiative cooling time calculated from the deprojected electron density and including the metallicity dependence of the cooling function. The central cooling time is Myr, and rises to Gyr at a radius of kpc. A1991 is similar in this respect to other cooling flow clusters such as Perseus (Fabian et al. 2000) and Hydra A (McNamara et al. 2000; David et al. 2001; Nulsen et al. 2002).
The short cooling times at the center of A1991 suggest that cooling to low temperatures may be occuring in the core of the cluster. However, high-resolution XMM-Newton spectra (e.g., Peterson et al. 2003; Kaastra et al. 2004) have shown that the bulk of the gas in cooling flow clusters cools from ambient temperatures down to only keV, with very little cooling below 2 keV. The standard isobaric cooling flow model may thus be an over-simplification of the real cooling gas spectrum, and a cooling flow model with a minimum temperature cut-off provides a better description of the spectral data (see Molendi & Pizzolato 2001). Nevertheless, the XMM-Newton upper limits on the level of cooling below X-ray temperatures are not restrictive, so substantial amounts of gas may yet be cooling to low temperatures. It is therefore reasonable to evaluate the possible maximum mass deposition rates consistent with our low spectral resolution data.
We fitted the MKCFLOW model (Mushotzky & Szymkowiak 1988) along with an isothermal (MEKAL) plasma component to the annular spectra, both modified by the WABS model with the line–of–sight absorption fixed to the Galactic value. The cooling flow model assumes that the gas cools isobarically from the ambient temperature (determined by the MEKAL component) to a low temperature (that we set to keV) at which it would no longer be detectable in X–ray. The cooling gas has the same abundance as the thermal component. Such a forced fit corresponds to a “maximal cooling flow model” as described by Wise et al. (2004).
We applied the statistical F-test to the chi-squared values of the maximal cooling model versus the single temperature model for each of the annuli. The cooling model provides a better fit to the data than a single temperature model within a arcsec radius. In this region, the cooling time is less than Gyr, and is less than about (a upper limit; see below). At larger radii, single temperature models can adequately describe the data, so the MKCFLOW component is not necessary. However, in several of the inner annuli where the maximal cooling provides a statistically improved fit over the single MEKAL model, a two–temperature (MEKALMEKAL) model (modified by WABS absorption) performs even better. But it is not obvious what the physical interpretation of such a two–temperature model would be.
The lower panel of Fig. 6 provides the results of the maximal cooling flow model fits. It depicts the radial profile of the projected cumulative mass deposition rate, , within all the annuli inside a particular distance from the center. We find rises from to over the central arcsec region. These values compare well with the estimates of of White et al. (1997) and Stewart et al. (1984) who found where the cooling time is less than Gyr. We wish to emphasize that these mass deposition rates do not imply that gas must be cooling at these rates. Rather, they represent the maximum rates at which gas can be cooling to low temperatures for the model to remain consistent with the data.
The projected maximal mass deposition profile shows a break near arcsec from the center. Note, however, that no prominent corresponding break in the X-ray brightness distribution is visible in Fig. 3. Allen et al. (2001) suggest that the age of cooling flows could be identified with the cooling time of the ICM at the radius of such a break in the profile of hardness ratio or mass deposition rates derived from image deprojection analysis. If we apply this method to the break in the spectrally–determined cooling mass deposition rates, we estimate an age of Gyr for the cooling flow in A1991.
4.3 Spectrum of the Cool Central Structure
The knotty region of enhanced X–ray emission described in Sec 3.2 seems largely confined to the soft X–ray band (Fig. 4) and, as we will show, has a distinct spectral character. We extracted its X–ray spectrum and fitted a thermal model to it in the energy range keV. In order to subtract the cluster contamination from the spectrum of the knots, we extracted spectra of the ICM from five regions at varying azimuthal angles located along the circle centered on the BCG with a radius terminating at the knots. The knot spectrum has approximately net counts after subtracting the cluster background.
We fitted WABS absorbed single-temperature MEKAL models (with redshift set to that of A1991) to the spectrum of the knots using in sequence each of the five background regions. Again, we adopted the Galactic absorption. Figure 8 shows a representative spectrum of the knots between keV overplotted with such an absorbed MEKAL model. The fits are formally satisfactory in quality, with d.o.f. . We quote the mean value of the five sets of the best–fit parameters and the 90% confidence intervals. We find that the substructure has a temperature of keV and metal abundance of . We conclude that the knots are cooler than their surroundings (see Fig. 5), as also evidenced by the comparison of the soft and hard X–ray images in Fig. 4. The total keV flux is s-1, where the error represents the deviation of the five measurements.
We estimated the volume emission measure for the knots using the mean of the MEKAL model fit normalizations. From this and the mean knot temperature, we derive the gas density and pressure of the knots. We compute the volume of the knots assuming the structure is an ellipsoid with the line–of–sight radius equal to the semi–minor axis of the ellipse. For semi–major and semi–minor axes of and arcsec, respectively, the knotty structure occupies . Then, the lower limit on the projected average gas density within this volume, computed assuming the filling factor is unity, is . The mass of this substructure, assuming a mean particle mass of times the proton mass, is , comparable to a small galaxy. The knot pressure is . The surrounding regions, which are about twice as hot (at keV), have a mean density and gas pressure (as derived from interpolating the respective deprojected quantities from Sec. 4.2.2). Thus, the gas pressure in the cool knotty structure is times that of its surroundings. The primary source of error in our determination of the gas properties of the knots is systematic: the selection of the background region. When our annular apertures are centered on the X–ray centroid, rather than on the optical and radio co-ordinates of the cD galaxy, the background locations differ significantly from the cluster center (i.e., to regions of lower pressure) on the side opposite the knots. In this instance, the ratio of the knot pressure to the surrounding pressure increases from to . This excess pressure implies a substantial peculiar velocity for the central structure, as we discuss below.
4.4 Kinematics of the Cool Central Structure
The distinct character, high density, and cometary appearance of the cool, knotty structure suggest that it is moving northward through the core of the cluster. If so, we can apply the pressure ratio to estimate the peculiar speed of the structure. If gas at the stagnation point in front of the moving knots had the same properties as the gas at the same radius prior to being disturbed by the knots, then, assuming a steady flow around the knots, Bernoulli’s theorem gives , where is the specific enthalpy of gas at the stagnation point, is the specific enthalpy of undisturbed gas at the same radius and is the speed of the knots. If the knots are subsonic, gas is compressed adiabatically as it flows to the stagnation point, so that , where is the pressure at the stagnation point and the pressure of the undisturbed gas. Also, , where is the temperature and the sound speed of the undisturbed gas, so that Bernoulli’s theorem may be written , where is the Mach number of the knots. If the pressure at the stagnation point equals the pressure in the knots, using the pressure ratio determined above, this gives the Mach number of the knots as . The Mach number corresponding to the maximum pressure ratio, , is . The allowed range includes , so that the knots could also be at rest in the ICM, although the appearance of the substructure suggests otherwise. We conclude, then, that the knots are almost certainly moving through the core of the cluster at a substantial fraction of the sound speed.
The appearance of the cool structure suggests that it may be in the final stages of breaking apart. Pressure variations due to internal flow are limited to the ram pressure of the external flow, i.e., the overpressure of the knots. Since the knots are overpressured by a factor of , the internal pressure variations must be modest, so that the density variations must be chiefly due to entropy variations within the structure. The ion mean-free-path in the ICM determined by Coulomb collisions, for keV and , is pc, so that the Reynolds Number of the external flow is , where is the radius of the knotty structure, and may be considerably larger if magnetic fields suppress ionic viscosity. Thus it is plausible that shear instability has driven complex flow within the knotted substructure that is in the process of destroying it.
Dynamical instabilities and the bulk motion of the core gas relative to the rest of the cluster can also cause substructures such as edges and blobs in the ICM (see e.g., Markevitch et al. 2000; Mazzotta et al. 2003). However, the central galaxy of A1991 has no significant radial velocity offset with respect to the cluster mean (Beers et al. 1991), though there could be a component perpendicular to the line of sight. Assuming the thermal knots are presently part of the cluster but originated as a distinct entity, the X–ray derived mass, gas temperature, pressure and density of the cool structure are consistent with its being the remnant of a galaxy group that is falling into A1991. The group would be subjected to ram–pressure stripping as it traverses the cluster, but its dense (low–entropy) core would survive the passage. There is a hint of a front not far from the knots which may represent the wake of the stripped gas.
5 Conclusions
We have presented a new Chandra observation of the A1991 galaxy cluster. We find that the gas in the central 200 kpc has an average temperature of keV, and an average metallicity of . Like other cooling flow clusters, the temperature of the gas in A1991 drops in the core. The deprojected, spatially–resolved gas temperature falls from 4 keV at 100 kpc to 1.6 keV in the central 10 kpc. Spectral deprojection shows that the chemical abundances are roughly constant across the central 100 kpc of the cluster. The central cooling time is yr, and rises to Gyr beyond kpc. The mass deposition rate is about within the central 20 arcsec of the cluster.
We discovered a cool central structure defined by a collection of bright X–ray knots projected kpc north of the nucleus of the cD galaxy. The structure has a mass of , and is keV cooler than the surrounding gas. It appears to be a small galaxy group that is breaking apart as it plunges northward through the core of the cluster at a substantial fraction of the sound speed.
Appendix A Point Sources
Superposed on the cluster diffuse emission are seventeen discrete sources that were detected using the CIAO “Wavdetect” program. For source identification, we cross–correlated the X–ray co-ordinates output from Wavdetect with the USNO B1.0 catalog positions of optical sources within approximately arcsec. Table A.1 presents the positions, count rates in the keV energy interval, and, when possible, the USNO counterpart. In Fig. 2, the diamond symbols overplotted on the optical image represent the detected X–ray sources.
References
- (1)
- (2) Allen S. W., Fabian A. C., Johnstone R. M., Nulsen P. E. J., & Arnaud K. A. 2001, MNRAS, 322, 589
- (3)
- (4) Anders, E., & Grevesse, N. 1989, GeCoA, 53, 197
- (5)
- (6) Arnaud, K. A. 1996, ASP Conf. Ser. 101: Astronomical Data Analysis Software and Systems V, 5, 17
- (7)
- (8) Beers, T. C., Gebhardt, K., Forman, W., Huchra, J. P., & Jones, C. 1991, AJ, 102, 1581
- (9)
- (10) Blanton, E. L., Sarazin, C. L., & McNamara, B. R. 2003, ApJ, 585, 227
- (11)
- (12) Böhringer, H., et al. 2001, A&A, 365, L181
- (13)
- (14) Böhringer, H., Matsushita, K., Churazov, E., Ikebe, Y., & Chen, Y. 2002, A&A, 382, 804
- (15)
- (16) Bonamente, M., Lieu, R., Joy, M. K., & Nevalainen, J. H. 2002, ApJ, 576, 688
- (17)
- (18) David, L. P., Nulsen, P. E. J., McNamara, B. R., Forman, W., Jones, C., Ponman, T., Robertson, B., & Wise, M. 2001, ApJ, 557, 546
- (19)
- (20) Ebeling, H., Voges, W., Böhringer, H., Edge, A. C., Huchra, J. P., & Briel, U. G. 1996, MNRAS, 281, 799
- (21)
- (22) Edge, A. C. 2001, MNRAS, 328, 762
- (23)
- (24) Fabian, A. C., et al. 2000, MNRAS, 318, L65
- (25)
- (26) Fabian, A. C., Sanders, J. S., Ettori, S., Taylor, G. B., Allen, S. W., Crawford, C. S., Iwasawa, K., & Johnstone, R. M. 2001, MNRAS, 321, L33
- (27)
- (28) Fabian, A. C. 1994, ARA&A, 32, 277
- (29)
- (30) Johnstone, R. M., Fabian, A. C., & Nulsen, P. E. J. 1987, MNRAS, 224, 75
- (31)
- (32) Kaastra, J. S., et al. 2004, A&A, 413, 415
- (33)
- (34) Liedahl, D. A., Osterheld, A. L., & Goldstein, W. H. 1995, ApJ, 438, L115
- (35)
- (36) Markevitch, M., et al. 2000, ApJ, 541, 542
- (37)
- (38) Mazzotta, P., Edge, A. C., & Markevitch, M. 2003, ApJ, 596, 190
- (39)
- (40) Mewe, R., Gronenschild, E. H. B. M., & van den Oord, G. H. J. 1985, A&AS, 62, 197
- (41)
- (42) McNamara, B. R. 2002, New Astronomy Review, 46, 141
- (43)
- (44) McNamara, B. R. et al., 2000, ApJ, 534, L135
- (45)
- (46) McNamara, B. R., & O’Connell, R. W. 1992, ApJ, 393, 579
- (47)
- (48) McNamara, B. R., O’Connell, R. W., & Bregman, J. N. 1990, ApJ, 360, 20
- (49)
- (50) McNamara, B. R., & O’Connell, R. W. 1989, AJ, 98, 2018
- (51)
- (52) Molendi, S. & Pizzolato, F. 2001, ApJ, 560, 194
- (53)
- (54) Morris, R. G., & Fabian, A. C. 2003, MNRAS, 338, 824
- (55)
- (56) Morrison, R., & McCammon, D. 1983, ApJ, 270, 119
- (57)
- (58) Mushotzky, R. F., & Szymkowiak, A. E. 1988, NATO ASIC Proc. 229: Cooling Flows in Clusters and Galaxies, 53
- (59)
- (60) Nulsen, P. E. J., David, L. P., McNamara, B. R., Jones, C., Forman, W. R., & Wise, M. 2002, ApJ, 568, 163
- (61)
- (62) Owen, F. N., & Ledlow, M. J. 1997, ApJS, 108, 41
- (63)
- (64) Peterson, J. R., Kahn, S. M., Paerels, F. B. S., Kaastra, J. S., Tamura, T., Bleeker, J. A. M., Ferrigno, C., & Jernigan, J. G. 2003, ApJ, 590, 207
- (65)
- (66) Sanders, J. S., & Fabian, A. C. 2002, MNRAS, 331, 273
- (67)
- (68) Stewart, G. C., Fabian, A. C., Jones, C., & Forman, W. 1984, ApJ, 285, 1
- (69)
- (70) Struble, M. F., & Rood, H. J. 1999, ApJS, 125, 35
- (71)
- (72) Vikhlinin, A., Markevitch, M., & Murray, S. S. 2001, ApJ, 551, 160
- (73)
- (74) White, D. A., Jones, C., & Forman, W. 1997, MNRAS, 292, 419
- (75)
- (76) Wise, M. W., McNamara, B. R., & Murray, S. S. 2004, ApJ, 601, 184
| Parameter | Mean |
|---|---|
| Temperature | keV |
| Electron density | |
| Pressure | |
| Mass |
| R.A. (2000) | Dec (2000) | area | count rate |
|---|---|---|---|
| hh:mm:ss.ss | dd:mm:ss.s | arcsec2 | 10-3 ct s-1 |
| 14:54:16.01 | +18:39:58.1 | 18 | 0.9 |
| 14:54:17.99 | +18:35:02.9 | 137 | 2.5 |
| 14:54:22.15 | +18:41:05.1 | 25 | 1.4 |
| 14:54:23.25 | +18:35:07.5 | 35 | 0.9 |
| 14:54:23.94 | +18:35:23.5 | 34 | 0.5 |
| 14:54:25.30 | +18:36:18.7 | 31 | 0.9 |
| 14:54:31.71 | +18:39:47.7 | 23 | 1.7 |
| 14:54:32.06 | +18:40:00.2 | 13 | 1.3 |
| 14:54:32.22 | +18:40:53.4 | 22 | 0.7aa mag; stellar |
| 14:54:34.66 | +18:37:26.2 | 30 | 1.1bb mag; stellar |
| 14:54:35.10 | +18:41:03.5 | 9 | 2.6 |
| 14:54:36.17 | +18:41:18.8 | 19 | 0.5cc mag; extended |
| 14:54:37.82 | +18:39:55.7 | 15 | 0.5 |
| 14:54:39.14 | +18:37:54.4 | 19 | 0.6 |
| 14:54:39.27 | +18:35:24.8 | 26 | 1.0 |
| 14:54:41.01 | +18:37:29.1 | 18 | 0.4 |
| 14:54:42.84 | +18:39:03.4 | 8 | 0.3dd mag; non-stellar |