The Imprint of Nova Nucleosynthesis in Presolar Grains
Abstract
Infrared and ultraviolet observations of nova light curves have confirmed grain formation in their expanding shells that are ejected into the interstellar medium by a thermonuclear runaway. In this paper, we present isotopic ratios of intermediate-mass elements up to silicon for the ejecta of CO and ONe novae, based on 20 hydrodynamic models of nova explosions. These theoretical estimates will help to properly identify nova grains in primitive meteorites. In addition, equilibrium condensation calculations are used to predict the types of grains that can be expected in the nova ejecta, providing some hints on the puzzling formation of C-rich dust in OC environments. These results show that SiC grains can condense in ONe novae, in concert with an inferred (ONe) nova origin for several presolar SiC grains.
1 Introduction
Classical novae are powered by thermonuclear runaways (TNRs) that occur on the white dwarf component (WD) of close binary systems (see Starrfield 1989, Kovetz & Prialnik 1997, José & Hernanz 1998, Starrfield et al. 1998, and references therein). During such violent stellar events, whose energy release is only exceeded by gamma-ray bursts and supernova explosions, about are ejected into the interstellar medium. Because of the high peak temperatures attained during the outburst, K, the ejecta are enriched in nuclear-processed material relative to the solar abundances, containing significant amounts of 13C, 15N, and 17O and traces of other isotopes, such as 7Li, 20Ne, 26Al, or 28Si (depending on the nova type, CO or ONe, the mass of the underlying white dwarf, and other properties). Indeed, theoretical models of the explosion reveal an isotopic pattern that does not correspond to equilibrium CNO burning (Starrfield et al. 1972).
In order to constrain the models, several studies have focused on a direct comparison of the atomic abundances, inferred from observations of the ejecta, with theoretical nucleosynthetic predictions (José & Hernanz 1998, Starrfield et al. 1998). Despite of problems associated with the modeling of the explosion (Starrfield 2002), such as the unknown mechanism responsible for the mixing of the accreted envelope and the outermost shells of the underlying white dwarf, or the difficulty of ejecting as much material as inferred from observations (see also Shore 2002), there is good agreement between theory and observations with regard to nucleosynthesis. This agreement includes atomic abundance determinations (H, He, C, N, O, Ne, Na, Mg, Si…) and a plausible endpoint for nova nucleosynthesis (around Ca). For some well-observed novae, such as PW Vul 1984 or V1688 Cyg 1978, the agreement between observations and theoretical predictions (see Table 5, in José & Hernanz 1998, for details) is quite amazing. The reader is referred to Gehrz et al. (1998) for an extended list of abundance determinations in nova ejecta.
Moreover, since the nucleosynthesis path is very sensitive to details of the explosion (i.e., chemical composition, extent of convective mixing, thermal history of the envelope…), the agreement between the inferred abundances and the theoretical yields not only validates the thermonuclear runaway model, but also imposes limits on the nature of the mechanism responsible for the mixing. For instance, if one assumes that the mixing settles very late in the course of the explosion, pile-up of larger amounts of matter in the envelope would be favored since the injection of significant amounts of 12C, which triggers the onset of the TNR through proton-capture reactions, would be delayed. Hence, the explosion would take place in a somewhat more massive envelope, characterized by a higher ignition density (and pressure), giving rise to a more violent outburst with Tpeak exceeding in some cases K (Starrfield; José & Hernanz; unpublished). Therefore, one would expect a significant enrichment in heavier species, beyond calcium, in the ejecta accompanying such violent outbursts. However, such an abundance pattern has never been seen in nature.
Nevertheless, a direct comparison with the elemental abundance pattern inferred from observations relies only on atomic abundances, and does not pose very strict limits on nova models. In contrast, a much more precise set of constraints may be obtained if information on specific isotopic abundances were available. One good example is silicon, with three stable isotopes (i.e., 28,29,30Si) in the region of interest for nova nucleosynthesis: whereas 28Si is strongly connected to the nature of the white dwarf core (either a CO or an ONe WD111The initial mass of the progenitor star determines the number of evolutionary stages that it will undergo. Hence, stars within evolve through hydrogen and helium burning, leaving a CO-rich white dwarf remnant. Stars in the mass interval additionally undergo carbon burning, leaving an ONe-rich remnant instead.), 29,30Si are good indicators of the peak temperatures achieved in the explosion and of the dominant nuclear paths followed in the course of the TNR, which have a clear imprint on the overall composition of the ejecta.
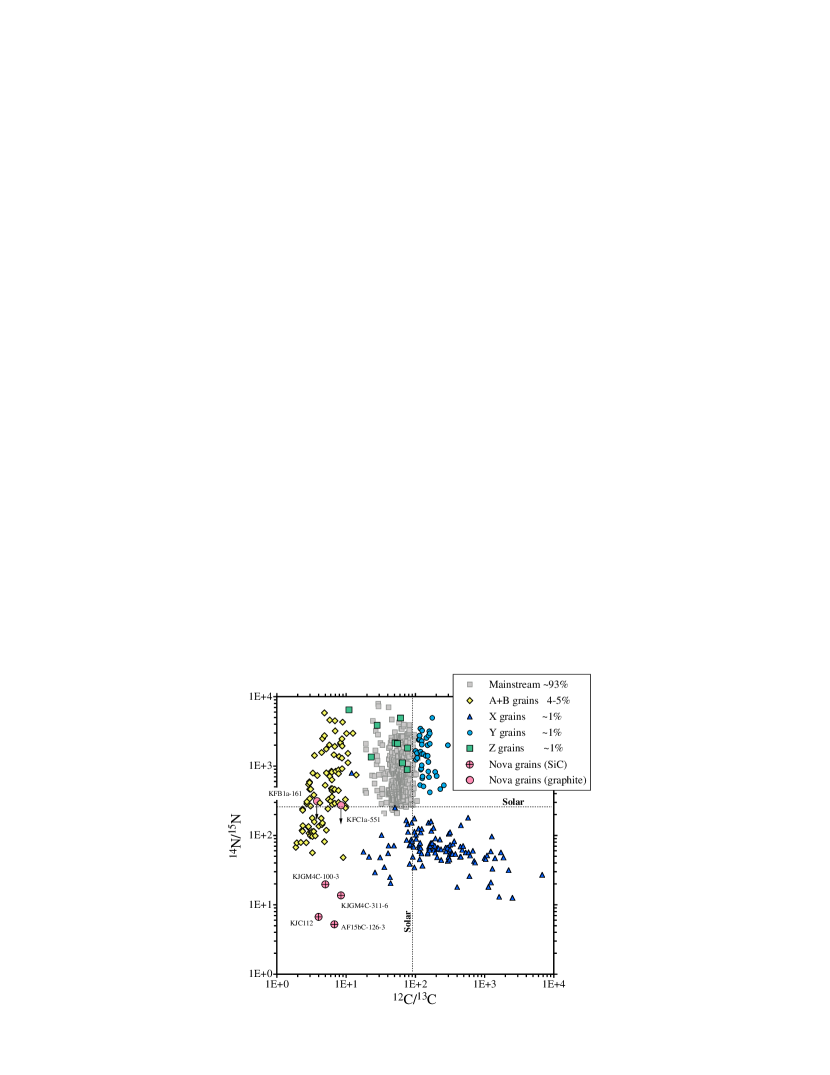
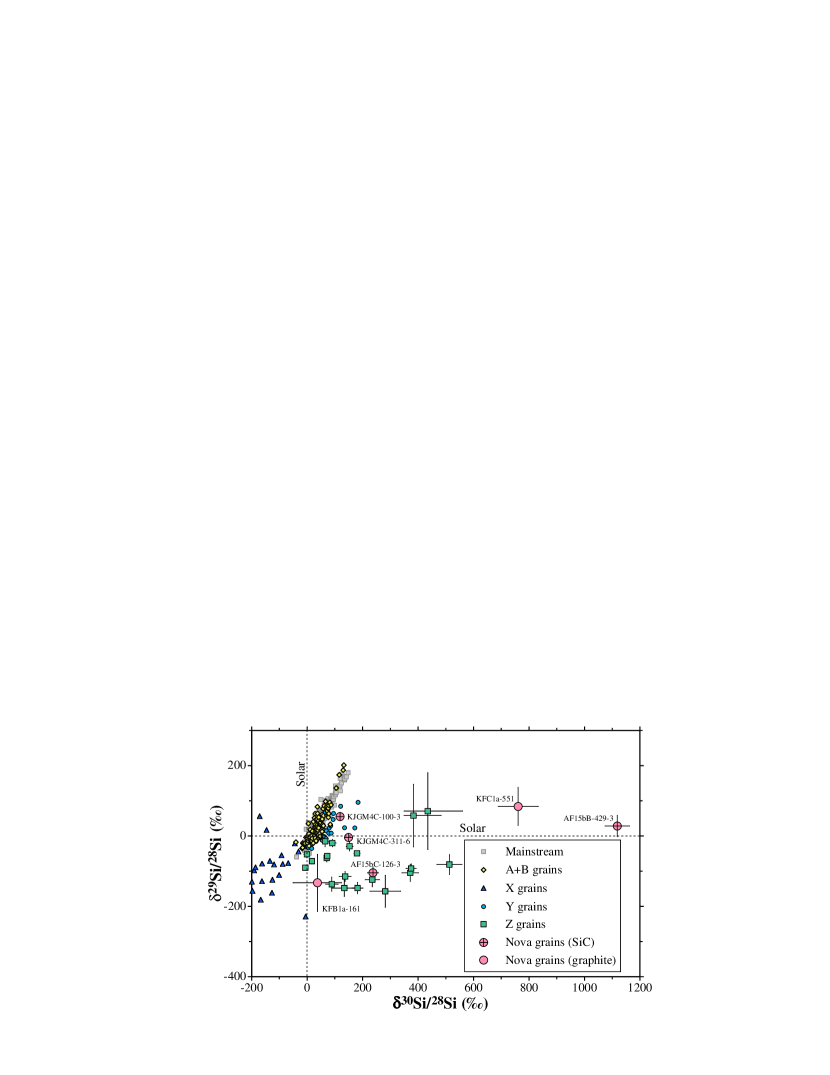
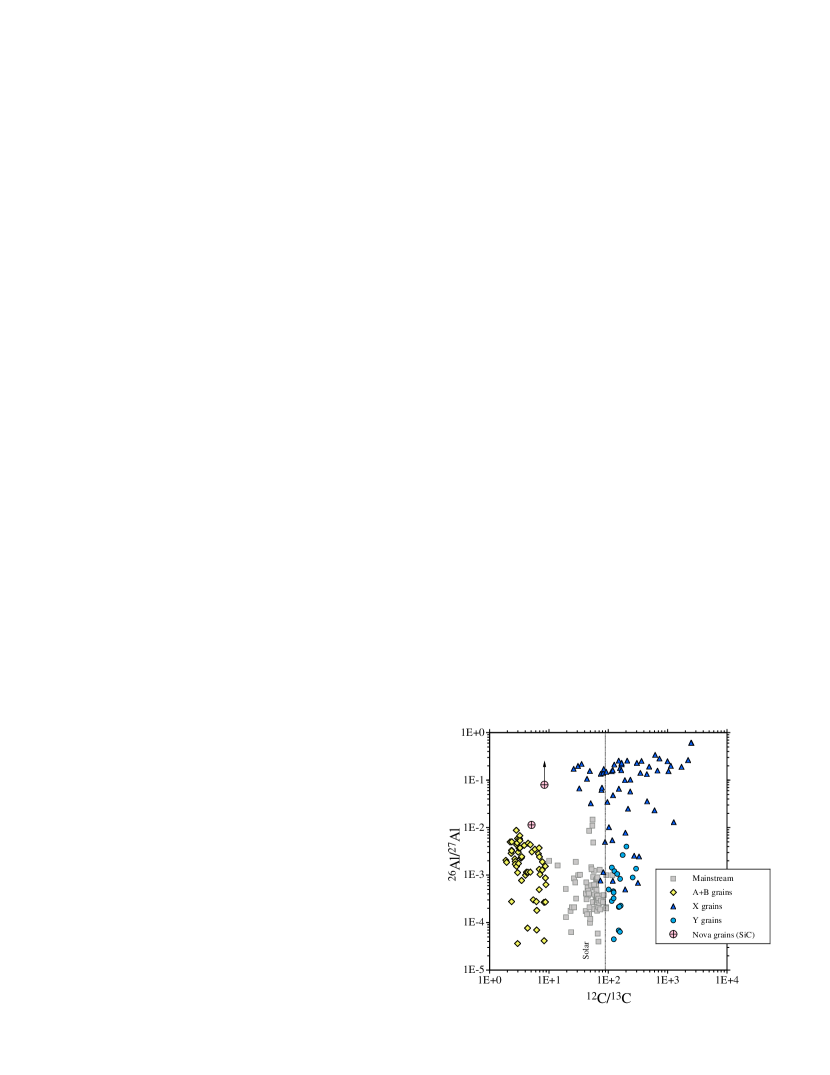
Such detailed information can be (partially) obtained through the laboratory analysis of presolar grains, which yields isotopic abundance ratios. Presolar grains, found in primitive meteorites, are characterized by huge isotopic anomalies that can only be explained in terms of nucleosynthetic processes that took place in their stellar sources. In fact, detailed studies of these grains have opened up a new and promising field of astronomy (see Zinner 1998). So far, silicon carbide (SiC), graphite (C), diamond (C), silicon nitride (Si3N4), and oxides (such as corundum and spinel) have been identified as presolar grains. Ion microprobe analyses of single presolar grains have revealed a variety of isotopic signatures that allow the identification of parent stellar sources, such as AGB stars and supernovae (Zinner 1998). Up to now, SiC grains have been most extensively studied and can be classified into different populations on the basis of their C, N, and Si isotopic ratios (see Figs. 1 and 2).
Infrared (Evans 1990, Gehrz et al. 1998, Gehrz 1999) and ultraviolet observations (Shore et al. 1994) of the evolution of nova light curves suggest that novae form grains in their expanding ejected shells. Both nova types, CO and ONe, behave in a similar way in the infrared immediately after the explosion, but as the envelope expands and becomes optically thin, differences in their infrared emission appear: whereas in a CO nova, this phase is typically followed by dust formation, accompanied by a decline in visual brightness, and a simultaneous rise in infrared emission (see Rawlings & Evans 2002; Gehrz 1999, 2002), ONe novae (erupting on more massive white dwarfs than CO novae) are not such prolific dust producers. The reason for this is that the latter have lower-mass, high-velocity ejecta, where the typical local densities may be too low to allow the condensation of appreciable amounts of dust. Observations of the condensation of dust containing different species, such as silicates, SiC, carbon and hydrocarbons have been reported for a number of novae (Gehrz et al. 1998). The presence of SiC (or C-rich) dust in nova ejecta is established from spectroscopic measurements (see Table 1, in Starrfield et al. 1998, and Table 2, in Gehrz et al. 1998). It is generally believed that CO is needed for the formation of SiC and/or graphite grains. If oxygen is more abundant than carbon, essentially all C is locked up in the very stable CO molecule, and the excess O leads to formation of oxides and silicates as condensates. On the other hand, if carbon is more abundant that oxygen, essentially all O is tied up in CO and the excess C can form reduced condensates such as SiC or graphite. Since theoretical models of nova outbursts yield, on average, OC, one would expect only oxidized condensates using the carbon and oxygen abundances as a sole criterion. However, this is at odds with the observation of C-rich dust detected around some novae (Gehrz, Truran & Williams 1993; Starrfield et al. 1997; Gehrz 1999).
While previously the identification of presolar nova grains from meteorites relied only on low 20Ne/22Ne ratios (with 22Ne being attributed to 22Na decay; Amari et al. 1995; Nichols et al. 2004), recently five SiC and two graphite grains that exhibit other isotopic signatures characteristic of nova nucleosynthesis have been identified (see Hoppe et al. 1995, Amari et al. 2001, Amari 2002, for details). This discovery provides a very valuable set of constraints for nova nucleosynthesis. Table 1 summarizes the mineralogy and isotopic composition of these grains, reported in Amari et al. (2001) and Amari (2002). The SiC grains have very low 12C/13C and 14N/15N ratios, while the graphite grains have low 12C/13C, but normal 14N/15N ratios. However, the original 14N/15N ratios of these two graphite grains could have been much lower, because there is evidence that indigenous N in presolar graphites has been isotopically equilibrated with terrestrial nitrogen. For example, most presolar graphite grains show a huge range in C isotopic ratios but essentially normal (terrestrial) N isotopic composition (Hoppe et al. 1995). Recent isotopic imaging of C and O inside of slices of graphite spherules showed gradients from highly anomalous ratios in the center to more normal ratios close to the surface, also indicating isotopic equilibration (Stadermann et al. 2004). 26Al/27Al ratios have been determined only for two SiC grains (KJGM4C-100-3 and KJGM4C-311-6) and are very high (; see Fig. 3). We note that the 20Ne/22Ne ratio is only available for the graphite grain KFB1a-161 (; 22Na/C = ; see Nichols et al. 2004), being considerably lower than the ratios predicted by nova models (see Section 2). Usually, neon is incorporated in grains via implantation, since noble gases do not condense as stable compounds into grains (Amari 2002). However, the low 20Ne/22Ne ratio measured in this grain suggests that Ne has not been implanted in the ejecta, but 22Ne most likely originated from in situ decay of 22Na (with a mean lifetime =3.75 yr).
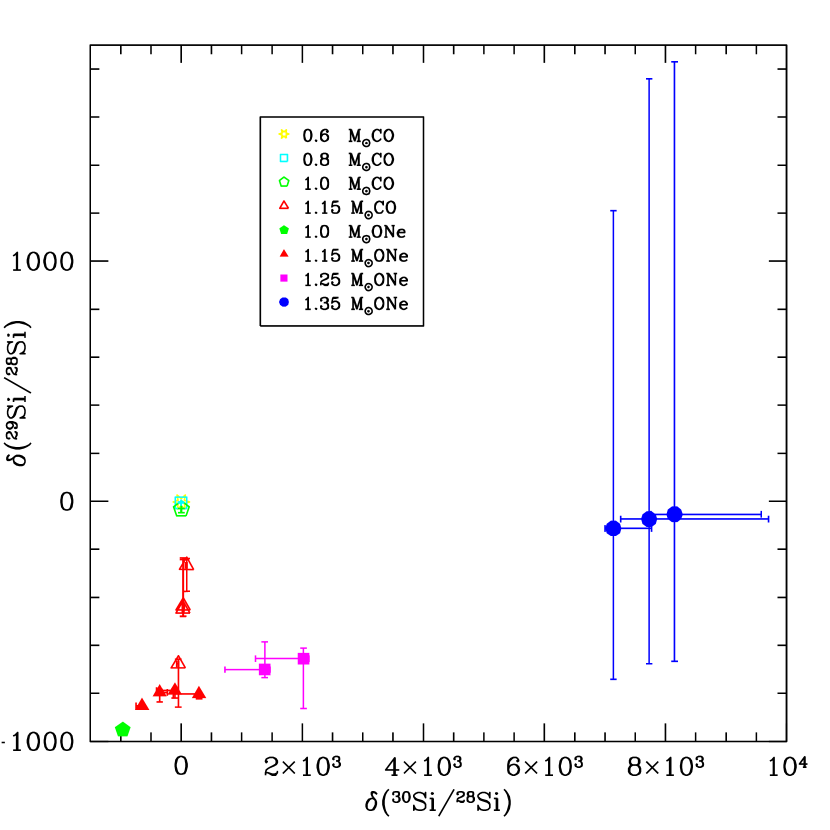
Silicon isotopic ratios of the five SiC grains are characterized by 30Si excesses and close-to- or slightly lower-than-solar 29Si/28Si ratios. Whereas CO nova models (Kovetz & Prialnik 1997; Starrfield et al. 1997; José & Hernanz 1998, Hernanz et al. 1999, and unpublished data) predict close-to-solar 30Si/28Si and close-to- or lower-than-solar 29Si/28Si, huge enrichments of 30Si and close-to or lower-than-solar 29Si/28Si ratios are obtained for ONe novae (José & Hernanz 1998; Hernanz et al. 1999, José, Coc, & Hernanz 1999, 2001; Starrfield et al. 1998). We have also included unpublished data on Si isotopic ratios for grain KFB1a-161, both in Table 1 and in Figure 2. Unfortunately, trace element concentrations in KFB1a grains are low and hence, measurements are characterized by large errors.
The isotopic signatures of these grains qualitatively agree with current predictions from hydrodynamic models of nova outbursts. In fact, a comparison between grain data and nova models suggests that these grains formed in ONe novae with a white dwarf mass of at least 1.25M⊙ (Amari et al. 2001). However, two main problems, related with the likely nova paternity of these grains, remain to be solved yet: first, the challenging connection with ONe novae which, as stated before, are not as prolific dust producers than CO novae, and second, in order to quantitatively match the grain data, one has to assume a mixing process between material newly synthesized in the nova outburst and more than ten times as much unprocessed, isotopically close-to-solar, material before grain formation.
In this paper, we provide theoretical predictions for the expected isotopic composition of the nova ejecta, and explore which type of condensates may form. The structure of the paper is as follows: in Section 2, we summarize the main nucleosynthesis results from one-dimension, hydrodynamic computations of nova outbursts. We report the theoretically expected isotopic ratios in the ejected nova shells, which should also be representative of the isotopic composition of grains condensed in the ejecta. Section 3 describes the results of chemical equilibrium condensation calculations for different types of nova ejecta. In Section 4, we explore the isotopic patterns of individual ejected shells and compare them with those resulting from mean mass-averaged envelopes. Furthermore, we analyze the effect of relevant nuclear physics uncertainties on the results presented here, and compare them with results obtained by other groups. A summary of the main conclusions of this paper is given in Section 5.
2 Theoretical isotopic ratios in nova ejecta: Mean mass-averaged values
We have adopted two different approaches in our search for trends in the isotopic composition that may characterize the nova ejecta: first, an analysis based on mean mass-averaged isotopic ratios for a number of species, resulting from hydrodynamic calculations of classical nova outbursts, and second, a detailed analysis of the chemical abundance gradients found when individual ejected shells are taken into account. It is important to stress that mean mass-averaged ratios provide a global view of the nucleosynthetic imprints of the explosion. The envelopes ejected in our numerical models of the nova outburst consist of a large number of shells of different masses (which decrease outwards from the envelope’s base). The innermost shells are probably the most relevant ones, the reason being twofold: first, these are the shells that undergo the largest changes in chemical composition through nuclear processing (i.e., the shells that will exhibit the strongest imprints of a nova outburst) and second, because of their larger masses, material from these shells has a larger probability to condense and form dust and grains. Both aspects are partially taken into account by the mass-averaging process222In fact, the analysis available in Starrfield et al (1997), the only work that addresses a similar search of nova nucleosynthesis trends and its connection with meteorites, is exclusively based on mean mass-averaged isotopic ratios that assigns different weights to individual shells. In contrast, a quantitative analysis based on individual shells, although in principle more detailed, can be potentially misleading: it may generate a biased view of the nucleosynthetic history since, a priori, all possible ratios found throughout the envelope (see Tables 2 & 3, and variation bars in Figs. 4 to 9) seem, at a first glance, equally likely. It is therefore important to point out that the largest deviations from the mean are often obtained in individual shells located near the surface, in low mass shells with a lower probability of forming grains and with isotopic features that reflect to a much lower extent the imprint of a nova outburst. In fact, the differences found in those surface layers are connected with details of the retreat of convection from the surface rather than caused by nuclear processes. It is therefore our aim to focus this analysis first on mean mass-averaged ratios and then to address the question of how robust our conclusions are when an analysis based on individual shells is performed (Section 4.1).
A full list of mean mass-averaged values, together with maximum and minimum isotopic ratios throughout the ejecta, for a sample of 20 hydrodynamic nova models, is given in Tables 2 & 3. Details of the numerical code, developed to follow the course of nova outbursts, from the onset of accretion to the expansion and ejection stages, have been discussed by José & Hernanz (1998), and are summarized in the accompanying Appendix, together with a brief description of the initial isotopic ratios adopted in the models presented here.
2.1 Nitrogen and carbon isotopic ratios
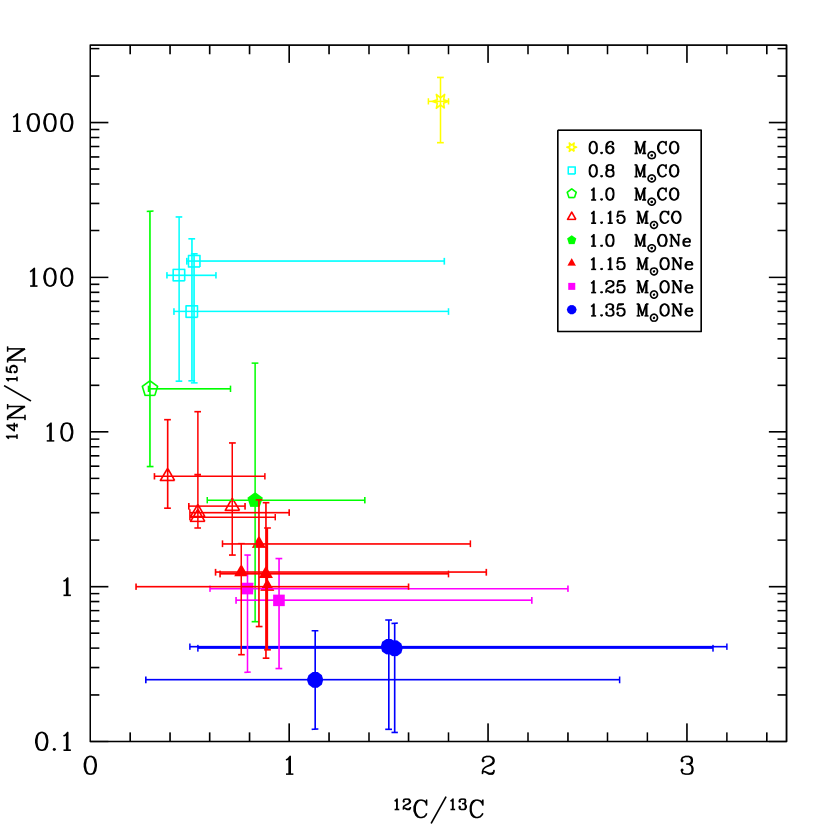
The final 14N/15N ratios found in the ejected shells of nova outbursts show a wide range of variation (see Fig. 4). Explosions involving ONe white dwarfs yield low ratios, ranging from 0.3 to 4 (solar ratio = 272). In contrast, CO nova models are characterized by higher ratios, typically between 3 and 100 (see Fig. 4), but as high as for the extreme 0.6 M⊙ CO case. As we will stress throughout this Section, the nuclear activity in this low-mass CO model is so tiny that the final isotopic ratios are, for many species, close to the initial ratios of the envelope at the onset of the TNR. These differences in the final N ratios between CO and ONe models reflect differences in the main nuclear paths followed in the course of the explosions.
The synthesis of 15N depends critically on the amount of 14N available (both the initial one, present in the accreted material, as well as the amount synthesized through the CNO cycle, starting from 12C). Since both CO and ONe models begin with the same initial 14N (see Table 3), differences in the ejecta reflect different thermal histories during the explosion (and in particular, differences in ): the higher peak temperatures achieved in ONe models favor proton-capture reactions on 14N, leading to 14N(p,)15O()15N, and are thereby responsible for the higher 15N content in the ejecta. This explains also why the 14N/15N ratio decreases as the white dwarf mass increases, for both CO and ONe models, a direct consequence of the higher temperatures achieved for more massive white dwarfs. In summary, the 14N/15N ratio provides a means for distinguishing between CO and ONe novae: large ratios, of the order of 100-1000, are only achieved in explosions involving low-mass CO novae, according to the models discussed.
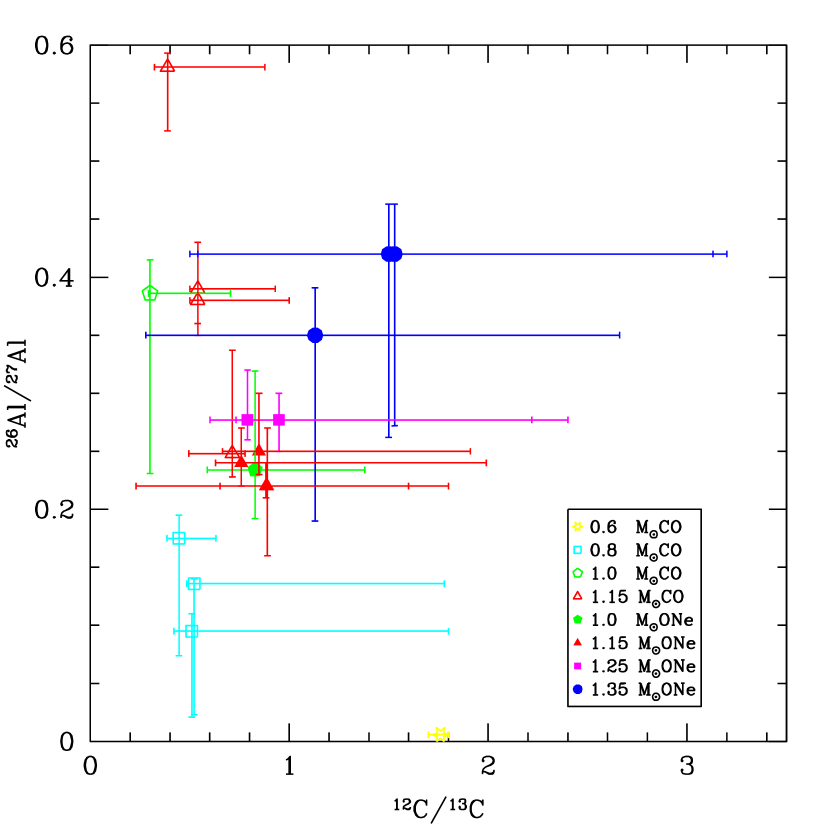
In contrast to the N isotopic ratios, both CO and ONe models yield very low 12C/13C ratios (see also Fig. 4), in the range 0.3-2 (solar ratio = 89). The dramatic reduction in the final 12C/13C ratios as compared to the initial ones is due to the very efficient synthesis of 13C through 12C(p,)13N()13C which, in turn, decreases the final amount of 12C.
The effect of the white dwarf mass on the 12C/13C ratios follows also a certain pattern, but unlike the case of N isotopic ratios, it depends on the nova type: for low-mass CO white dwarfs, the amount of 13C synthesized from proton-capture reactions on 12C is strongly limited by the moderate range of temperatures achieved in the explosion. However, as the mass of the white dwarf (and hence, the temperature at the envelope’s base) increases, more 13C is produced, leading to lower 12C/13C ratios, up to a point where the temperatures achieved in the envelope are high enough to enable significant proton-captures on 13C, increasing again the 12C/13C ratio. In ONe novae, the temperatures achieved during the explosions are always high enough for significant proton-capture reactions to proceed on 13C (which, in turn, increase the final amount of 14N), leading to 12C/13C ratios that monotonically increase with the white dwarf mass.
We stress that C ratios are highly diagnostic for identifying potential nova grain candidates since, as can be seen in Fig. 4, independently of the nova type and of the adopted white dwarf mass, all models are characterized by an extremely narrow range of low 12C/13C values (in contrast with the wide dispersion obtained for the N ratios), definitely a characteristic signature of a classical nova explosion.
2.2 Oxygen and neon isotopic ratios
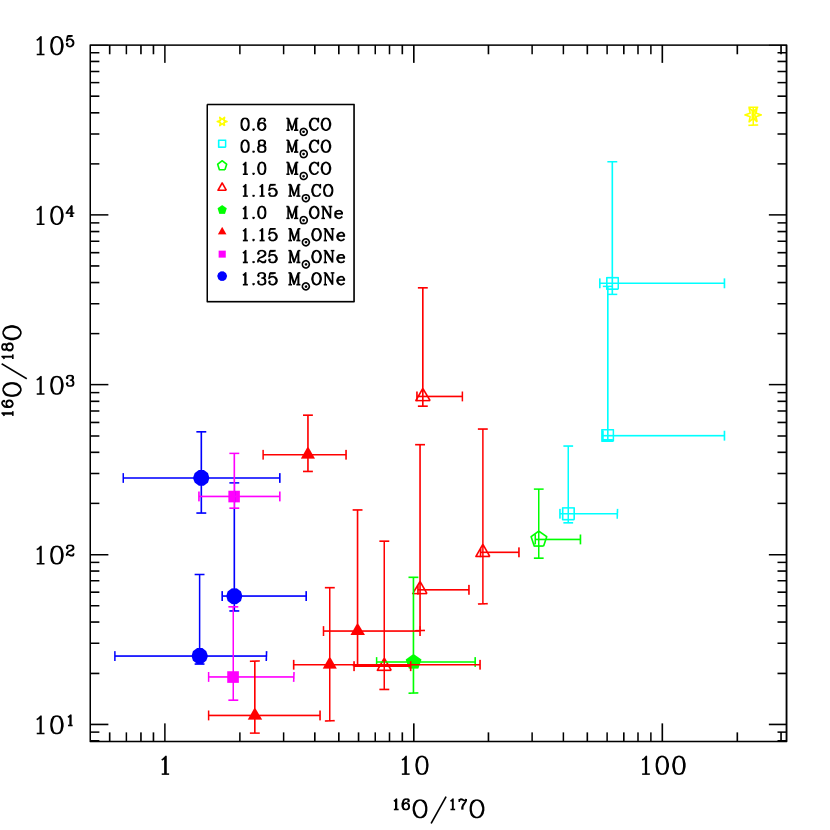
Oxygen isotopic ratios depend on the nova type (i.e., CO or ONe) and on the white dwarf mass. As can be seen in Fig. 5, CO models are in general characterized by moderate to large 16O/18O ratios, ranging from 20 to 39,000 (solar ratio = 498), and moderate 16O/17O ratios, from 8 to 230 (solar ratio = 2622). In contrast, lower ratios are, in general, found for ONe models: whereas 16O/18O ranges from 10 to 400, 16O/17O ranges from 1 to 10. It is important to stress that a recent revision of the 18F(p,) reaction rate (see Hernanz et al. 1999, and Coc et al. 2000) yields, in general, higher 16O/18O ratios than those obtained with previous estimates (compare, for instance, the O ratios obtained in models ONe3 and ONe4). At the time the calculations presented in this paper were made, the 18F(p,) rate was affected by a large uncertainty (a factor of ). Two recent experiments, at Oak Ridge and Louvain-la-Neuve, have reduced this uncertainty by a factor of , but clearly, a significant uncertainty still remains. However, it is important to stress that, while the uncertainty in the rate has been reduced there is no clear indication of a significant deviation from the nominal rate that was used in our calculations, thus our conclusions concerning the 16O/18O ratios remain essentially unaffected.
The decrease from the huge initial ratios (see Table 4) down to the values predicted for the ejecta is a measure of the nuclear processes that transform 16O to 17,18O, beginning with proton captures onto 16O, which require high enough temperatures to overcome the large Coulomb potential barrier. Indeed, at the typical temperatures attained in nova outbursts, the abundance of 16O always decreases, since 16O(p,) dominates over 15N(p,)16O, 19F(p,)16O, and 17F(,p)16O. 17O is synthesized by 16O(p,)17F()17O, and can be destroyed either by 17O(p,)18F (which decays into 18O) or by 17O(p,)14N. The dominant destruction reaction for 18O is 18O(p,). Since ONe models, which reach higher peak temperatures than CO models, synthesize larger amounts of both 17,18O, they are characterized by lower 16O/17O ratios and similar or lower 16O/18O ratios than models of CO novae.
A similar trend is found when looking at the role of the white dwarf mass (Fig. 5): in CO models, as the mass of the white dwarf increases (accompanied by increasing temperatures in the envelope), the 16O/17O and 16O/18O ratios both decrease. No trend is clearly seen for ONe novae: the synthesis of 17O has a maximum at a temperature around K (i.e., 1.25 M⊙ ONe models), however, because of the decrease in 16O, the 16O/17O ratio decreases in general as the mass of the white dwarf increases. Most ONe models show similar 16O/18O ratios, around 200 - 400 with the new 18F(p,) rates (see Hernanz et al. 1999), with no clear dependence on the white dwarf mass.
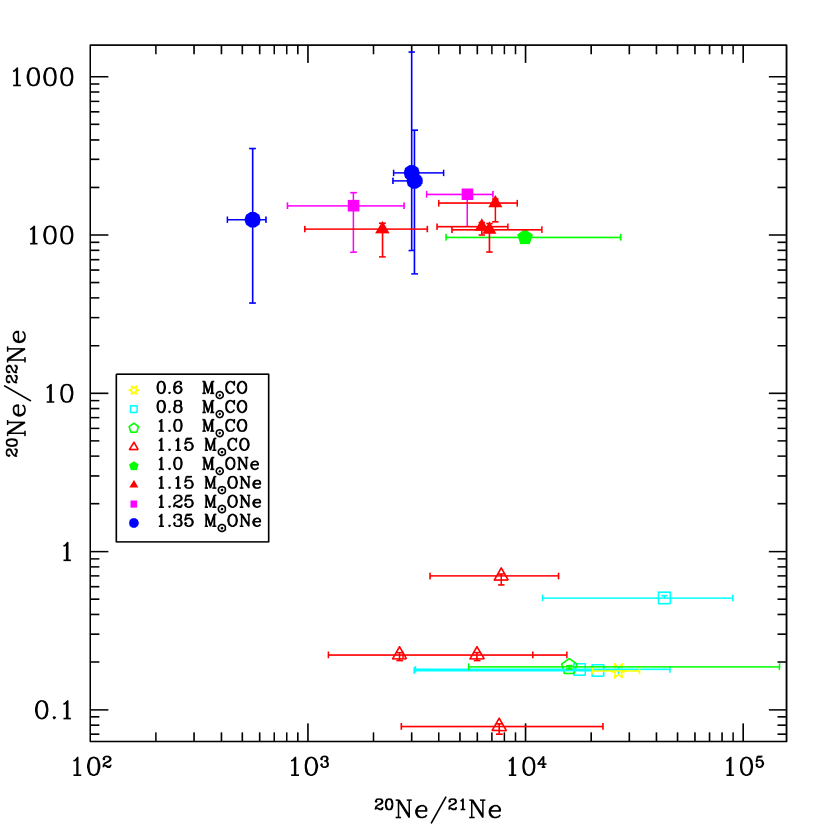
Another interesting source of information are the neon isotopic ratios. They are useful for distinguishing between CO and ONe novae: the higher initial 20Ne content in ONe novae is the main reason for the much higher 20Ne/22Ne ratios found in those models (Fig. 6), ranging typically from to (solar ratio = 14). In contrast, CO models yield 20Ne/22Ne ratios ranging only from to .
Differences between CO and ONe novae are not so extreme with regard to the 20Ne/21Ne ratio (see also Fig. 6), and in fact, ratios for the two nova types overlap at values of 2500 - 10,000. The increase in the 20Ne/21Ne ratio with respect to the initial value (see Table 4 and Appendix) reflects the fact that 20Ne is scarcely modified in most nova models, since its destruction by proton-capture reactions requires rather high temperatures. On the other hand, 21Ne, a fragile isotope, is almost completely destroyed: first, by proton-capture reactions and, as the temperature rises, the synthesis path through 20Ne(p,)21Na()21Ne is halted as soon as proton-captures on 21Na become faster than its -decay. This accounts for the large 20Ne/21Ne ratios found in both nova types.
2.3 Aluminum and magnesium isotopic ratios
Similar 26Al/27Al ratios (typically, . See Fig. 7) are obtained for both CO and ONe nova models. Although 26Al is efficiently synthesized only in ONe novae, the larger initial amount of 27Al in such novae, more than two orders of magnitude higher than in CO novae (and not strongly modified during the explosion), results in similar ratios in the two nova types. Therefore, the 26Al/27Al ratio is not a diagnostic for distinguishing between CO and ONe novae. Nucleosynthesis of 26Al is complicated by the presence of a short-lived 26Alm (=9.15 s) spin isomer. The only way to synthesize the long-lived 26Alg isotope ( yr) in nova explosions is through proton-capture reactions on 25Mg, which can yield both the 26Al ground and isomeric states. Hence, the 25Mg abundance is critical for the synthesis of 26Al. Eventually, other isotopes, such as 24Mg, 23Na and, to some extent, 20Ne, can also contribute to the final 26Al yield (see José, Coc & Hernanz 1999). The synthesis of 27Al is also complicated: whereas it is mainly destroyed by 27Al(p,), several mechanisms compete in its synthesis: one is 26Mg(p,), with 26Mg coming from its initial abundance as well as from 26Alm-decay (synthesized by 25Mg(p,) or through two proton-captures on 24Mg, leading to the -unstable 26Si); another possibility is 27Si()27Al, with 27Si coming from both 26Alg,m(p,). There is some tendency to obtain higher 26Al/27Al ratios for more massive white dwarfs.
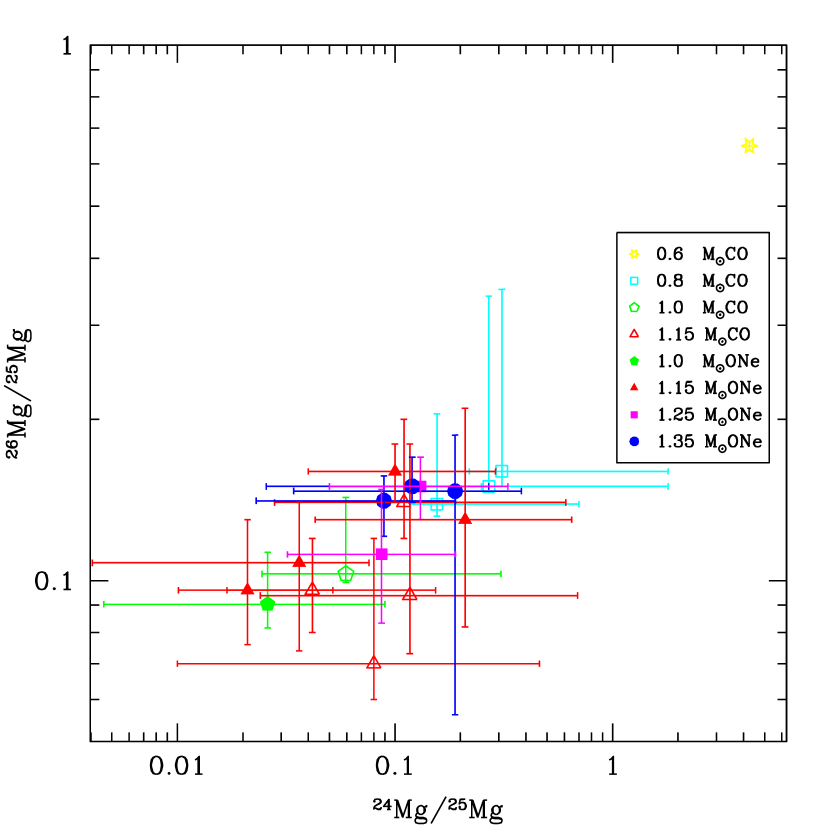
Both CO and ONe nova models yield, in general, low 24Mg/25Mg () and 26Mg/25Mg () ratios (see Fig. 8), except for the extreme 0.6 M⊙ CO case, with 24Mg/25Mg = 4.3 and 26Mg/25Mg = 0.7. The CO nova models show a rather complicated pattern, because Mg synthesis is very sensitive to the maximum temperature (and hence, to the adopted white dwarf mass) attained in the explosion. Since proton captures on 26Mg require high enough temperatures to overcome its large Coulomb barrier, the final 26Mg abundances are, in general, very close to the initial ones (with only a small decrease for the 1.15 M⊙ CO models). Again, the 0.6 M⊙ CO model shows no imprint of nuclear activity involving 24Mg, but already the 0.8 M⊙ CO model begins to show a decrease in the final 24Mg yield, since at the moderate temperatures reached in this model 24Mg(p,)25Al dominates 23Na(p,)24Mg. This in turn explains the increase in 25Mg powered by 25Al()25Mg. However, when the temperature reaches K (as for the 1.15 M⊙ CO models), the rates for 24Mg(p,)25Al and 23Na(p,)24Mg become comparable, and hence the decrease in the final 24Mg yield is halted. At the same time, 25Mg(p,) dominates over 24Mg(p,)25Al()25Mg, which accounts for some decrease in the 25Mg yield.
In contrast, for the ONe models the final Mg yields do not depend much on the adopted white dwarf mass: in all models, both the final 24Mg and 26Mg abundances are significantly lower than the initial values (by two and one orders of magnitude, respectively), whereas 25Mg decreases by only a factor of 2. Most of the destruction of Mg isotopes takes place at temperatures around K (see José et al. 1999). The differences with respect to the results for CO models are essentially due to significant differences in the initial chemical composition (the ONe models are, for instance, much richer in 23Na and 25,26Mg), which affects not only the dominant nuclear path, but also the characteristic timescales of the explosion and hence the exposure time to potential proton-capture reactions.
2.4 Silicon isotopic ratios
CO novae show, in general, a very limited nuclear activity beyond the CNO mass region, because of the moderate peak temperatures attained during the explosion and also because of the lack of significant amounts of ’seed’ nuclei above this mass range. Therefore, hydrodynamic models of CO novae yield close-to-solar Si isotopic ratios in the ejecta. Only the most massive CO models (i.e., 1.15 M⊙ ) show marginal activity in the Si region, powered by a moderate leakage from the MgAl region through 26Alg(p,)27Si, followed either by 27Si(p,)28P()28Si, or by 27Si()27Al(p,)28Si, which compete favorably with 28Si(p,), and hence tend to increase the amount of 28Si. In contrast, the mass fraction of 29Si decreases, since destruction through 29Si(p,) dominates synthesis by 28Si(p,)29P()29Si. The -decay of the residual 30P nuclei is responsible for some marginal overproduction of 30Si.
Silicon isotopic ratios are usually expressed as Si/28Si = [(29,30Si/28Si)/(29,30Si/28Si)⊙ - 1] 1000, which represent deviations from solar abundances in permil. As shown in Fig. 9, all CO models are characterized by close-to or lower-than-solar Si/28Si, and by close-to-solar Si/28Si. A quite different pattern is found for the ONe models, partially because of the higher peak temperatures achieved during the explosion, but also because of the higher initial 27Al abundance. The abundance of 28Si increases from 1 to 1.25 M⊙ ONe models and then decreases a bit for 1.35 M⊙ models. This results from the fact that around T= K, 27Al(p,)28Si dominates 28Si(p,). When the temperature rises, 26Alm,g(p,)27Si(p,)28P()28Si also contributes to 28Si synthesis, but as the temperature reaches K, destruction through proton-capture reactions dominate all reactions leading to 28Si synthesis. Hence, there is a maximum in the 28Si production around 1.25 M⊙ ONe models (which attain K).
In contrast, both 29,30Si increase monotonically with the white dwarf mass. They are powered by 29,30P()29,30Si, which dominate destruction through proton-capture reactions. Fig. 9 shows an increase in Si/28Si with increasing white dwarf mass: whereas 1.0 M⊙ ONe models show a noticeable destruction of 30Si, 1.15 M⊙ ONe models yield close-to-solar Si/28Si values. Excesses appear for M⊙ , as a result of the higher temperatures attained in the envelope. On the other hand, Si/28Si ratios are below solar and only approach close-to-solar values when the white dwarf mass reaches 1.35 M⊙.
2.5 Isotopic ratios of elements beyond silicon
For classical novae, nuclear activity above silicon is limited to events involving a very massive ONe white dwarf, close to the Chandrasekhar limit, since nucleosynthesis in the Si-Ca mass region requires temperatures above K to overcome the large Coulomb barriers of those elements (Politano et al. 1995; José & Hernanz 1998; Starrfield et al. 1998). Indeed, observations of some novae reveal the presence of nuclei in this mass range in their spectra, including sulfur (Nova Aql 1982, Snijders et al. 1987, Andreä et al. 1994), chlorine (Nova GQ Mus 1983, Morisset & Pequignot 1996), argon and calcium (Nova GQ Mus 1983, Morisset & Pequignot 1996; Nova V2214 Oph 1988, Nova V977 Sco 1989 and Nova V443 Sct 1989, Andreä et al. 1994). Models of explosions on 1.35 M⊙ ONe white dwarfs yield large overproduction factors (i.e., ) for a number of isotopes, including 31P (), 32S (), 33S (), and 35Cl () (José et al. 2001). However, the chances to measure such excesses in presolar grains are scarce. Although the predicted 33S excess may provide a remarkable signature of a classical nova event, no sulfur isotopic measurements have been made so far on presolar SiC grains. Nevertheless, equilibrium condensation calculations predict that sulfides might be incorporated into SiC grains (Lodders & Fegley 1995). Analyses of graphite grains (unpublished data) yielded solar S isotopic ratios, and it is likely that the measured S is dominated by contamination or that any indigenous S has been isotopically equilibrated during the chemical separation procedure. Since 31P is the only stable phosphorus isotope, no P isotopic ratios can be obtained. One chance might be to measure the ratio of two isotopes from different elements (such as P and S), but this would require information on the condensation behavior of these elements, which usually cannot be obtained. Two stable isotopes are available for chlorine, but there is not much of a chance to measure excesses in 35Cl because Cl is not expected to condense into SiC. Furthermore, the standard separation procedure for SiC uses HCl, introducing a strong Cl contamination.
3 Formation of grains
We explored grain formation by calculating thermodynamic equilibrium condensation sequences of the ejected layers for three representative nova models, involving 1.15 M⊙ CO, 1.15 M⊙ ONe and 1.35 M⊙ ONe WD. In particular, we adopted the chemical composition of the first, innermost ejected layer in each case, since the largest changes in chemical composition from solar are expected to be found precisely in the innermost shells of the envelope. We note that similar results are found if nearby shells (i.e., 5 or 10 shells above the innermost ejected one) are used instead, but towards the outermost shells chemical variations are less extreme and different condensates are likely to appear. The isotopic chemical pattern of those envelope shells, calculated self-consistently by means of the hydrodynamic code (for nuclei ranging between H and Ca), was augmented by assuming solar element/Ca abundance ratios for elements heavier than Ca. Calculations were performed with the CONDOR code and the computational procedure is similar to that described in Lodders & Fegley (1995, 1997) and Lodders (2003). The calculations use the temperature and pressure profile computed for the whole envelope with the hydrodynamic code. At temperatures where condensation occurs, total pressures are in the range of to bar. It should be stressed that the results of these computations only apply to the innermost ejected shell of the expanding nova ejecta and the underlying assumption is that no mixing occurs between this and overlying shells. Therefore, the calculations only describe the condensates for an extreme endmember composition of the overall ejecta from a given nova model, and additional condensates of different mineralogy that may be produced in the outer shells are not considered here. The investigation of the condensates that can form in the different ejecta layers and in overall homogenized ejecta will be described elsewhere (Lodders et al. 2004).
3.1 Condensates for 1.15 M⊙ CO nova ejecta
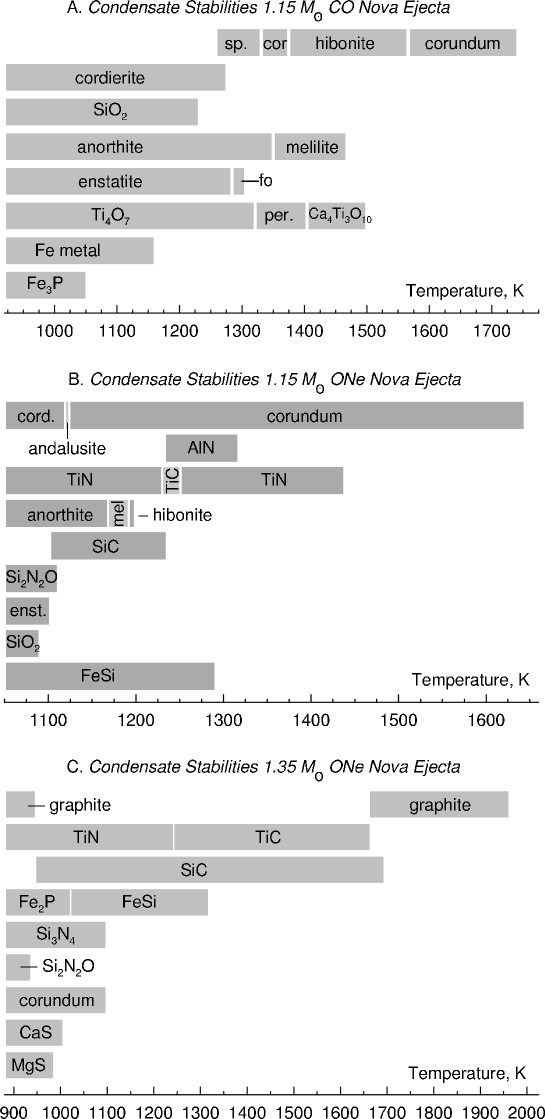
The atomic C/O ratio of the innermost shell of this CO nova model is , and we expected oxides and silicates as condensates, similar to those that condense from a solar-composition gas. This expectation was met and the condensation sequence is shown in Fig. 10 (upper panel). The first condensate is corundum (Al2O3) at 1743 K, followed by hibonite (CaAl12O19) at 1567 K. Gehlenite (Ca2Al2SiO7), the Al-rich endmember of the gehlenite-akermanite solid solution called melilite, appears in addition at 1469 K. This phase consumes Ca, which is much less abundant than Al. This limits the stability of hibonite, and corundum is stable again after melilite appears. With further decrease in temperature, melilite transforms into anorthite (CaAl2Si2O8), and corundum into spinel (MgAl2O4). Cordierite (Mg2Al4Si5O18) appears together with anorthite and spinel below K. In fact, cordierite is not a stable condensate in a solar composition gas, but appears here because of the larger relative abundances of Mg, Si, and Al. Cordierite eventually consumes more Al so that the spinel stability is terminated. Substantial removal of Si and Mg from the gas starts when forsterite (Mg2SiO4) and then enstatite (MgSiO3) condense near 1300 K and, in addition to enstatite, SiO2 appears as a separate phase. The first Ti-bearing condensate is a calcium titanate (Ca4Ti3O10) at 1500 K, which converts to perovskite (CaTiO3) at lower temperatures. Anorthite is the major sink for Ca and perovskite transforms into Ti4O7 shortly after anorthite becomes stable. Metallic iron condenses at 1166 K and phosphorus condenses as Fe3P at 1053 K. Iron sulfide (FeS) only forms at low temperatures of K. In this condensation sequence, corundum, spinel and enstatite are the only minerals which are also found among the major presolar grain types. Reduced condensates such as SiC or graphite do not appear, which suggests that models similar to this, involving a 1.15 M⊙ CO WD, will not contribute to the presolar SiC or graphite grains.
3.2 Condensates for 1.15 M⊙ ONe nova ejecta
The C/O ratio of the first, innermost ejected shell is now , below unity and only slightly lower than that of the CO nova model of the same mass. If the C/O ratio were the sole criterion, oxidized condensates would be expected as well. However, by comparison to solar, the abundances of Al, Ca, Mg and Si are fairly high in ONe ejecta, which means that the C and O chemistries will be affected by the abundances of the rock-forming elements. Fig. 10 (middle panel) shows the calculated condensate stabilities as a function of temperature. The first condensate is corundum at 1644 K, followed by AlN and TiN. The AlN only coexists with corundum for a short temperature interval, and oxidized Al-bearing compounds (i.e., hibonite, melilite, anorthite) coexist with corundum instead at lower temperatures. Near 1120 K, corundum turns into andalusite (Al2SiO5) and cordierite when more of the abundant silicon is removed from the gas. The TiN stability range is interrupted for a brief temperature step from to 1250 K, when TiC is more stable, but the TiC stability is limited by the appearance of SiC at 1235 K. The first Si-bearing condensate is FeSi, and SiC is the next stable one. Sinoite (Si2N2O) enters the suite of condensates at 1110 K, followed by enstatite around 1100 K and SiO2 at K. With the appearance of sinoite and enstatite the SiC stability ends. The occurrence of SiC, corundum, and enstatite in this ejected shell suggests that such intermediate-mass ONe novae could contribute to the known presolar SiC, corundum, and enstatite grain populations. However, unlike for the more massive case discussed below, Si3N4, a rare presolar grain type, is not found among the condensates in this 1.15 M⊙ nova model.
3.3 Condensates for 1.35 M⊙ ONe nova ejecta
The condensate stabilities in the 1.35 M⊙ ONe nova model are shown in Fig. 10 (lower panel). Of the three cases investigated here, this is the only one with a C/O ratio above unity, in the specific shells considered. Condensation of graphite starts at a relatively high temperature of 1960 K. The carbides of silicon and titanium follow at 1690 and 1660 K, respectively. When TiC starts forming in addition to SiC, graphite is no longer stable because the Si and C abundances are approximately the same and SiC consumes carbon. However, graphite appears again at low temperatures ( K) when SiC is no longer stable. In addition to SiC, silicon condenses as iron silicide, silicon nitride, and silicon oxynitride. The latter two compounds are responsible for the termination of SiC stability and these compounds form mainly because the nitrogen abundance is about five times that of silicon (or carbon). For similar reasons, TiC is replaced by TiN near 1240 K. Moreover, aluminum nitride begins to condense at 1080 K but corundum becomes more stable at 980 K. Ca and Mg both form sulfides below K and no other calcium and magnesium compounds appear because S is more abundant than both Ca and Mg combined. The P abundance in this ejected shell is nearly 20 times larger than that of Fe and therefore all iron from iron silicide enters Fe2P at 1020 K. These results suggest that condensates from massive ONe novae could be present among the known major presolar grain types graphite, SiC, Si3N4, and corundum.
4 Discussion
4.1 Mean mass-averaged values versus individual shells
In this Section we will summarize the trends found in our analysis of mean mass-averaged isotopic ratios (i.e., Section 2) and address how they compare with a more detailed approach based on individual shell variations.
4.1.1 N and C isotopic ratios
The most remarkable trends found in our analysis of 14N/15N and 12C/13C ratios can be summarized as follows:
-
•
Large dispersion in N ratios
-
•
In general, larger N ratios for CO models, with huge ratios of about for low mass models
-
•
The N ratio decreases when the adopted white dwarf mass increases, for both CO and ONe models
-
•
Similar (low) C ratios for all models
-
•
CO models yield, in general, lower C ratios than ONe models
As can be seen in Fig. 4, most of these trends, obtained in the framework of mean mass-averaged ratios, still hold when considering individual shells. Despite the large overlap between models, we still can argue that the 14N/15N ratios are dignostic for distinguishing between CO and ONe novae, specially when taking into account that, according to detailed stellar evolution calculations, it is likely that white dwarfs with masses lower than 1.05 M⊙ are of the CO type, whereas more massive objects would be made of ONe. This fact would eliminate the overlap between the two groups in Fig. 4 with regards to N ratios. Moreover, the present plot shows no overlap at all around 14N/15N , which reinforces our claim that such large N ratios are characteristic of CO novae. It is hard to assess if the dependence of the N ratio on the white dwarf mass still holds: despite of the trend seen in Fig. 4 for mass-averaged ratios, the big overlap makes this claim questionable if one gives the same relative importance to all individual shells (but see discussion in Section 2). Concerning C ratios, it is clear from Fig. 4, that all models are characterized by small ratios, regardless of the nova type, the degree of mixing and/or the mass of the compact star. This, indeed, provides a remarkable nova signature, especially when combined with a simultaneous low N ratio (see Fig. 1). Moreover, a recent estimate of the 12C/13C ratio, ranging from 0.88 to 1.89 (Rudy et al. 2003), inferred from near-infrared spectrophotometry of the non-neon nova V2274 Cygni 2001 #1, seems to be fully compatible with the range of values shown in Fig. 4 for some CO novae, when individual shells are taken into account. Furthermore, and for similar reasons as those mentioned above, it is hard to derive any correlation between the C ratios and the nova type when individual layers are taken into account, although Fig. 4 suggests that larger values can be reached in ONe novae. It is worth noting that the largest dispersions in the 12C/13C ratios are found in 1.35 M⊙ ONe models.
4.1.2 O and Ne ratios
The most remarkable trends found for 16O/17,18O and 20Ne/21,22Ne are:
-
•
Moderate to large 16O/18O ratios and moderate 16O/17O ratios for CO models
-
•
Lower O ratios found, in general, for ONe models
-
•
In CO models, the O ratios decrease with increasing adopted white dwarf masses
-
•
Similar 20Ne/21Ne ratios in CO and ONe models, with an overlapping region at 2500 - 10,000
-
•
Much larger 20Ne/22Ne ratios in ONe models than in CO models
As shown in Fig. 5, there is only a small overlap in the O ratios between CO and ONe models even when variation bars are considered. In fact, CO models are somewhat concentrated towards the upper right part of the diagram, whereas ONe models tend to cluster around the lower left corner. We can thus claim that CO models are characterized by larger 16O/17O ratios (with only a small overlap with ONe models around ) whereas a much larger overlapping region, around , is found for 16O/18O between the two nova types. However, the largest and lowest 16O/18O ratios are still achieved in CO and ONe models, respectively. The correlation found between the O ratios and the white dwarf mass for CO models still holds, in general, for 16O/17O. However, a correlation is less pronounced for 16O/18O although models with 0.6, 0.8 and 1.0 CO M⊙ show some trend. It is worth noting that, in general, larger variations are found for 16O/18O than for 16O/17O ratios.
Similar conclusions can be made for Ne ratios when considering individual shells (Fig. 6), in particular on the remarkable differences in 20Ne/22Ne between CO and ONe novae (CO models do not show significant variations relative to the mean mass-averaged values, whereas some variations are present for 20Ne/21Ne) but a larger overlap for 20Ne/21Ne.
4.1.3 Al and Mg ratios
With respect to the 26Al/27Al, 24Mg/25Mg, and 26Mg/25Mg ratios, the main trends can be summarized as follows:
-
•
High Al ratios that overlap completely for both CO and ONe novae
-
•
A tendency for larger 26Al/27Al ratios to be found in nova explosions hosting more massive white dwarfs
-
•
Low Mg ratios, in general, for both CO and ONe novae
-
•
The Mg ratios are nearly independent of the white dwarf mass for ONe models, whereas they show a complicated dependence pattern in CO novae
In general, moderate dispersions are obtained for both Mg and Al isotopic ratios. Complete overlap characterizes the Al ratio plot (see Fig. 7). While high Al ratios are found for both CO and ONe novae (providing another characteristic signature of nova outbursts), no clear dependence on the white dwarf mass is found. However, the maximum 26Al/27Al ratios are obtained for the maximum white dwarf masses adopted for both CO and ONe populations. The extraordinary overlap shown in Fig. 8 does not allow us to discern any trend in the data for both CO and ONe models.
4.1.4 Si ratios
Our final analysis involves the Si isotopic ratios,; they are characterized by the following trends in our models of classical novae:
-
•
Close-to or lower-than-solar 29Si/28Si and close-to-solar 30Si/28Si ratios for all CO models
-
•
Close-to or lower-than-solar 29Si/28Si ratios in all ONe models
-
•
Close-to or lower-than-solar Si/28Si ratios for ONe models with M⊙ , but large 30Si excesses for ONe M⊙
In general, all models are characterized by very small dispersions among individual shells (a remarkable exception being the 30Si excesses in the 1.35 M⊙ ONe models. See Fig. 9). This fact reinforces most of our conclusions based on mean mass-averaged ratios: for instance, CO models with M⊙ are essentially characterized by close-to-solar Si isotopic ratios (i.e., Si/28Si ), whereas CO models of 1.15 M⊙ exhibit a noticeable lower-than-solar 29Si/28Si ratio. Figure 9 suggests also that the dependence of the 30Si excesses on the white dwarf mass for ONe models holds for individual shells: as the mass of the white dwarf is increased we move from lower-than or close-to-solar 30Si/28Si ratios (i.e., M⊙ ) to a region characterized by moderate to huge 30Si excesses. Notice that the huge excess found in all 1.35 M⊙ models provides a valuable and characteristic isotopic signature of a classical nova outburst on a massive ONe white dwarf. A final, interesting aspect, concerns the 29Si/28Si ratios found in ONe models. As shown in Fig. 9, this ratio seems to increase as the mass of the white dwarf increases. This trend, while evident when considering only mean mass-averaged quantities, seems less robust for individual shells, because of a tiny overlap between models. A remarkable situation is found for 1.35 M⊙ ONe models, which exhibit an extraordinary dispersion in Si/28Si: the analysis reveals that whereas a large number of ejected shells are characterized by lower-than and close-to-solar ratios, a few shells show huge 29Si excesses. In principle, this may open up the possibility to form grains with excesses in both 29Si and 30Si in specific shells.
4.2 The effect of nuclear uncertainties
Nuclear uncertainties associated with specific reaction rates important for nova nucleosynthesis may affect, to some extent, the predicted isotopic ratios for a number of elements. In many cases, estimates of the impact of such nuclear uncertainties are obtained from post-processing calculations with temperature and density profiles that, in the best cases, are taken from hydrodynamic models. Usually, such an approach has to be taken with caution, since the lack of convective mixing in these parametrized calculations tends to overestimate the influence of a given nuclear uncertainty.
According to a recent analysis of the effect of uncertainties in nuclear reaction rates for nova nucleosynthesis (Iliadis et al. 2002), present reaction rate estimates give reliable predictions for both 12C/13C and 14N/15N isotopic abundance ratios, in agreement with several tests performed with hydrodynamic models of nova outbursts. In contrast, uncertainties in several reactions can introduce large variations in the final yields for a number of species between Ne and Si. The reader is referred to Iliadis et al. (2002) for a complete list of reactions whose uncertainties may affect predictions for a number of isotopes in the framework of nova nucleosynthesis. However, because of the parametric approach adopted in that paper, the impact of each individual reaction has to be tested properly with a full hydrodynamic calculation.
Reactions whose impact has been confirmed through a series of hydrodynamic tests include 17O(p,)14N, 17O(p,)18F, and 18F(p,)15O, which may significantly affect the 17,18O yields, 21Na(p,)22Mg, 22Na(p,)23Mg, and to some extent 22Ne(p,)23Na, which may affect 21,22Ne (22Na), and 30P(p,)31S. Recent experiments focussed on 18F(p,)15O (Bardayan et al. 2002; Séréville et al. 2003) 21Na(p,)22Mg (Bishop et al. 2003; Davids et al. 2003), 22Na(p,)23Mg (Jenkins et al. 2004), and 30P(p,)31S (Rehm & Lister, 2003) have substantially improved this issue. Indeed, a dramatic example is provided by 30P(p,): the Si/28Si values are substantially reduced when the upper limit for the 30P(p,) rate, instead of the nominal one, is adopted (see José et al. 2001, for details). Moreover, larger differences are found for Si/28Si: the 30Si excesses obtained with the nominal rate increase by up to a factor if the lower limit is adopted, or even turn into deficits with the upper limit. Clearly, a better determination of this critical rate is needed in order to provide more robust predictions for the Si isotopic ratios.
4.3 Comparison with other calculations
We compared our theoretical predictions with results obtained from similar hydrodynamic models of nova outbursts by Kovetz & Prialnik (1997) and Starrfield et al. (1997) for CO novae, and by Starrfield et al. (1998) for ONe novae. It is worth mentioning that only mean-mass averaged ratios have been considered in the abovementioned papers, consequently our comparison will be restricted to this particular approach. In general, there is good agreement with the calculations reported by Kovetz & Prialnik (1997) and by Starrfield et al. (1998) for novae hosting CO white dwarf cores, in particular for 12C/13C and 16O/17O ratios. One difference involves the range of 14N/15N ratios predicted for nova outbursts. The very high 14N/15N ratios reported by Kovetz & Prialnik (1997) and Starrfield et al. (1997) are obtained in explosions that achieve low peak temperatures (i.e. involve low-mass white dwarfs), for which 14N(p,)15O()15N is not very efficient, thus reducing the 15N content and increasing the final 14N/15N ratio. This interpretation is fully consistent with the results presented in this paper for the M⊙ CO white dwarf model, which achieves the highest N ratio. Other differences may result from the specific reaction rate libraries adopted, from details of the treatment of convective transport, or from additional input physics.
Concerning ONe models, there is also an excellent agreement with the calculations reported by Starrfield et al. (1998) for many isotopic ratios, including 12C/13C, 26Al/27Al, and Si/28Si. We stress that, besides the expected differences attributable to the specific choice of input physics, as mentioned above, the main source of differences is probably the specific prescription adopted for the initial amounts of O, Ne, and Mg in the outer shells of the white dwarf, where mixing with the solar-like accreted material takes place. Whereas calculations by Starrfield et al. (1998) assume a core composition based on hydrostatic models of carbon-burning nucleosynthesis by Arnett & Truran (1969), rather enriched in 24Mg (with ratios 16O:20Ne:24Mg ), we use a more recent prescription, taken from stellar evolution calculations of intermediate-mass stars (Ritossa et al. 1996), for which the 24Mg content is much lower (16O:20Ne:24Mg = 10:6:1). It is worth mentioning that calculations based on the Arnett & Truran (1969) abundances yield an unrealistically high contribution of novae to the Galactic 26Al content, in contradiction with the results derived from the COMPTEL map of the 1809 keV 26Al emission in the Galaxy (see Diehl et al. 1995), which points towards young progenitors (type II supernovae and Wolf-Rayet stars). For the purpose of comparison, we list in Tables 2 & 3 model ONeMg1, for which we assumed a 1.25 M⊙ ONeMg WD, with the chemical abundances given by Arnett & Truran (1969). As expected, this model agrees much better with the chemical patterns of the ejecta in the series of models of nova outbursts reported by Starrfield et al.
4.4 The formation of C-rich dust in CO novae
The equilibrium condensation sequences reported in Section 3 predict, for the first time, the types of grains that can be expected to form in the ejecta of both CO and ONe novae. This includes some contribution to the major presolar grain types, namely corundum (CO & ONe novae), silicon carbide (ONe novae) and silicon nitride (only in massive ONe novae). These results confirm that SiC grains are likely to condense in ONe novae, giving support to the inferred ONe nova origin to presolar SiC and graphite grains recently discovered in the Murchison and Acfer 094 meteorites (Amari et al. 2001; Amari 2002). Indeed, silicon carbide and/or carbon dust formation has been inferred through infarred measurements in a number of ONe novae, such as Nova Aql 1982 or Nova Her 1991 (see details in Gehrz et al. 1998). Nevertheless, it is important to point out that we may be facing a problem of limited statistics so conclusions exclusively based on the experimental determinations for only 7 grains can induce a clear bias in our global picture of classical nova outbursts. It is our hope that the recent implementation of new devices, such as the NanoSIMS (Stadermann, Walker, & Zinner 1999a, 1999b; Hoppe 2002), will improve soon the statistics and will help us to extract conclusions in a firmer basis, providing in turn a tool to constraint theoretical nova models. We note that three additional nova candidate grains have recently been located (Nittler & Hoppe 2004).
A puzzling preliminary result obtained in our analysis of equilibrium condensation sequences is that reduced condensates such as SiC or graphite do not form in CO novae (at least for the selected 1.15 M⊙ CO case), and hence, they will not contribute to presolar SiC or graphite grains. Whereas a much deeper analysis of ejecta from a wider sample of CO nova models is required to confirm this result, it remains to be understood which mechanism is responsible for the formation of C-rich dust seen in infrared analyses of CO novae, a feature that seems to be common in many explosions of this type (see Gehrz et al. 1998). Possible explanations include a mechanism capable of dissociating the CO molecule (see Clayton, Liu & Dalgarno 1999, for a radiation-based mechanism to dissociate the CO molecule in a supernova environment), that would drive the condensation sequence out of equilibrium conditions (however, some aspects of the chemistry where the CO molecule is absent have been investigated by Ebel & Grossman (2001), showing that SiC formation is still unlikely). In this respect, the recent spectrophotometric studies of CO emission in nova V2274 Cygni 2001 #1 (Rudy et al. 2003) at two different epochs suggest that, whereas emission from the first overtone of carbon monoxide is seen about 18 days after outburst, the absence of such CO emission at 370 days is an indication of partial destruction of the CO molecules. Among the mechanisms proposed are photodissociation and photoionization (see Shore & Gehrz 2004), charge transfer reactions (Rawlings 1988; Liu, Dalgarno, & Lepp 1992) and dissociation by He+ ions (Lepp, Dalgarno, & McCray 1990). In addition, Scott (2000) has suggested that rotation-driven latitudinal abundance gradients may affect dust formation. Other alternatives involve possible contamination of the outer layers of the main sequence companion (during the previous evolution of the white dwarf progenitor), that in some case may lead to C-enrichment in those shells, or scenarios leading to nova explosions with significant C-enriched envelopes, that may lead to CO ejecta. In this respect, we have performed a hydrodynamic simulation of a 0.6 M⊙ CO white dwarf, identical to the model previously discussed in this paper but with a slightly different composition for the outermost layers of the white dwarf core (for which 60% 12C and 40% 16O has been adopted instead of the usual 12C/16O=1). The results of this test suggest that indeed the outermost ejected envelope is C-rich, allowing for the formation of C-rich dust. Finally, the recent update of the solar abundances (see Lodders 2003), that reduce the C and O content in the solar mixture by about 50%, may help to condense C-rich dust in CO novae thanks to the presence of Si, Mg and Al atoms (in a similar way as described for ONe novae). Hydrodynamic tests to validate this possibility are currently under way.
5 Conclusions
In this paper, we presented a detailed analysis of isotopic ratios in the ejecta of classical novae, for nuclei up to Si, based on a series of 20 hydrodynamic models of the explosion. Both analysis based on global mean mass-averaged ratios and on composition gradients through individual shells were presented. From this study, we conclude that nova grains are, in general, characterized by low C ratios, high Al ratios, and close-to- or slightly lower-than-solar 29Si/28Si ratios. Other predicted isotopic ratios are specific of each nova type (CO or ONe): for instance, we expect that grains condensed in the ejecta from massive ONe novae will exhibit significant 30Si excesses (with the posibility of a 29Si excess not being ruled out in the outermost ejected shells), whereas those resulting from explosions in CO novae will show close-to-solar 30Si/28Si ratios. Indeed, our study suggests that the ejecta from ONe novae are characterized by low N ratios whereas CO novae show a large dispersion in the N ratios, with values ranging from 0.1 to more than 1000. With respect to Ne, ONe novae are characterized by large 20Ne/21Ne and 20Ne/22Ne ratios, whereas CO novae show large 20Ne/21Ne but small 20Ne/22Ne ratios. However, it is worth noting that predictions of N and Ne isotopic ratios in the grains are difficult because of a likely N isotopic equilibration, and also because 22Ne excesses could come both from 22Ne implantation or from 22Na in situ decay.
In addition, we report on equilibrium condensation sequences that predict, for the first time, the types of grains that are expected to form in the ejecta of both CO and ONe novae. Our analysis shows that the ejecta of 1.15 M⊙ CO novae are likely contributors to the known presolar populations of corundum, spinel, and enstatite grains. 1.15 M⊙ ONe novae can produce corundum and enstatite grains as well as SiC grains. The more massive 1.35 M⊙ novae allow formation of corundum, silicon carbide, and silicon nitride grains. This analysis points out that SiC grains are likely to condense in the ejecta from ONe novae and supports the inferred ONe nova origin of the sample of presolar SiC and graphite grains isolated from the Murchison and Acfer 094 meteorites (Amari et al. 2001; Amari 2002). Among the presolar oxide grains discovered so far no oxide grain with a nova signature has been discovered to date, although they are likely to condense in most (if not all) nova explosions, according to this work. These grains would be clearly identified by huge 17O and somewhat smaller 18O excesses.
We expect that these theoretical estimates will help to correctly identify nova grains embedded in primitive meteorites. Indeed, the recent development of new instruments, such as the NanoSIMS is expected to lead to future identification of nova grains. The improved spatial resolution and sensitivity of this instrument, together with its capability to measure simultaneously several isotopes, opens new possibilities, including measurements of elemental and isotopic compositions inside the grains (see Stadermann et al. 2002). Such accurate sources of information will help to constrain nova models in a much more precise way.
6 Appendix. Nucleosynthesis and Nova Models
Tables 2 & 3 list the mean mass-averaged isotopic ratios in the ejected envelopes from a sample of 20 hydrodynamic models of classical nova outbursts (José & Hernanz 1998; Hernanz et al. 1999; José et al. 2001, and unpublished data). Calculations have been carried out by means of the one-dimensional, implicit, Lagrangian, hydrodynamical code SHIVA. Minimum and maximum ratios for individual ejected shells (in square brackets) are also given for completeness.
Each model listed in Tables 2 & 3 is characterized by the mass of the underlying white dwarf, as well as by the initial envelope composition, which distinguishes explosions taking place on white dwarfs hosting either CO or ONe cores. As discussed in José & Hernanz (1998), the models assume mixing between material from the outermost core and the solar-like accreted envelope (see also Starrfield el al. 1998, and references therein) in order to mimic the unknown mechanism responsible for the enhancement in metals, essentially 12C, which ultimately powers the explosion. To parametrize this process, different degrees of mixing, ranging from 25% to 75%, have been considered and are also indicated in the Tables. The adopted composition of the outer layers for CO white dwarfs is X(12C)=0.495, X(16O)=0.495, and X(22Ne)=0.01 (Salaris et al. 1997). For ONe white dwarfs we used X(16O)=0.511, X(20Ne)=0.313, X(12C)=, X(23Na)=, X(24Mg)=, X(25Mg)=, X(27Al)=, X(26Mg)=, X(21Ne)=, and X(22Ne)=. These values correspond to the composition of the remnant of a 10 M⊙ population I star, evolved from the H-burning main sequence phase up to the thermally pulsing super-asymptotic giant branch stage (Ritossa et al. 1996). Solar abundances were taken from Anders & Grevesse (1989). For comparison, we include also results from model ONeMg1, where the adopted chemical composition of the white dwarf core is taken from carbon-burning nucleosynthesis calculations by Arnett & Truran (1969) (see Section 4.3, for details). We note that this rather old prescription for the white dwarf is the one assumed in all calculations of ONe(Mg) novae published by Starrfield’s group up to now.
Table 3 summarizes the different initial isotopic ratios in the sample of models presented in this paper. Although the initial 13C abundance is the same in both CO and ONe novae (i.e., a fraction of the solar content, depending on the adopted degree of mixing), the much higher initial 12C content in CO models results in initial 12C/13C ratios different from those in ONe models: they range from 5000 to 44,000 (25% to 75% mixing) for CO, and from 180 to 900 (25% to 75% mixing) for ONe models. The initial 14N/15N ratio for all models is solar. Because oxygen in the white dwarf (for both CO and ONe models) is almost pure 16O, the initial oxygen ratios are extremely high. Values depend on the degree of mixing, which strongly modifies the 16O content in the envelope: for CO models, the initial 16O/18O ratios range from 9100 (25% mixing) to 78,000 (75% mixing), whereas 16O/17O ratios range from 48,000 (25%) to 410,000 (75%). Similar values are found for ONe models: 16O/18O ratios range from 9500 (25%) to 80,000 (75%), whereas 16O/17O ratios range from 49,000 (25%) to 420,000 (75%). The 20Ne/22Ne initial ratios are larger in ONe novae (i.e., 74 - 78, depending on the degree of mixing) than in CO novae (0.06 for 75% mixing to 0.5 for 25% mixing). The initial 20Ne/21Ne ratio is 412 (the solar value) for the CO models, whereas a value around 55 corresponds to the ONe models. CO models have initially solar Mg ratios (i.e., 26Mg/25Mg= 1.1; 24Mg/25Mg=7.9), since Mg is only present in the accreted material. In contrast, ONe models are characterized by 26Mg/25Mg= 0.6 and 24Mg/25Mg=3.6 (where Mg from both core material and accreted envelope is taken into account). In both cases, the initial isotopic ratios are nearly independent of the adopted degree of mixing. Finally, all silicon initially present in the envelope comes from the white dwarf companion in solar proportions (i.e., Si/28Si = 0), regardless of the nova type and of the degree of mixing.
Most CO and ONe models listed in Tables 2 & 3 have been computed with the same nuclear reaction network, consisting of isotopes, ranging from 1H to 40Ca and linked through a net containing 370 nuclear reactions (details can be found in José & Hernanz 1998). Exceptions are models ONe4, ONe7, CO2 and CO8, for which updated 18F+p rates have been used (see Hernanz et al. 1999, for details), and models CO1 and ONe9, for which both 18F+p and S-Ca updated rates have been taken into account (see José et al. 2001, for details).
References
- Amari et al. (1995) Amari, S., Lewis, R. S., & Anders, E. 1995, Geochim. Cosmochim. Acta, 59, 1411
- Amari et al. (2001) Amari, S., Gao, X., Nittler, L. R., Zinner, E., José, J., Hernanz, M., & Lewis, R. S. 2001, ApJ, 551, 1065 (Ama01)
- Amari (2002) Amari, S. 2002, New Astron. Rev., 46, 519
- Andreä et al. (1994) Andreä, J., Drechsel, H., and Starrfield, S. 1994, A&A , 291, 869a
- Anders & Grevesse (1989) Anders, E. & Grevesse, N. 1989, Geochim. Cosmochim. Acta, 53, 197
- Arnett & Truran (1969) Arnett, W.D. & Truran, J.W. 1969, ApJ, 157, 339
- Bardayan et al. (2002) Bardayan, D., et al. 2002, PRL, 89, 262501
- Bishop et al. (2003) Bishop, S., et al. 2003, PRL, 90, 162501
- Clayton et al. (1999) Clayton, D.D., Liu, W., & Dalgarno, A. 1999, Science, 283, 1290
- Coc et al. (2000) Coc, A., Hernanz, M., José, J., & Thibaud, J.P. 2000, A&A , 357, 561
- Davids et al. (2003) Davids, B., et al. 2003, PRC, 68, 055805
- Diehl et al. (1995) Diehl, R., et al. 1995, A&A , 298, 445
- Ebel & Grossman (2001) Ebel, D.S. & Grossman, L. 2001, Geochim. Cosmochim. Acta, 65, 469
- Evans (1990) Evans, A. 1990, in The Physics of Classical Novae, A. Cassatella, R. Viotti (eds.), Springer-Verlag:Berlin, p. 253
- Gehrz et al. (1993) Gehrz, R.D., Truran, J.W., & Williams, R.E. 1993, in Protostars and Planets III, E.H. Levy, J.I. Lumine (eds.), U. Arizona Press:Tucson, p. 75
- Gehrz et al. (1998) Gehrz, R.D., Truran, J.W., Williams, R.E. & Starrfield, S. 1998, PASP, 110, 3
- Gehrz (1999) Gehrz, R.D. 1999, Phys. Rep., 311, 405
- Gehrz (2002) Gehrz, R.D. 2002, in Classical Nova Explosions, M. Hernanz, J. José (eds.), AIP:New York, p. 198
- Hernanz et al. (1999) Hernanz, M., José, J., Coc, A., Gómez-Gomar, J., & Isern, J. 1999, ApJ, 526, L97 (HJCGI99)
- Hoppe et al. (1995) Hoppe, P., Amari, S., Zinner, E., & Lewis, R. S. 1995, Geochim. Cosmochim. Acta, 59, 4029 (Hop95)
- Hoppe (2002) Hoppe, P. 2002, New Astron. Rev., 46, 589
- Iliadis et al. (2002) Iliadis, C., Champagne, A., José, J., Starrfield, S., & Tupper, P. 2002, ApJS, 142, 105
- Jenkins et al. (2004) Jenkins, D., et al. 2004, PRL, 92, 031101
- José & Hernanz (1998) José, J. & Hernanz, M. 1998, ApJ, 494, 680 (JH98)
- José et al. (1999) José, J, Coc, A., & Hernanz, M. 1999, ApJ, 520, 347 (JCH99)
- José et al. (2001) José, J, Coc, A., & Hernanz, M. 2001, ApJ, 560, 897 (JCH01)
- Kovetz & Prialnik (1997) Kovetz, A. & Prialnik, D. 1997, ApJ, 477, 356
- Lepp, Dalgarno, & McCray (1990) Lepp, S., Dalgarno, A., & McCray, R. 1990, ApJ, 358, 262
- Liu, Dalgarno, & Lepp (1992) Liu, W., Dalgarno, A., & Lepp, S. 1992, ApJ, 396, 679
- Lodders (2003) Lodders, K. 2003, ApJ, 591, 1220
- Lodders et al. (2004) Lodders, K., et al. 2004, in preparation
- Lodders & Fegley Jr. (1995) Lodders, K. & Fegley Jr., B. 1995, Meteoritics, 30, 661
- Lodders & Fegley Jr. (1997) Lodders, K. & Fegley Jr., B. 1997, in Astrophysical Implications of the Laboratory Study of Presolar Materials, T.J. Bernatowicz, E. Zinner (eds.), AIP:New York, p. 391
- Morisset & Pequignot (1996) Morisset, C. & Pequignot, D. 1996, A&A , 312, 135
- Nichols et al. (2004) Nichols, R. J., Jr., Kehm, K., Hohenberg, C. M., Amari, S., & Lewis, R. S. 2004, Geochim. Cosmochim. Acta, submitted (Nic04)
- Nittler & Hoppe (2004) Nittler, L. R. & Hoppe, P. 2004, Lunar & Planetary Sci., 35, Abstract # 1598
- Rawlings (1988) Rawlings, J.M.C. 1988, MNRAS, 232, 507
- Rawlings & Evans (2002) Rawlings, J.M.C. & Evans, A. 2002, in Classical Nova Explosions, M. Hernanz, J. José (eds.), AIP:New York, p. 270
- Rehm & Lister (2003) Rehm, E. & Lister, C.J. 2003, private comm.
- Ritossa, García–Berro & Iben (1996) Ritossa, C., García–Berro, E., & Iben, I. 1996, ApJ, 460, 489
- Rudy et al. (2003) Rudy, R.J., Dimpfl, W.L., Lynch, D.K., Mzuk, S., Venturini, C.C., Wilson, J.C., Puetter, R.C., & Perry, R.B. 2003, ApJ, 596, 1229
- Salaris et al. (1997) Salaris, M., Domínguez, I., García–Berro, E., Hernanz, M., Isern, J., & Mochkovitch, R. 1997, ApJ, 486, 413
- Scott (2000) Scott, A.D. 2000, MNRAS, 313, 775
- Séréville et al. (2003) Séréville, N. de, et al. 2003, PRC, 67, 052801
- Shore et al. (1994) Shore, S.N., Starrfield, S., González-Riestra, R., Hauschildt, P.H., & Sonneborn, G. 1994, Nat., 369, 539
- Shore (2002) Shore, S.N. 2002, in Classical Nova Explosions, M. Hernanz, J. José (eds.), AIP:New York, p. 175
- Shore & Gehrz (2004) Shore, S.N., Gehrz, R.D. 2004, A&A , in press
- Snijders et al. (1987) Snijders, M. A. J., Batt, T. J., Roche, P. F., Seaton, M. J., Spoelstra, T. A. T., and Blades, J.V C. 1987, MNRAS, 228, 329
- Stadermann et al. (1999a) Stadermann, F.J., Walker, R.M., & Zinner, E. 1999a, Lunar & Planetary Sci., 30, CD-ROM Abstract # 1407
- Stadermann et al. (1999b) Stadermann, F.J., Walker, R.M., & Zinner, E. 1999b, Meteoritics & Planetary Sci., 34, A111
- Stadermann et al. (2002) Stadermann, F.J., Bernatowicz, T., Croat, T.K., Zinner, E., Messenger, S., & Amari, S. 2002, Lunar & Planetary Sci., 33, Abstract # 1796
- Stadermann et al. (2004) Stadermann, F.J., et al. 2004, Geochim. Cosmochim. Acta, submitted
- Starrfield et al. (1972) Starrfield, S., Truran, J.W., Sparks, W.M., & Kutter, G.S. 1972, ApJ, 176, 169
- Starrfield et al. (1997) Starrfield, S., Gehrz, R., & Truran, J.W. 1997, in Astrophysical Implications of the Laboratory Study of Presolar Materials, T.J. Bernatowicz, E. Zinner (eds.), AIP:New York, p. 203
- Starrfield (1989) Starrfield, S. 1989, in Classical Novae, A. Evans, M. Bode (eds.), Wiley:New York, p. 123
- Starrfield et al. (1998) Starrfield, S., Truran, J.W., Wiescher, M.C., & Sparks, W.M. 1998, MNRAS, 296, 502
- Starrfield (2002) Starrfield, S. 2002, in Classical Nova Explosions, M. Hernanz, J. José (eds.), AIP:New York, p. 89
- Zinner (1998) Zinner, E. 1998, Annual Rev. Earth and Planet. Sci., 26, 147
| GrainaaThe Solar N ratio in the Table is that of the air. Grains AF… are from the Acfer 094 meteorite, whereas grains KJ… and KF… are from the Murchison meteorite. Delta values measure deviations from the solar Si isotopic ratios in permil (see Section 2.4 for definition.). Errors are 1. | Composition | 12C/13C | 14N/15N | (29Si/28Si) | (30Si/28Si) | 26Al/27Al | 20Ne/22Ne |
|---|---|---|---|---|---|---|---|
| AF15bB-429-3 (Ama01) | SiC | ||||||
| AF15bC-126-3 (Ama01) | SiC | ||||||
| KJGM4C-100-3 (Ama01) | SiC | 0.0114 | |||||
| KJGM4C-311-6 (Ama01) | SiC | 0.08 | |||||
| KJC112 (Hop95) | SiC | ||||||
| KFC1a-551 (Ama01) | C | ||||||
| KFB1a-161 (Nic03) | C | ||||||
| Solar | 89 | 272 | 14 | ||||
| Nova Models |
| ModelaaAll models have been computed with the nuclear reaction network described in JH98, except Models ONe4, ONe7, CO2 and CO8 (HJCGI99) and Models CO1 and ONe9 (JCH01). See Appendix, for details. | Mass (M⊙ ) | Initial composition | 12C/13C | 14N/15N | 16O/17O | 16O/18O | 20Ne/21Ne | 20Ne/22Ne |
|---|---|---|---|---|---|---|---|---|
| ONe1 | 1.00 (JH98) | 50% ONe | 0.83 [0.59-1.4] | 3.6 [0.59-27.8] | 10 [7.1-17.7] | 23.3 [15.3-73.6] | 9950 [4320-27,400] | 97 [89.9-103] |
| ONe2 | 1.15 (JH98) | 25% ONe | 0.85 [0.67-1.9] | 1.9 [0.55-3.6] | 2.3 [1.5-4.2] | 11.3 [8.9-23.6] | 7270 [3990-9170] | 159 [121-169] |
| ONe3 | 1.15 (JH98) | 50% ONe | 0.89 [0.23-1.6] | 1 [0.39-2.4] | 4.6 [3.3-18.5] | 22.5 [10.5-63.8] | 6300 [3920-8290] | 113 [100-120] |
| ONe4 | 1.15 (HJCGI99) | 50% ONe | 0.76 [0.63-2.0] | 1.2 [0.36-1.9] | 3.8 [2.5-5.4] | 388 [309-663] | 2200 [966-3540] | 109 [72.9-119] |
| ONe5 | 1.15 (JH98) | 75% ONe | 0.88 [0.65-1.8] | 1.2 [0.35-3.5] | 6 [4.3-10.6] | 35.5 [22.2-183] | 6830 [4600-11,900] | 108 [78.1-118] |
| ONe6 | 1.25 (JH98) | 50% ONe | 0.95 [0.73-2.2] | 0.82 [0.30-1.5] | 1.9 [1.5-3.3] | 19 [13.9-49.3] | 5400 [3510-7080] | 181 [113-190] |
| ONe7 | 1.25 (HJCGI99) | 50% ONe | 0.79 [0.60-2.4] | 0.97 [0.28-1.6] | 1.9 [1.4-2.9] | 220 [188-394] | 1620 [804-2770] | 153 [77.9-185] |
| ONe8 | 1.35 (JH98) | 50% ONe | 1.5 [0.50-3.2] | 0.41 [0.14-0.61] | 1.4 [0.63-2.6] | 25.3 [22.7-76.2] | 3090 [2460-3340] | 220 [56.9-459] |
| ONe9 | 1.35 (JCH01) | 50% ONe | 1.5 [0.54-3.1] | 0.40 [0.14-0.58] | 1.4 [0.68-2.9] | 283 [176-529] | 557 [426-641] | 125 [37.2-352] |
| ONe10 | 1.35 (JH98) | 75% ONe | 1.1 [0.28-2.7] | 0.25 [0.12-0.52] | 1.9 [1.7-3.7] | 56.9 [46.6-265] | 3000 [2480-4210] | 247 [79.9-1430] |
| ONeMg1 | 1.25 | 50% ONeMg | 0.73 [0.52-2.4] | 1.0 [0.34-1.6] | 2.6 [2-8.9] | 22 [11.2-211] | 5060 [4190-5740] | 1550 [818-2890] |
| CO1 | 0.6 | 50% CO | 1.8 [1.7-1.8] | 1370 [742-1960] | 232 [230-236] | 38,800 [33,800-43,000] | 26,750 [20,300-33,400] | 0.18 [0.18-0.18] |
| CO2 | 0.8 (HJCGI99) | 50% CO | 0.51 [0.42-1.8] | 60 [21.4-177] | 63 [56.1-178] | 3960 [3400-20,600] | 17,670 [3120-46,200] | 0.18 [0.18-0.18] |
| CO3 | 0.8 (JH98) | 25% CO | 0.45 [0.39-0.63] | 103 [21.3-245] | 41.9 [38.8-66] | 174 [154-436] | 43,500 [12,000-89,700] | 0.51 [0.51-0.53] |
| CO4 | 0.8 (JH98) | 50% CO | 0.52 [0.49-1.8] | 127 [20.8-142] | 60.4 [57.8-178] | 502 [474-3790] | 21,500 [3080-26,800] | 0.18 [0.18-0.18] |
| CO5 | 1.0 (JH98) | 50% CO | 0.30 [0.29-0.70] | 19 [6-267] | 31.9 [30.9-46.8] | 123 [95.2-423] | 15,900 [5480-147,000] | 0.19 [0.18-0.19] |
| CO6 | 1.15 (JH98) | 25% CO | 0.71 [0.50-0.78] | 3.3 [1.6-8.5] | 7.6 [5.8-9.7] | 22 [16.1-120] | 7740 [3640-14,200] | 0.70 [0.61-0.72] |
| CO7 | 1.15 (JH98) | 50% CO | 0.54 [0.50-1] | 3.0 [2.4-5.3] | 10.6 [10.4-16.7] | 62.2 [35.7-443] | 5990 [2740-15,500] | 0.22 [0.2-0.23] |
| CO8 | 1.15 (HJCGI99) | 50% CO | 0.54 [0.50-0.93] | 2.8 [2.4-13.5] | 10.9 [10.3-15.7] | 854 [750-3730] | 2640 [1240-10,800] | 0.22 [0.2-0.23] |
| CO9 | 1.15 (JH98) | 75% CO | 0.39 [0.32-0.88] | 5.2 [3.2-12] | 19 [18.6-26.5] | 103 [51.3-548] | 7580 [2690-22,700] | 0.078 [0.07-0.082] |
| Solar ratios | 89 | 272 | 2622 | 498 | 412 | 14 |
| Model | Mass (M⊙ ) | Initial composition | 24Mg/25Mg | 26Mg/25Mg | 26Al/27Al | (29Si/28Si) | (30Si/28Si) |
|---|---|---|---|---|---|---|---|
| ONe1 | 1.00 (JH98) | 50% ONe | 0.026 [0.005-0.09] | 0.090 [0.082-0.11] | 0.23 [0.19-0.32] | -951 [(-951)-(-949)] | -965 [(-965)-(-964)] |
| ONe2 | 1.15 (JH98) | 25% ONe | 0.021 [0.013-0.037] | 0.096 [0.076-0.13] | 0.25 [0.23-0.3] | -803 [(-808)-(-784)] | 296 [(-128)-320] |
| ONe3 | 1.15 (JH98) | 50% ONe | 0.036 [0.004-0.076] | 0.11 [0.074-0.14] | 0.22 [0.16-0.27] | -852 [(-853)-(-848)] | -645 [(-744)-(-624)] |
| ONe4 | 1.15 (HJCGI99) | 50% ONe | 0.10 [0.04-0.29] | 0.16 [0.14-0.18] | 0.24 [0.22-0.27] | -788 [(-795)-(-756)] | -105 [(-407)-(-73)] |
| ONe5 | 1.15 (JH98) | 75% ONe | 0.21 [0.043-0.65] | 0.13 [0.082-0.21] | 0.22 [0.21-0.24] | -796 [(-808)-(-756)] | -354 [(-482)-(-325)] |
| ONe6 | 1.25 (JH98) | 50% ONe | 0.087 [0.032-0.19] | 0.11 [0.083-0.15] | 0.28 [0.25-0.30] | -701 [(-734)-(-585)] | 1380 [722-1470] |
| ONe7 | 1.25 (HJCGI99) | 50% ONe | 0.13 [0.05-0.33] | 0.15 [0.13-0.17] | 0.28 [0.26-0.32] | -655 [(-698)-(-447)] | 2020 [1230-2110] |
| ONe8 | 1.35 (JH98) | 50% ONe | 0.089 [0.023-0.19] | 0.14 [0.12-0.16] | 0.42 [0.26-0.46] | -74 [(-677)-1760] | 7730 [7260-9700] |
| ONe9 | 1.35 (JCH01) | 50% ONe | 0.12 [0.026-0.27] | 0.15 [0.14-0.17] | 0.42 [0.27-0.46] | -54 [(-666)-1830] | 8150 [7760-9580] |
| ONe10 | 1.35 (JH98) | 75% ONe | 0.19 [0.034-0.38] | 0.15 [0.056-0.19] | 0.35 [0.19-0.39] | -113 [(-742)-1210] | 7140 [7000-7770] |
| ONeMg1 | 1.25 | 50% ONeMg | 0.47 [0.14-1.8] | 0.043 [0.018-0.053] | 0.44 [0.34-0.88] | -546 [(-652)-87.8] | 3780 [3500-3830] |
| CO1 | 0.6 | 50% CO | 4.3 [4.3-4.3] | 0.65 [0.65-0.65] | 0.006 [0.006-0.006] | -3.3 [(-3.3)-(-3.3)] | 1.9 [1.9-1.9] |
| CO2 | 0.8 (HJCGI99) | 50% CO | 0.31 [0.22-1.8] | 0.16 [0.15-0.35] | 0.095 [0.021-0.11] | -6.3 [(-6.3)-(-3.3)] | -1.2 [(-1.20)-1.9] |
| CO3 | 0.8 (JH98) | 25% CO | 0.16 [0.12-0.7] | 0.14 [0.13-0.21] | 0.18 [0.074-0.2] | -6.4 [(-6.4)-(-2.4)] | -3.2 [(-3.2)-0.85] |
| CO4 | 0.8 (JH98) | 50% CO | 0.27 [0.25-1.8] | 0.15 [0.15-0.34] | 0.14 [0.023-0.14] | -6.3 [(-6.3)-(-3.3)] | -1.2 [(-1.2)-1.9] |
| CO5 | 1.0 (JH98) | 50% CO | 0.060 [0.025-0.31] | 0.10 [0.099-0.14] | 0.39 [0.23-0.42] | -33 [(-35.6)-(-18.1)] | 4.9 [(-1.9)-6.5] |
| CO6 | 1.15 (JH98) | 25% CO | 0.042 [0.017-0.15] | 0.096 [0.08-0.12] | 0.25 [0.23-0.34] | -677 [(-697)-(-497)] | -47.1 [(-53.6)-(-21.2)] |
| CO7 | 1.15 (JH98) | 50% CO | 0.12 [0.024-0.69] | 0.094 [0.073-0.18] | 0.38 [0.36-0.43] | -449 [(-480)-(-236)] | 29.6 [15.8-45.5] |
| CO8 | 1.15 (HJCGI99) | 50% CO | 0.11 [0.028-0.61] | 0.14 [0.12-0.2] | 0.39 [0.35-0.43] | -435 [(-478)-(-243)] | 32.6 [19.8-52.1] |
| CO9 | 1.15 (JH98) | 75% CO | 0.080 [0.01-0.46] | 0.070 [0.06-0.12] | 0.58 [0.53-0.59] | -267 [(-296)-(-159)] | 90.1 [71.3-97.4] |
| Solar ratios | 7.9 | 1.1 | 0 | 0 | 0 |
| Initial ratioaaFor all CO & ONe Models, 26Al/27Al = (29,30Si/28Si) = 0. | CO Models | ONe Models | ||||
|---|---|---|---|---|---|---|
| 25% | 50% | 75% | 25% | 50% | 75% | |
| 12C/13C | 4987 | 14,782 | 44,165 | 181 | 362 | 906 |
| 14N/15N | 271 | 271 | 271 | 271 | 271 | 271 |
| 16O/17O | 47,724 | 137,929 | 408,542 | 49,182 | 142,302 | 421,663 |
| 16O/18O | 9064 | 26,196 | 77,592 | 9340 | 27,026 | 80,084 |
| 20Ne/21Ne | 412 | 412 | 412 | 56 | 55 | 55 |
| 20Ne/22Ne | 0.51 | 0.18 | 0.059 | 74 | 78 | 79 |
| 24Mg/25Mg | 7.9 | 7.9 | 7.9 | 3.7 | 3.6 | 3.6 |
| 26Mg/25Mg | 1.1 | 1.1 | 1.1 | 0.61 | 0.60 | 0.60 |