Are galactic disks dynamically influenced by dust?
Dynamically cold components are well known to destabilize hotter, even much more massive components. E.g. stellar disks can become unstable by a small admixture of cold gas or proto-planetary disks might be destabilized by a small fraction of dust. In this paper we studied the dynamical influence of a cold dust component on the gaseous phase in the central regions of galactic disks. We performed two-dimensional hydrodynamical simulations for flat multi-component disks embedded in a combined static stellar and dark matter potential. The pressure-free dust component is coupled to the gas by a drag force depending on their velocity difference.
It turned out that the most unstable regions are those with either a low or near to minimum Toomre parameter or with rigid rotation, i.e. the central area. In that regions the dust-free disks become most unstable for high azimuthal modes (), whereas in dusty disks all modes have a similar amplitude resulting in a patchy appearance. The structures in the dust have a larger contrast between arm and inter-arm regions than those of the gas. The dust peaks are frequently correlated with peaks of the gas distribution, but they do not necessarily coincide with them. Therefore, a large scatter in the dust-to-gas ratios is expected. The appearance of the dust is more cellular (i.e. sometimes connecting different spiral features), whereas the gas is organized in a multi-armed spiral structure.
We found that an admixture of 2% dust (relative to the mass of the gas) destabilizes gaseous disks substantially, whereas dust-to-gas ratios below 1% have no influence on the evolution of the gaseous disk. For a high dust-to-gas ratio of 10% the instabilities reach a saturation level already after 30 Myr. The stability of the gaseous disks also strongly depends on their Toomre parameter. But even in hot gaseous disks a destabilizing influence of the dust component has been found.
Key Words.:
Galaxies: kinematics and dynamics – Galaxies: spiral – Interstellar Medium: dust – Interstellar Medium: structure – Physical Data and Processes: Instabilities1 Introduction
Recent high resolution optical and sub-mm observations of the central regions of galaxies have revealed that the circumnuclear regions contain stellar-gaseous mini-disks with a size of about a few hundred pc. An extensive observational program on HST by Carollo et al. (carollo97 (1997), 1998a , 1998b ) who studied the nuclear regions of seventy five early and intermediate type disk galaxies, unveiled an astonishing richness of structure in the nuclear regions of galaxies. About sixty percent of their sample have mini-bars, spiral-like dust lanes, star-forming rings and spiral arms. Many nuclear regions are also well described as patchy or multi-armed. Further investigations by Regan & Mulchaey (regan99 (1999)) showed that spirals are the most common morphological structures in the central regions of galaxies. Often the spiral patterns are not associated with the outer grand-design spiral patterns of these galaxies which points to different physical origins.
Revealing the nature of the mini-spirals in the central regions of galaxies is of great importance for our understanding of a variety of astrophysical processes such as the mass accretion rate of the central engines of galaxies or the evolution of the galactic disks themselves. Therefore, the dynamics of gaseous density waves in the central region of disk galaxies has attracted more and more attention during the last decade. Athanassoula (athanassoula92 (1992)) studied the gas flows in and around bars. She demonstrated by orbital analysis and 2D-hydrodynamical simulations that the dynamical properties of the disk in connection with a rotating large-scale bar, especially the existence of different periodic orbit families (or equivalently the existence of inner Lindblad resonances (ILR)) are key criteria for the existence and shape of dust lanes. If and -orbits are existing, gas (and dust) might follow first -orbits, until they enter regions which support also ”anti-bar” orbits. In these turbulent regions the gas dissipates energy and switches to or -orbits which brings the gas to the central area.
Different to the interpretation based on a stellar orbital analysis Englmaier & Shlosman (englmaier00 (2000)) suggested that the mini-spirals in the central regions of galactic disks are related to the formation of grand-design spiral patterns in galaxies. They argued that gas density waves – different to stellar density waves – are not completely damped or absorbed at the ILR and, thus, they may generate spiral structures at all radii including the nuclear regions. Such a model might explain the continuity of the spiral features at small and large radii as well as the low arm-interarm contrast observed in galactic centers. This scenario is supported by their numerical simulations studying the gas response to a background gravitational potential composed of a galactic disk and a large-scale stellar bar.
An alternative application of barred potentials as driving engines for the generation of nuclear spirals is to invoke secondary bars or small nuclear bars located well inside the ILR. Wada & Koda (wada01 (2001)) performed a set of multi-phase hydrodynamical simulations studying the dynamics of central mini-disks influenced by the potential of a weak mini-bar. They took into account the self-gravity of the gas as well as cooling and heating processes. They found the formation of filaments and cusps on a parsec-scale which resemble the observed morphological patterns in the central regions of galaxies. Another good example for the influence of a nuclear bar is the match between observations and numerical (SPH-)models by Ann (ann01 (2001)). He reproduced well the shape and orientation of the nuclear ring of the barred galaxy NGC 4314. Jogee et al. (jogee02 (2002)) studied the propagation of density waves triggered by bar shocks which were derived from multiwavelength observations of NGC 5248. Motivated by the existence of massive molecular arms inside the disk they incorporated the self-gravity of the gas. Their comparative analysis shows an agreement between the modelled and observed gas morphology, gas kinematics, and pitch angle of the spirals. These results argue for a dynamical coupling between the nuclear region and the surrounding disk.
A common property of all the mentioned mechanisms is that they usually result in structures dominated by two or a few arms. E.g. a nuclear bar would naturally induce a two-armed structure. Similarly, grand-design features penetrating from the outer disk through the ILR will also keep their symmetry properties characterized by low azimuthal mode numbers. However, Elmegreen et al. (elmegreen02 (2002)) found that nuclear dust spirals differ from main-disk spirals in several respects: the nuclear spirals are not associated with star formation, they are very irregular with both trailing and leading components that often cross, and they completely fill the inner disk with a constant surface density.
Little is yet known about the dynamics on the 10-100 pc scale of the central regions of galaxies. Attempts to explain the existence of such structures as a result of gravitational instability of the dynamically decoupled mini-disks were believed to be unsuccessful because of the low surface densities of the fast spinning gaseous mini-disks. As an alternative to gravitational instability as an origin of structure in mini-disks Elmegreen et al. (elmegreen98 (1998)) suggested that mini-spirals may be the result of an acoustic amplification of the grand-design spirals propagating to the central regions of galaxies. Montenegro et al. (montenegro99 (1999)) demonstrated that such an amplification mechanism can indeed work inside the ILR or outside the OLR.
All discussed mechanisms have some weak points and can not fully account for all the observational data. We consider a new approach to understand the origin of mini-spirals in the central regions of galaxies. Observations show that the circumnuclear disks of galaxies are dusty, and dust may play an important rôle in their dynamics. It is known that cold components greatly destabilize multi-component gravitating disks (Jog & Solomon jog84 (1984), Bertin & Romeo bertin88 (1988), Orlova et al. orlova02 (2002)). An admixture of a dynamically cold dust component to the gaseous mini-disks of galaxies might therefore strongly destabilize the disk leading to the formation of spiral structure. From a stability analysis Noh et al. (noh91 (1991)) showed that a dust component can strongly destabilize proto-planetary disks. The admixture of only 2% of dust can enhance the growth rates of the dominant gaseous phase significantly. This effect becomes even larger with less massive disks. A conservative estimate of the dust-to-gas ratio in the solar neighborhood gives an average value of 0.6% ranging from 0.2% up to 4% in regions (Spitzer spitzer78 (1978)). These are lower limits because large grains which contain much mass do not have any detectable extinction. Recent observational data by Maiolino et al. (maiolino01 (2001)) exhibit evidence for anomalous properties of the dust grains in the galactic nuclei. By comparing the reddening of optical and infrared broad lines and the X-ray absorbing column density they found that the ratio is significantly lower in the circumnuclear regions of galaxies than in the diffuse regions of galaxies. This indicates that the dust composition in the circumnuclear regions of galaxies could be dominated by large grains and, thus, substantial amounts of dust might have been undetected so far.
In this paper we study whether the origin of mini-spirals can be explained by a destabilizing rôle of a dust component in the circumnuclear disks. We restrict our analysis here to systems without a nuclear or a large scale bar. Also we do not consider here any formation or destruction processes of dust. Thus, we investigate the impact of a frictional force exerted by the interaction of dust and gas on the dynamics of galactic nuclear regions. This investigation is done by means of 2-dimensional multi-component hydrodynamical simulations. In the next Section we describe the numerical model, i.e. the basic hydrodynamical equations and the dust-gas interaction as well as our numerical code. In Sect. 3 the results of the numerical simulations are shown which are discussed in more detail in Sect. 4. Finally, a summary is given in Sect. 5.
2 Numerical method
2.1 Pure hydrodynamics
We studied numerically the hydrodynamical equations for a 2-dimensional single- or multi-component disk. Thus, we solved the continuity equation
| (1) |
and the momentum equations for gas and dust. The momentum equations read for gas
| (2) |
and for dust
| (3) |
The components are denoted by for the gaseous phase and by for the dust. are the surface densities and the velocities. is the pressure of the gas which is given in the 2d-case as force per unit length. denotes the potential of the self-gravitating disk. It is derived from the Poisson equation
| (4) |
An external potential is added by a stationary contribution related to the halo, the bulge and/or a stellar disk component. These external potentials are chosen to match – together with the potential of the disk – a given rotation curve.
The main difference between the gaseous and the dust component is that the dust is treated as a pressureless phase. Therefore, if gas and dust are in rotational equilibrium, there is a velocity difference between both components which might give rise to a non-negligible frictional force depending on the cross-section for the gas-dust interaction. This interaction is described by the source terms on the RHS of the hydrodynamical equations. Since we do not consider dust formation and destruction processes, the source terms in the continuity equation vanish. However, frictional terms show up in the equations of motion. The dust implementation will be described in the next paragraph in detail.
The set of hydrodynamical equations is closed by a polytropic equation of state
| (5) |
For the gaseous phase we set the polytropic exponent to . The constant is chosen to yield a given minimum Toomre parameter.
2.2 Treatment of the dust component
Gravitating mini-disks in galaxies differ from ”normal” galactic disks in which the cold component (gas) is coupled gravitationally to the dynamically hot component (stars). The main difference between galactic disks and mini-spirals is that the cold component (dust) in the mini-disks is not only coupled by gravity to the hotter component (gas), but also by a frictional force between both components.
In order to include this drag, we added a source term to the equations of motion following the general form suggested by Noh et al. (noh91 (1991))
| (6) | |||||
| (7) |
The second source term, Eq. (7) follows from the requirement of momentum conservation. The physics of the friction is enclosed in the frictional timescale . We implemented three different prescriptions of the frictional term in our models.
The simplest approach is to assume a time- and position-independent frictional timescale , i.e.
| (8) |
Though this is a very rough assumption, it allows for a direct comparison between the drag term and other dynamical quantities, e.g. the dynamical timescale given by the rotation period. More detailed approaches are based on a microscopic view of the frictional process, i.e. the momentum exchange between gas and dust particles by collisions and the equipartition of momentum within the gaseous phase. Two limiting situations are described in the following sections in more detail.
2.2.1 Collisional time scale (equal disk heights)
Because the size of typical dust particles is much smaller than the mean molecular free path of the ambient gas particles in galactic central regions, the velocities of gas molecules are uncorrelated with the velocity of the dust particle itself and, thus, the friction can be described as an “Epstein” drag (Goodman & Pindor goodman00 (2000)). The latter is derived from kinetic gas theory (Epstein epstein24 (1924)). Only for very large grains residing in very dense regions the Stokes’ formula for the friction has to be used (then the friction is given by a laminar viscous flow over the dust particle). Assuming ”Epstein” friction is acting Noh et al. (noh91 (1991)) discerned between the two limiting cases of different scale heights of the dust component: either similar disk heights of gaseous and dust disk or a much thinner dust disk.
In case of similar or equal disk heights it is a reasonable ansatz to use the time scale for energy and momentum exchange due to collisions between gas and dust particles as an estimate of
| (9) |
denotes the mass of a dust particle, the mass density of the gas and the thermal velocity of the gas. The collisional cross section can be estimated from the geometrical cross section, i.e. from the average radius of a dust particle
| (10) |
The collisional time scale is then given by
| (11) | |||||
is the full scale height of the gas, its spatial density is estimated by .
2.2.2 Dynamical timescale (thin dust disk)
The other limiting case corresponds to a dust disk which is substantially thinner than the gaseous disk. In that case the time scale should be of the order of the dynamical time scale given by the inverse circular frequency (Noh et al. noh91 (1991)), i.e.
| (12) |
The basic assumption is here that gas and dust establish very fast collisional equilibrium in the thin dust layer and that the gas momentum is then mixed vertically in a sound travelling time scale. When taking typical values we see from Eq. (11) that the collisional time scale is indeed much shorter than the dynamical timescale. E.g. the rotation period in the inner regions of galaxies is about yrs. The sound propagation time can be estimated from ( is here the disk scale height of the gaseous phase). In dynamical equilibrium the scale height is related to the velocity dispersion by (see e.g. Binney & Tremaine binney87 (1987), hereafter BT87) which yields
The second relation is derived from the Toomre stability criterion. The last relation between the circular frequency and the epicyclic frequency holds for all reasonable rotation curves within a factor of 2. Hence, in the limit of a thin dust disk the friction time scale is dominated by the sound propagation time which is of the order of the dynamical time.
2.3 Numerical implementation
The nonlinear analysis implies the solution of the full set of hydrodynamical equations. For this purpose, we developed a two-dimensional numerical code which is similar to the ZEUS-2D code by Stone & Norman (stone92 (1992)). The hydrodynamical equations are discretized on a Eulerian grid in polar coordinates. The different terms are treated by operator splitting. Advection is performed by a second order Van Leer advection scheme.
In radial direction we use a logarithmic grid which allows a very high resolution in the central region. Therefore, a radial resolution of 128 cells should be sufficient for two-armed spirals as Englmaier & Shlosman (englmaier00 (2000)) demonstrated. In azimuthal direction, however, 128 grid cells can be critical, because the maximum growth rate might be found for high values of the azimuthal wavenumber. In case of protoplanetary disks Noh et al. (noh91 (1991)) found to be the most unstable modes. In order to accommodate such high modes, we used mainly a grid size of 270270 cells111For our simulations on the NEC-SX5 of the Kiel computing center we used a 270270 grid which has a similar physical resolution as the ”normal” 256256 grid, but a much better computational performance of the vector-optimized FFT routine supplied with NEC’s MATHKAISAN library. The increase of performance is caused by avoiding bank conflicts in the memory access on the NEC-SX5.. The physical sizes of the cells are similar in azimuthal and radial directions at all distances. The typical radial extent of the whole grid covers radial ranges from a few 10 pc to a few kpc. The Poisson equation is solved by applying the two-dimensional Fourier convolution theorem in polar coordinates (BT87). The hydrodynamical timestep is calculated by a combination of the standard Courant-Friedrichs-Levy criterion and the timescale is derived from the frictional force.
2.4 Units
For our simulations we set the gravitational constant to unity and we chose the length unit to 1 kpc and the mass unit to . The system time is then measured in yrs, the velocity in 65.6 km s-1, the circular speed in 65.6 km s-1 kpc-1 and the surface density in . If not stated explicitly, all quantities are given in these units.
2.5 Initial models
For most of our simulations the mass distribution of the disk is described by a weakly perturbed exponential profile. The perturbation is created by multiplying the surface density with a factor . is a random number in the interval [-1,1] and the amplitude is typically selected to yield a global Fourier amplitude of the order (cf. also Eq. (18)).
The initial velocities are derived from rotational equilibrium, i.e. there is no initial radial motion. The rotation curve is specified by
| (13) |
The radius defines the transition between the central rigid rotation and an outer flat rotation curve. The sharpness of the transition is controlled by . The azimuthal velocity of the gaseous phase is calculated by the (frictionless) Jeans’ equation for the radial velocity component which reads in cylindrical coordinates
| (14) |
In case of the initial equilibrium, the radial velocity vanishes and, hence, the azimuthal velocity is given by
| (15) |
where we used that the rotation curve is derived from the gravitational potential, i.e. , and the pressure contribution to the rotation curve is abbreviated as
| (16) |
In case of the pressureless dust component its initial azimuthal speed is directly given by the rotation curve (13).
From the mass and potential distribution (or the rotation curve), the radial shape of the profile of the Toomre parameter
| (17) |
can be derived except for a constant factor. This factor can be specified by requiring a minimum value for the Toomre parameter.
2.6 Fourier Modes
In order to quantify the (global) stability of the disk we use the global Fourier amplitudes of each component (cf. e.g. Laughlin et al. laughlin98 (1998))
| (18) |
is the mass of the disk for the component of interest in the specified radial interval . denotes the corresponding surface density. Global Fourier amplitudes are calculated by integrating over the whole disk.
Additionally, a mode is introduced which quantifies the radial mass redistribution with respect to the initial one:
| (19) |
and are the azimuthally averaged surface densities at time and at the begin of the simulations, respectively. As long as the evolution is well described by linear perturbation theory, no substantial radial mass transport occurs. Thus, the increase of is a good indicator for the onset of non-linear effects during the growth of perturbations.
2.7 A single component model
In order to study the properties of a standard disk, but also to test the code for our application we performed a series of single-component (i.e. purely gaseous) simulations based on the mass distribution of a reference model. Its mass distribution is characterized by a submaximal exponential disk and a rotation curve which increases linearly in the center and is flat outside (for exact values see the next section).
In order to quantify the structural evolution we first discuss the global Fourier amplitudes (Fig. 1): they remain constant on their initial level of about during the first 100 Myrs (or ). Then the high-order modes start to grow exponentially reaching a saturation level of about . The fastest growing and dominant mode is the =8-mode. This is also seen in the image of the density perturbations (Fig. 2, upper row). The wavelengths of the perturbations are rather short as expected from the small critical wavelength pc. From linear theory the maximum growth is expected for a wavelength at about pc (see BT 87). Later than the high order modes, the amplitudes of the low-order modes, especially and , commence to increase with a time delay of 100 Myr. At the end of the simulation at (600 Myr) their saturation levels slightly exceed the saturation levels of the high order modes. The overall appearance is then dominated by a mainly lopsided and very irregular morphology (Fig. 2, lower row).
The radial mass distribution varies during the first 600 Myr only within the innermost 100 pc which is reflected also in the evolution of the =0-mode: After a fast readjustment of the radial mass profile according to the initial density perturbations, it remains constant until Myr. Then a radial mass transfer sets in, which stops at about Myr. Though the values of the perturbation amplitudes are rather small, this does not mean that the response of the disk is everywhere in the linear regime. The outer regions remain almost unevolved, whereas the inner regions undergo strong morphological changes. It is only the ”standard” normalization to the whole disk mass which keeps the global Fourier amplitudes rather small. In order to demonstrate this, Fig. 3 shows the temporal evolution of the spatially resolved Fourier amplitudes for =2 and =8. As seen already for the global modes, the high-order modes start to grow first. Additionally, the growth begins in the central area where the surface densities are at maximum and the dynamical timescales are short. Throughout the whole simulation the region of growing high-order modes is restricted to the central 250 pc. Only the =2-mode expands after Myr to distances up to 1 kpc, but still with amplitudes much smaller than in the center. In the nuclear region both, low- and high-order modes, reach a non-linear saturation level of about 5-20%.
From a technical point of view, the conservation of various quantities is quite well fulfilled. At the end of the simulation (after numerical steps) the mass is conserved within machine accuracy of double precision numbers (). Energy is conserved to better than and angular momentum better than (the numbers denote the relative deviations from their initial value). This simulation was performed without artificial viscosity.
3 Results
In this section we present the results for dusty disks. First, we discuss the properties of a reference model in Sect. 3.1. Afterwards the influence of various parameters is shown in Sect. 3.2.
3.1 The reference model
3.1.1 The start model
Our initial models are motivated by the nuclear region of M100 (NGC 4321). We adopted a total gas mass of M☉ distributed exponentially with a scale length of 300 pc within a radial range of pc to kpc. Thus, the central surface density of the gas is about . The small disk scale length mimicks a central concentration of (molecular) gas observed in many galaxies.
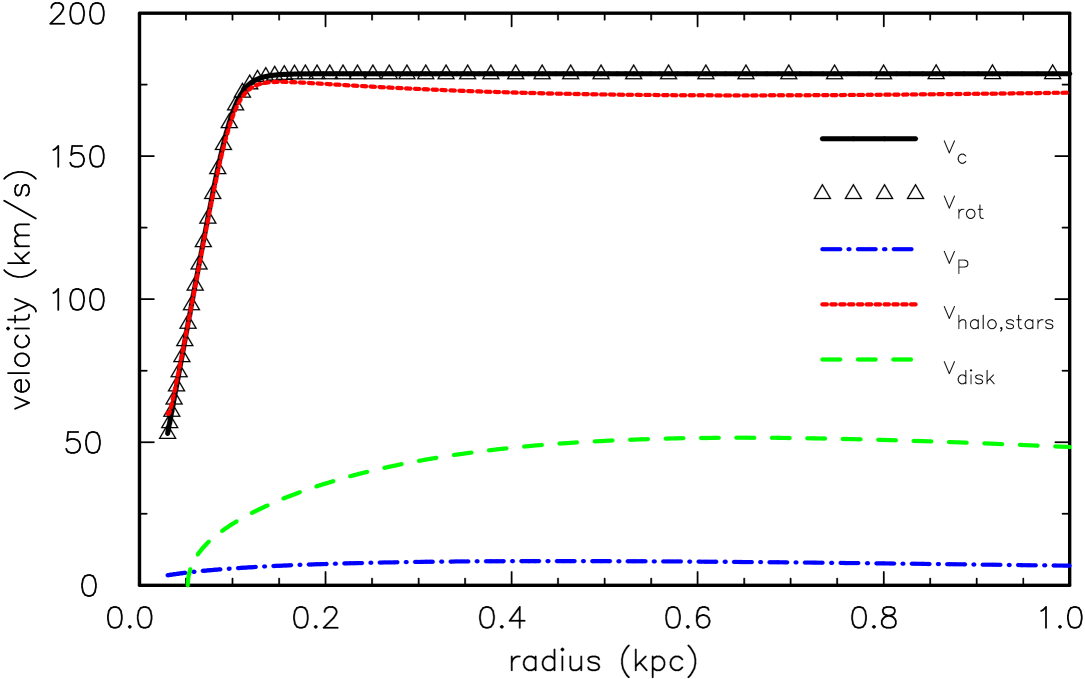
The rotation curve was selected as a combination of a central rigid rotation and an outer flat rotation curve according to Eq. (13). The velocity at infinity, , was set to 178 km s-1. The transition parameter was selected to be 10, by this resulting in a fairly sharp transition at the radius pc. This rotation curve corresponds to a total dynamical mass (including all components) of M☉ within the central 100 pc. In the region of rigid rotation the rotation period is about yrs. It increases outwards reaching yrs at the half-mass radius of the gaseous component at pc.
According to the chosen rotation curve, mass profile and equation of state (polytropic with ), the minimum value of the Toomre parameter is reached at a galactocentric distance of about 440 pc. The constant in the equation of state (for the gaseous phase) was selected to yield a minimum Toomre parameter of . This choice corresponds to sound speeds between 4 and 11 km s-1 within the central kpc (the higher value is reached in the center).
The different contributions to the azimuthal velocity of the gas as well as the rotation curve are shown in Fig. 4: The contribution of the pressure to the initial rotational equilibrium velocity is very small. It reaches a maximum of 8.5 km s-1 at a distance of 450 pc from the center. Compared to the azimuthal speed of the gas is negligible as the almost identical values of the azimuthal speed and the rotation curve demonstrate. The radial force attributed to the gravitational potential is dominated by the contribution of the dark halo plus stellar disk/bulge. The self-gravity of our live disk components (gas & dust) gives rise to a maximum rotation velocity of about 50 km s-1. This value still exceeds the pressure contribution by far, whereas it is small compared to the ”halo” contribution made out of stars and dark matter. Hence, the (gaseous) disk is submaximal by one order of magnitude.
Assuming that the central region is dominated by stars (i.e. the dark matter mass fraction is small there), the velocity dispersion of the stars must be a factor of 10 larger in order to form a Toomre-stable maximum disk (their Toomre parameter scales with ). Observations of the central stellar velocity dispersions report such large values of about km s-1 (e.g. Héraudeau & Simien heraudeau98 (1998)). Hence even a maximum stellar disk would be as Toomre-stable as the gaseous disk and more likely it would be dynamically hotter, i.e. more stable. On the other hand the scale height of such a stellar disk is fairly large. Estimating from yields for km s-1 and (the value of a maximum stellar disk at a galactocentric distance of about 500 pc) a scale height of pc. Hence, the stellar component is not flat at all within the central component. Together with the large Toomre parameter of the stellar component this justifies the treatment of the stellar ”disk” as a ”background” potential instead of a dynamically live component.
In our reference model we set the dust mass to 2% of the gas mass. This choice is close to the upper value reported for the average dust-to-gas ratio in galaxies. On the other hand, the central regions of galaxies are metal-enriched compared to the mean galactic values. Taking the observed relation between the dust-to-gas ratio and the metallicity into account (e.g. Issa et al. issa90 (1990)), it is reasonable to assume a larger in the central regions than on average.
Since we treat the dust as a pressureless component, the initial equilibrium azimuthal speed of the dust is equal to the circular speed , whereas the azimuthal velocity of the gas is slightly lower due to the pressure contribution to the radial forces. The velocity difference between both components, however, is only about 0.1-0.2 km s-1 within the central kpc.
Though the choice of our initial model was guided by observations of M100, it should be kept in mind that the following simulations are not meant to yield a model of M100222E.g. the weak bar is not included in our models., but to study a ”typical” central galactic region.
3.1.2 Evolution of the reference model
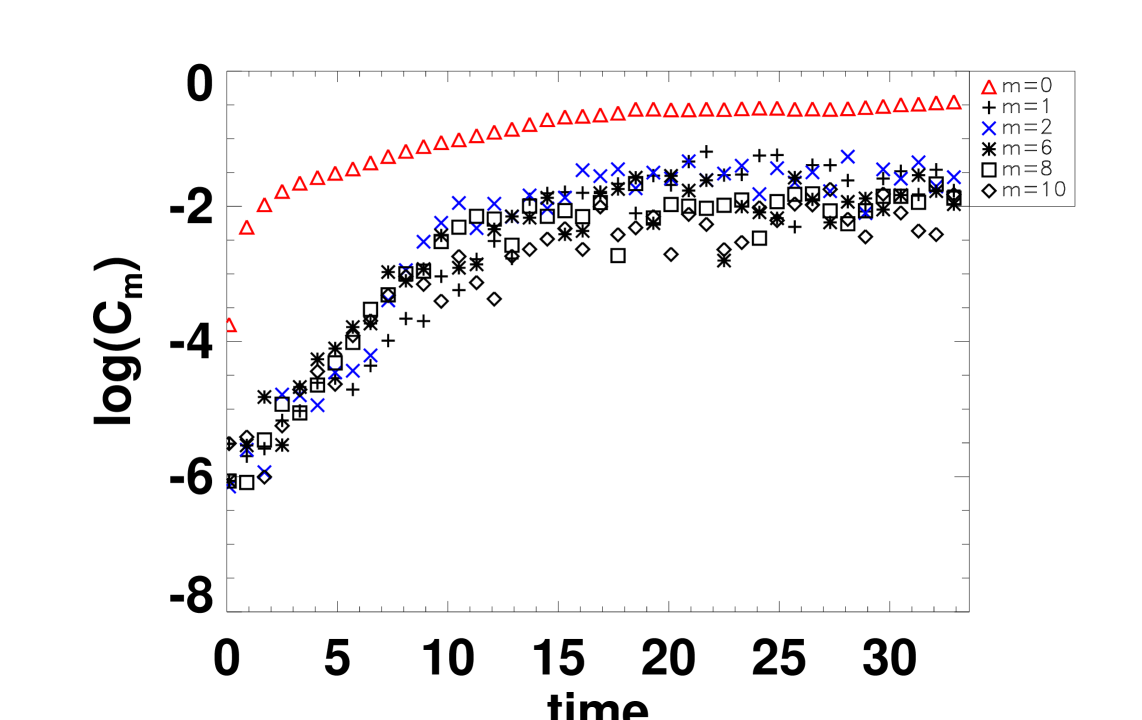
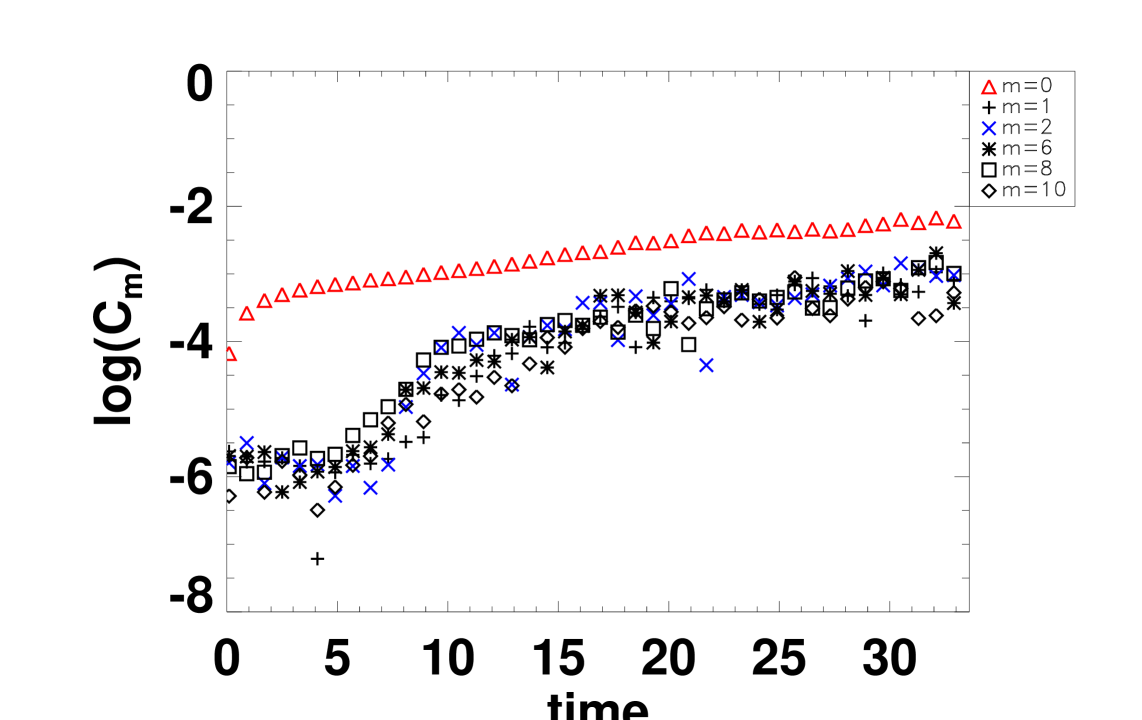
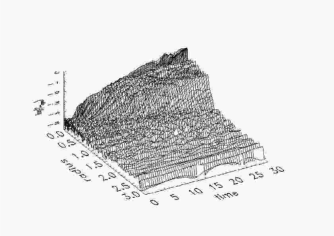
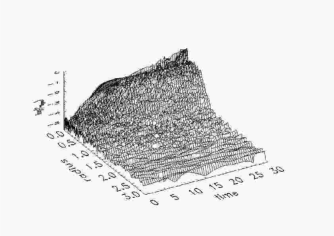
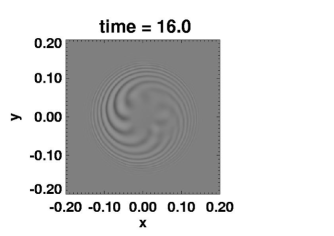
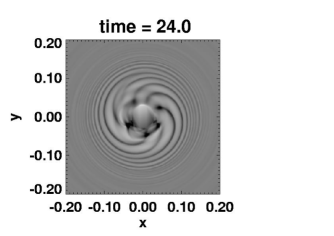
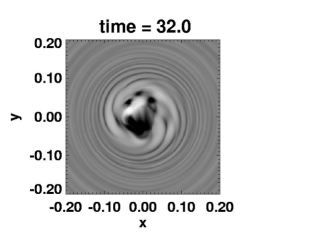
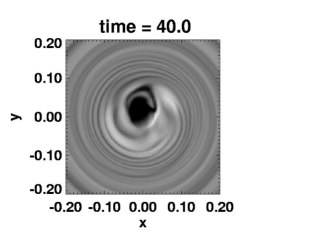
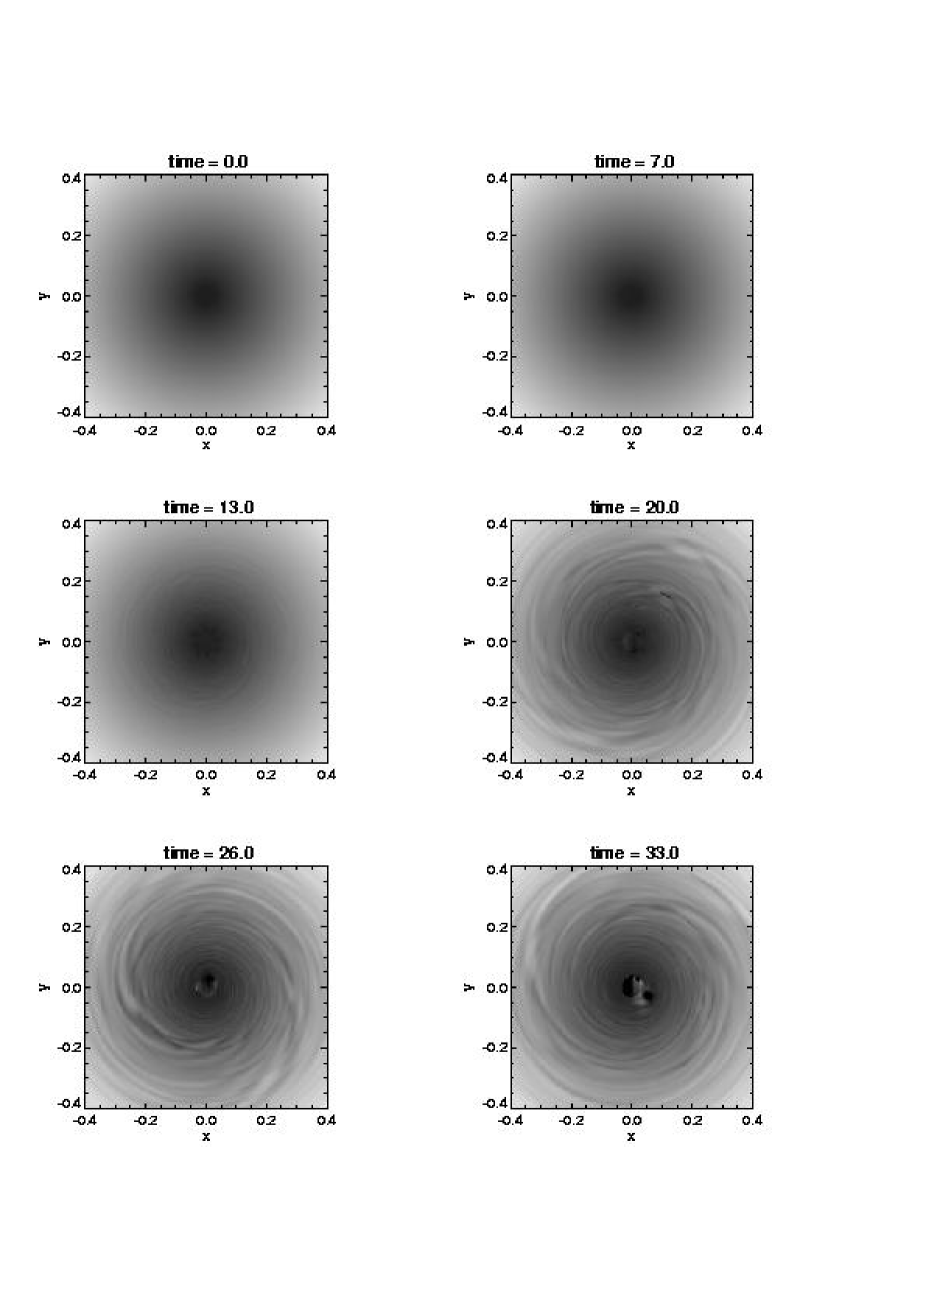
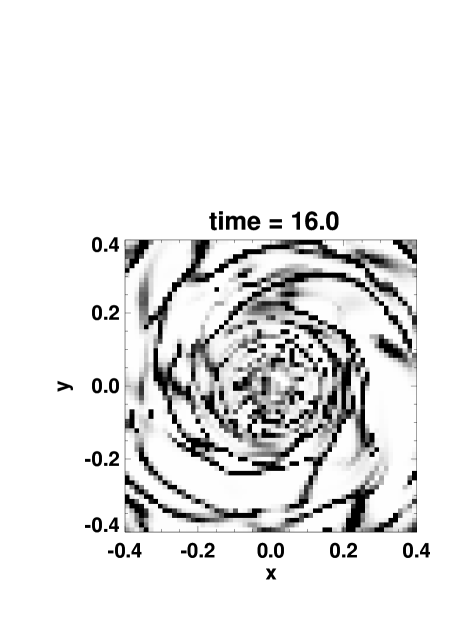
Fig. 5 shows images of the gaseous component at different times. During the first 300 Myr ( Myr) only very weak features are discernible in the gas phase. Lateron, a multi-armed and very patchy structure is formed which is basically concentrated to the central 400 pc. After 390 Myr a small region close to the center becomes highly unstable. Since we did not include any processes like star formation or stellar feedback the growth of this clump is not stopped. As a result the timestep in our simulations decreased to less than a year. At this value we stopped the numerical simulation. The formation of such clumps, however, is a generic behaviour of our simulations. When we varied the initial conditions by using different perturbations, clumps were still formed on a similar timescale ( Myr).
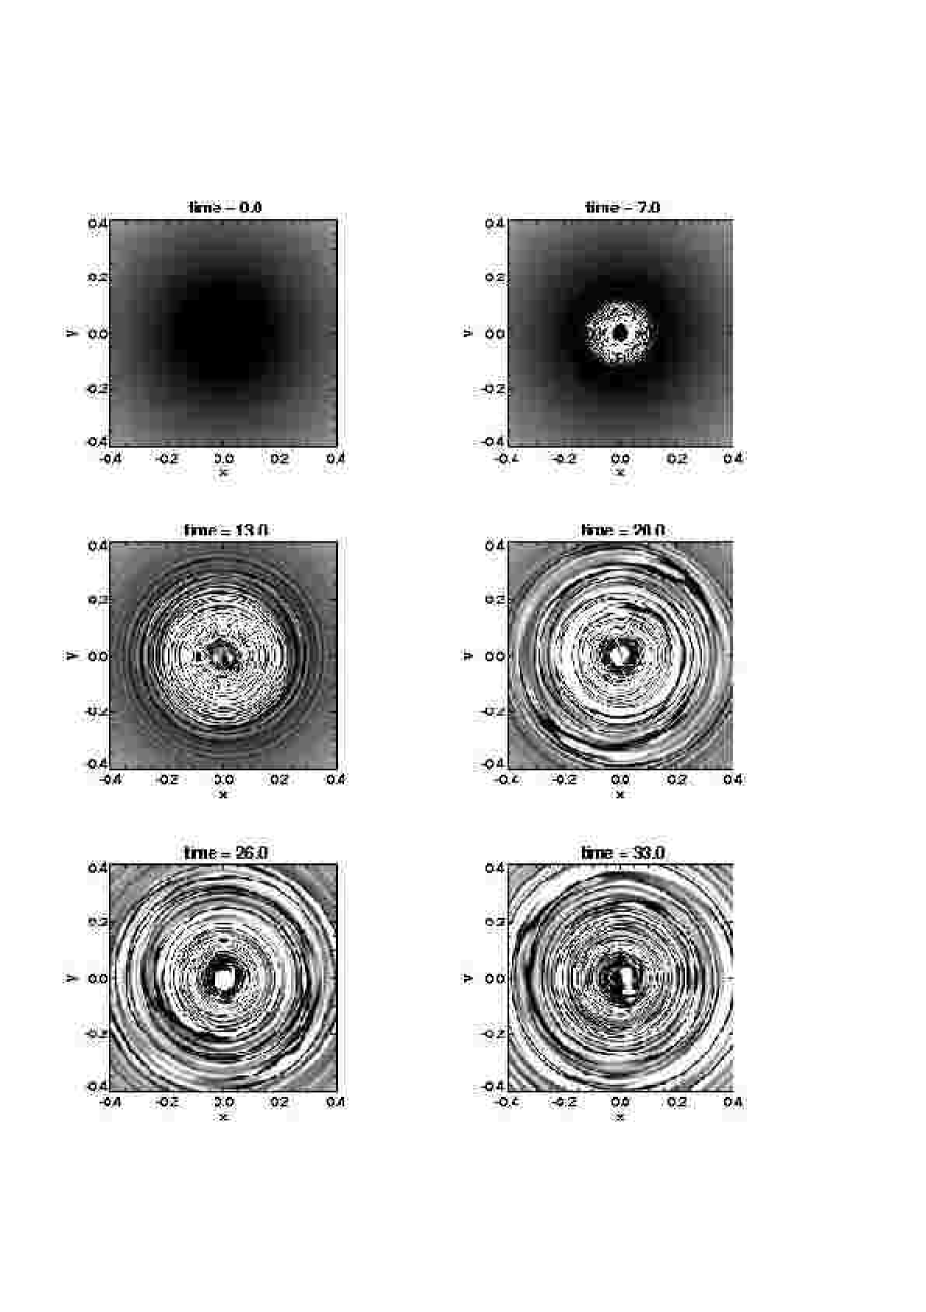
In comparison to the gas, the dust becomes unstable at an earlier time (Fig. 6): already after 100 Myr () structures are visible in the central 100 pc. These structures are characterized by a large contrast, i.e. thin, but (relatively) dense regions, separated by broad areas devoid of almost any dust. The positions of the dust peaks are strongly correlated with those of the gas, but sometimes with a small offset in the positions. The absolute values of those peaks are not well correlated with the corresponding peak values of the gas density. This leads to a large scatter in the gas-to-dust mass ratios. Morphologically, the dust seems sometimes to be organized in rings instead of large-scale spirals like the gas. Some of these rings are linked by dust lanes or small arcs.
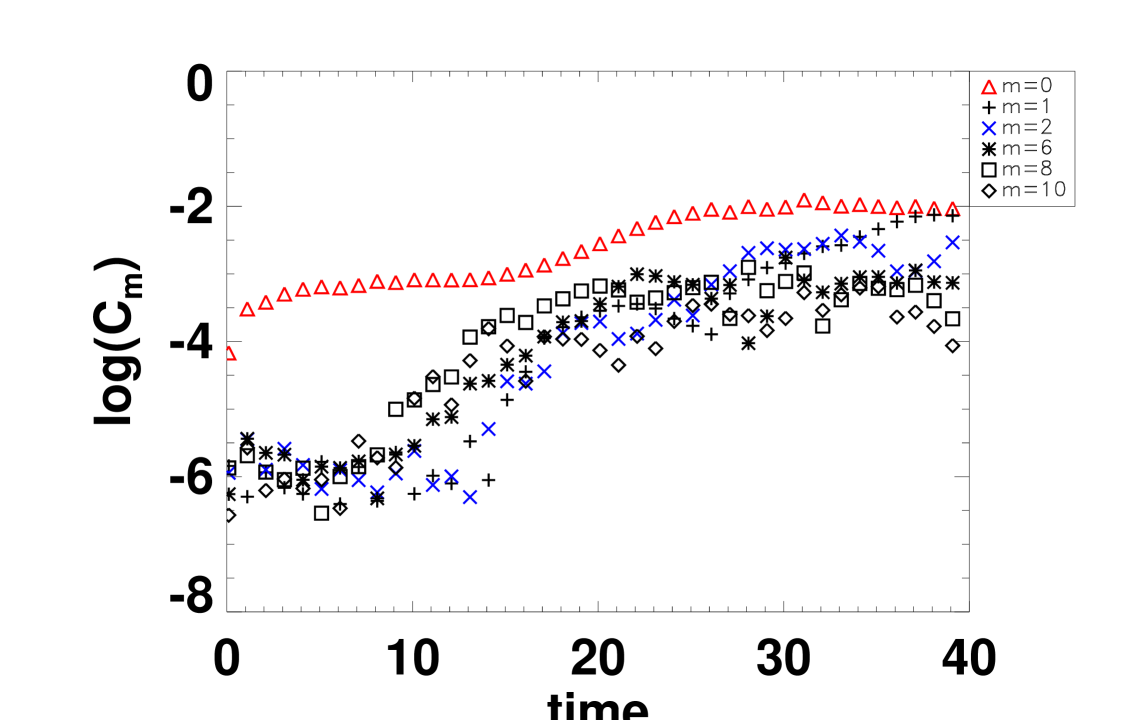
A more quantitative description of the structure formation is given by the Fourier amplitudes. The dust component shows a fast exponential growth of all components with a slight dominance of the high- modes (Fig. 7). Different to the single-component model discussed in Sect. 2.7 the dust modes begin to grow immediately at . Their growth rates are a factor of 2 larger than those found in the single-component model. Additionally, the evolution is accompanied by a strong radial mass redistribution of the dust. After 150 Myr a saturation level of about is reached.
Though the dust has only 2% of the mass of the gas, it destabilizes the gaseous disk strongly (Fig. 8). When dust is present, the modes of the gaseous phase commence to increase already at about Myr. In the single-component simulation the gaseous disk has been stable until a time Myr (cf. Fig. 1). This difference becomes even more obvious when comparing the spatially resolved Fourier amplitudes of the simulations with and without dust (Figs. 3 and 9): the growing region is for both simulations restricted to the central area, but in the dusty model the growth sets in much earlier and with a larger growth rate.
Another difference to the single-component model concerns the dominant modes. Whereas for the purely gaseous model the high- modes are dominant, all modes grow more or less at the same rate in the reference model. The superposition of all these modes with nearly equal amplitudes results in the patchy structure visible in the spatial distribution of the components.
The growth of the Fourier amplitudes of the gas shows four stages (Fig. 8). In the first stage (until Myr), the gas is almost unaffected by the presence of dust and remains on its initial perturbation level. In the second stage (until Myr), the gas reacts on the grown instabilities in the dust, i.e. the formed very dense dust lanes, by becoming unstable, too. This phase of growth changes, when the dust reaches its saturation level. In the following third stage, the instabilities within the gas are still growing but on a longer timescale. The last stage is reached, when the gas phase saturates (which did not happen until the end of this simulation).
The direct influence of the frictional force is visible when considering the velocities. E.g. the residual azimuthal velocity, which is normalized to the initial azimuthally-averaged equilibrium rotation speed, shows a small but systematic deceleration of the dust component. Because the dust is treated as a pressureless phase, its rotation speed exceeds that of the gas. Therefore, the frictional force leads to a deceleration and, by this, to an azimuthal velocity which is 0.05 km s-1 smaller than the circular speed. The dust gets out of rotational equilibrium resulting in a steady dust inflow. This radial flow becomes larger with increasing coupling of the dust to the gas. Hence, the -Fourier amplitude (which characterizes the radial mass reconfiguration) varies stronger when increasing the coupling strength, while the higher Fourier amplitudes () are less affected.
The angular momentum removed from the dust is absorbed by the gas which is accelerated in azimuthal direction. Due to the large gas-to-dust ratio the acceleration is almost negligible and the radial structure of the gas is much less affected. The specific angular momentum of the dust component decreases by 6.6% during 450 Myr. The overall relative conservation of angular momentum is about , i.e. the simulation is as accurate as the single-component model. The total energy decreased by 0.8% due to the dissipative nature of the frictional force. Though this decrease is small, it exceeds by far the intrinsic energy uncertainty of found in the single-component simulation. Thus, the code is sufficiently accurate to deal with the implemented dissipation rates. Most of the energy dissipation takes place when the clumps are formed and the system becomes highly non-linear.
3.2 Parameter studies
In a small set of parameter studies we investigated different aspects of the dust’s influence on nuclear gaseous disks. First, we compared in more detail the different dust-gas coupling schemes (Sect. 3.2.1). Then we varied the gas-to-dust mass ratio (Sect. 3.2.2). In the sections 3.2.3 and 3.2.4 we investigate the influence of the Toomre parameter and the equation of state of the gaseous component. Finally, different minor aspects are summarized in Sect. 3.2.5.
3.2.1 Friction schemes
In a first series of simulations we compared the different coupling schemes Eqs. (8) and (12) applied to the reference model. Our simulations show that – independent of the scheme applied for the dust-gas coupling – the disks become more unstable when dust is present and the frictional timescale becomes not shorter than yrs.
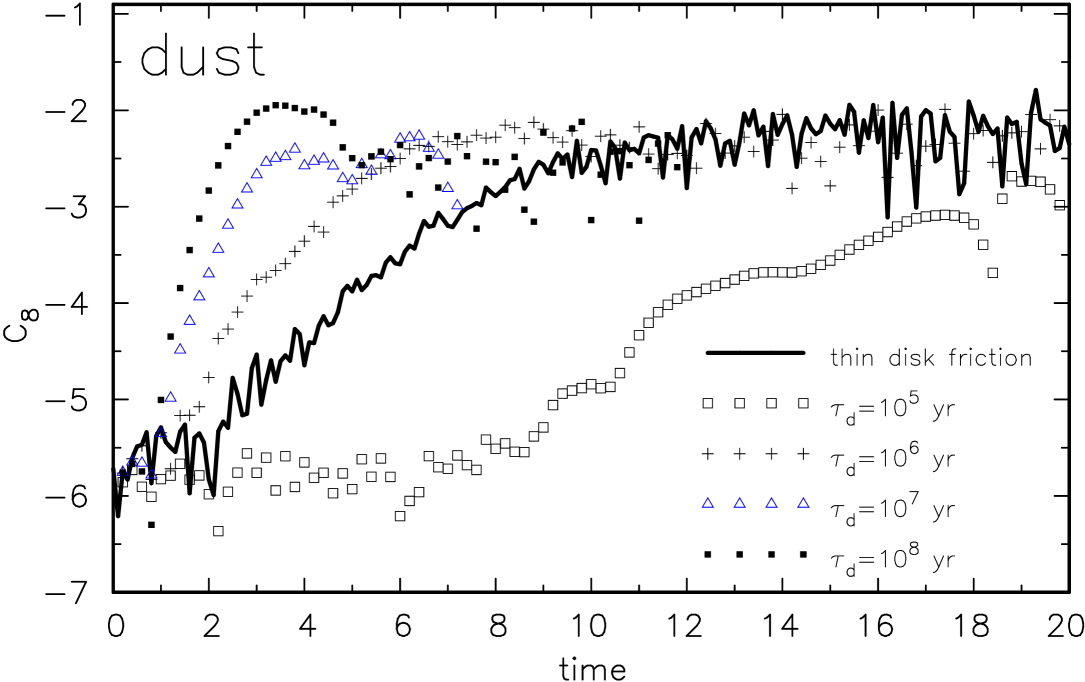
In case of a constant frictional timescale according to Eq. (8) we investigated four values of : , , and yrs. In case of yrs the frictional timescale is of the order of the rotational period at the outer boundary of the grid at 3 kpc. This timescale exceeds the rotation period at the half-mass radius by a factor of 5.9 and the rotation period at the inner edge by a factor of 28.6. The dominantly growing modes of the dust component are multi-armed modes near . The growth of the two-armed mode is delayed. The dust modes grow very fast: already after 50 Myrs () they reach their saturation level of about 1% (Fig. 10). A weak coupling between gas and dust, i.e. a large , results in an almost decoupled dust disk which is extremely unstable due to its lack of pressure support on small scales.
When is reduced by a factor of 100, the frictional timescale is shorter than the dynamical timescale and gas and dust are strongly coupled. In that case the growth of perturbations in the dust component is reduced, but still the dust evolves to saturation within the first years (Fig. 10). The thin disk friction of the reference model grows on an even longer timescale, corresponding to a frictional timescale between and yrs. The model with the shortest fixed friction timescale of yrs differs qualitatively from the other simulations: whereas the other calculations exhibit an immediate growth of modes, the -model remains stable for the first 120 Myr () before it also develops instabilities. The coupling to the dynamically warm gas becomes so strong that the growth of instabilities in the dust component is efficiently suppressed. Independent of these differences, the final saturation levels for all friction strengths are quite similar of the order of 1%.
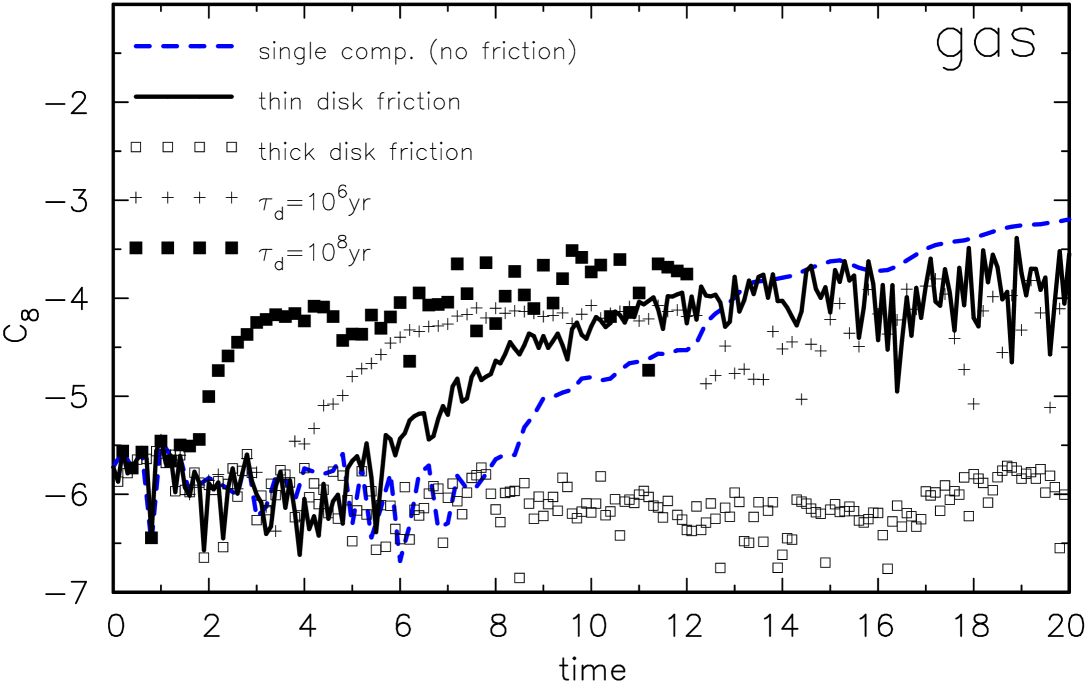
In Fig. 11 the growth of the dominant -modes of the gaseous phase are shown for different coupling strengths. Similar to the dust component, the evolution of the gaseous phase strongly depends on the frictional timescale. In comparison to the single-component model, friction strongly destabilizes the gaseous component, though its mass is a factor of 50 larger than that of the dust. Also for the two more realistic treatments of the dust friction, the thin and the thick disk limits, the evolution of the gas phase deviates significantly from that of the single-component model. In the thin disk limit, the gas starts to form structures 25% earlier than in the single-component model. If the frictional timescale becomes even much shorter like in the ”thick disk” limit, the gaseous disk is even stabilized by the dust (only after Myrs, the disk starts slowly to develop growing modes). In that case, the friction acts like a very high viscosity which slows down any growth of instabilities.
The more physical approaches for the dust treatment are characterized by frictional timescales depending on the local gas and dust properties. In case of a thin dust disk, the frictional timescale is given by Eq. (12), i.e. the dynamical timescale. If we compare this ansatz with the simple approach of a constant frictional timescale, we find that the thin-disk scheme is very similar to a short frictional timescale between and yrs (Fig. 10), whereas the treatment according to Eq. (9) gives an even shorter timescale.
The coupling between the gas and dust component can be studied by comparing the evolution of the global modes of both components. If one applies Eq. (9) the coupling between gas and dust is very strong and the modes have nearly identical temporal evolution. If the frictional timescale is given by the dynamical time according to Eq. (12) the coupling is less strong (see Figs. 10 and 11). The Fourier amplitudes of the dust exceed then those of the gas throughout the calculation. Especially in the phase of strongest growth, the dust is clearly ahead of the gas. This indicates that the instability of the gaseous disk is enhanced by the dust.
3.2.2 Gas-to-dust ratio
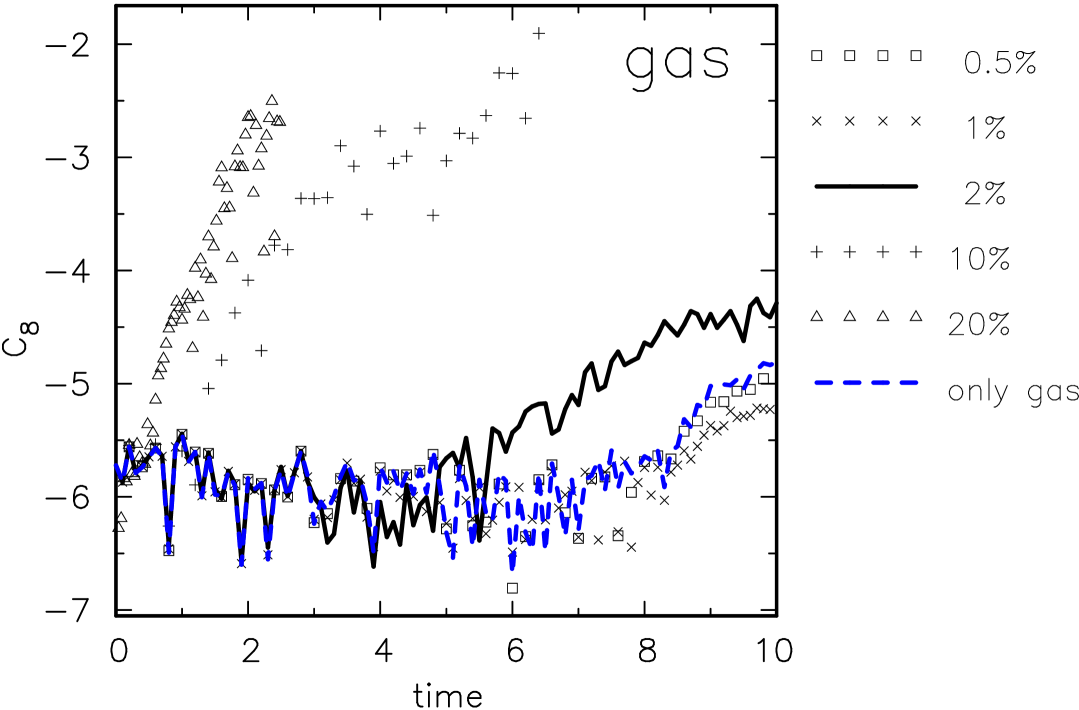

As a next step we varied the dust-to-gas mass ratio from 0.5% to 20%. For all these models the -mode is dominant. A comparison of the corresponding Fourier amplitudes with those of the purely gaseous model of Sect. 2.7 shows that the critical dust-to-gas ratio for dust becoming dynamically unimportant is about 1% (Fig. 12). For larger amounts of dust the destabilization of the gaseous phase becomes much stronger. For the reference model’s value of the instability sets in 50 Myrs earlier than in dustless or low-dust models while the modes remain on their initial value for a latency period of 75 Myrs. Increasing to 10% reduces the latency time to almost zero. The growth rates increase by a factor of 3-4 and the saturation level reached already after 30 Myrs is larger by at least one order of magnitude.
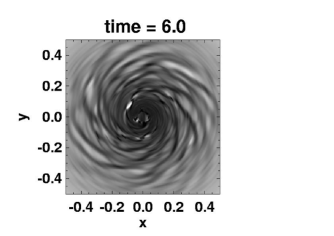
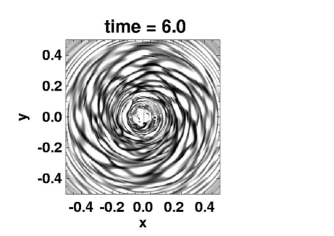
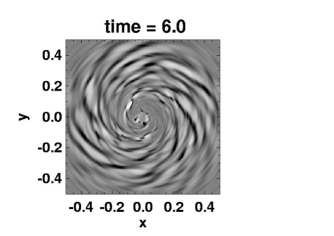
Fig. 13 shows the gas and dust distribution of a model with a large dust-to-gas ratio of 10% in its saturation stage. The weak structures visible in the reference model become more pronounced as a comparison of the gas distributions shows (cf. also last images in Figs. 5 and 6): the patchy multi-armed structure is more emphasized due to larger arm-interarm variations. Along the arms strong surface density variations exist. Some arms are interrupted by low density areas. Many spirals are not smoothly curved, but they show wiggles. Some arms seem to merge with others. The dust distribution is highly correlated with the gas distribution. However, the contrast between arm and interarm regions is larger for the dust than for the gas. The surface densities of the dust vary by about one order of magnitude, whereas the contrast of the gas component is usually less than a factor of 2. (Fig. 14). The variations of the dust component along the arms are smaller than those of the gas. The structures formed in the dust are also thinner than those of the gas. Though there is a tight correlation between the positions of the maxima of the gas and dust phases, there is no correlation between their maximum amplitudes. The dust distribution is characterized by a more cellular appearance compared to the spiral-like morphology of the gas. Inspecting the density perturbations stresses this point (see lower diagrams in Fig. 13).
Another interesting aspect is that the dust is often located at the boundaries around peaks of the gas distribution, preferentially at the inner boundary. Examples are the dust peaks at , 155 and 210 pc in Fig. 14. Other dust peaks are in regions with no or only weak gaseous density enhancements like those at and 170 pc. And, of course, there are dust peaks at the same locations as those of the gas, e.g. at and 190 pc. From that variety of locations it is clear that there is no simple straightforward correlation between the gas and dust mass distribution. Accordingly, one expects large spatial variations of the dust-to-gas ratio.
3.2.3 Toomre parameter
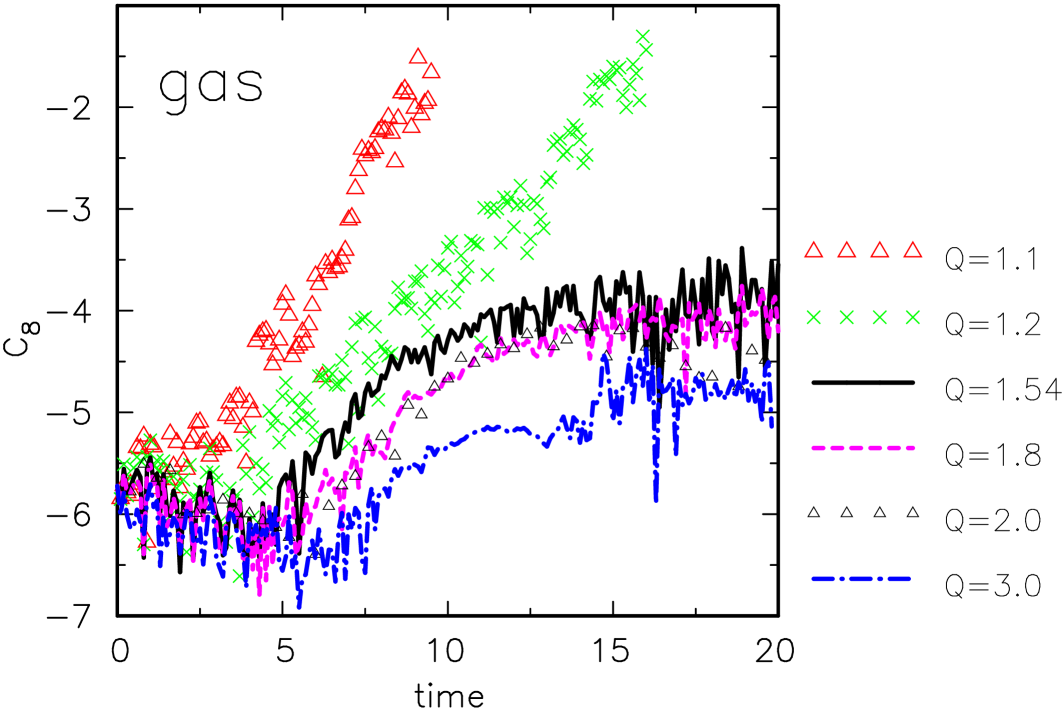
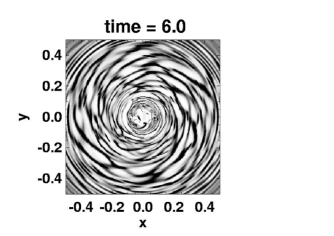
The Toomre parameter usually turns out to be a key indicator for the stability of disks. Therefore, we performed a series of simulations in which we studied dynamically cold, warm and hot disks, i.e. we varied from 1.1 to 3.0. The dust-to-gas ratio was set to the value of 2% identical to the reference model. As expected from single-component simulations has a strong impact on the structure formation of the gaseous phase (Fig. 15). Dynamically cold disks ( close to unity) are highly unstable, whereas hotter disks become more and more stable. The saturation levels are much larger in case of cold disks (for which the non-linear regime is quickly entered). On the other hand, even for large dusty gaseous disks are more unstable than single-component disks of the same stressing the destabilizing influence of the dust.
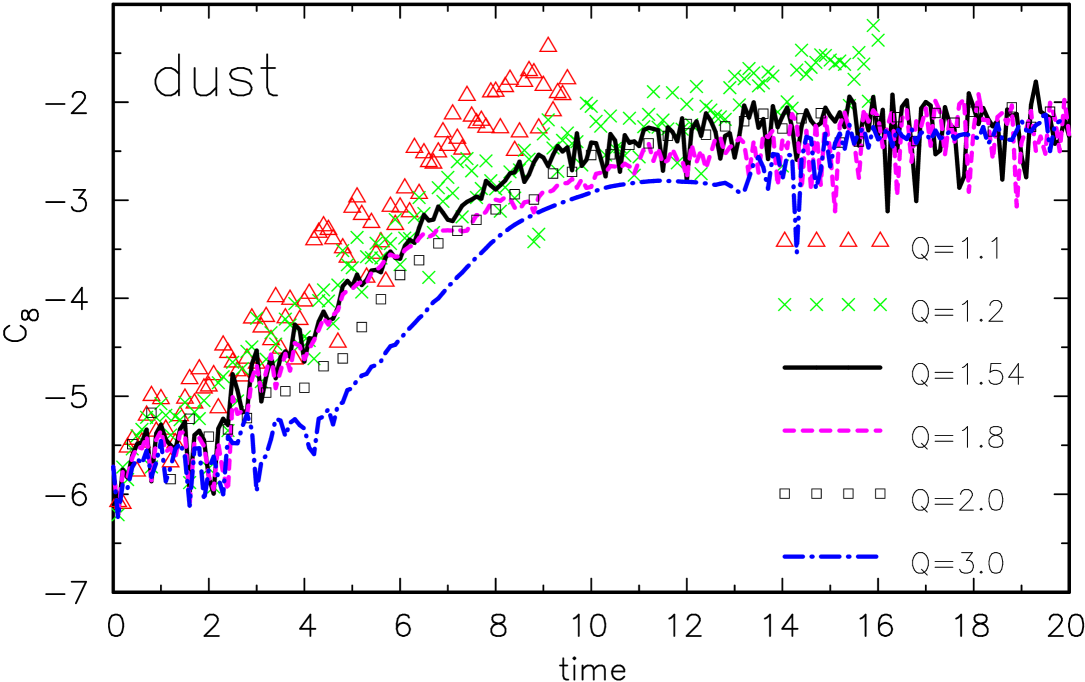
Qualitatively, this can be explained by the evolution of the dust component whose growth rates are almost independent of the varied values (Fig. 16). This is a consequence of the pressureless evolution of the dust which leaves the dust disk almost unaffected by the gaseous phase. There is just a small trend of the dust to become later unstable with increasing . Additionally, the loss rate of specific angular momentum of the dust component by transfer to the gas varies by a factor of 7.3 when is increased from 1.1 to 3.0. Both is caused by the larger pressure contribution to the rotational equilibrium of the gaseous phase in case of dynamically hotter systems. By this, the gas rotates more slowly, if is large, and the velocity difference between gas and dust becomes larger, too. For small pressure contributions to the azimuthal speed of the gas, the velocity difference between gas and dust scales like ( is the constant in the equation of state Eq. (5)). As a result the frictional force is also enhanced and the onset of instability of the dust component is slightly delayed.
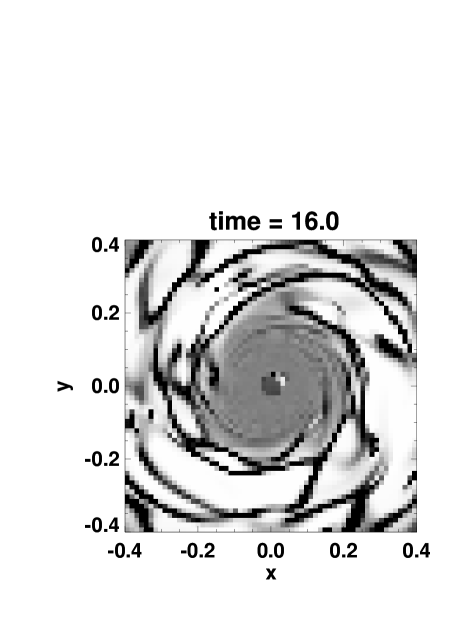
It is interesting to compare the spatial matter distribution of dust and gas in more detail. The simulation starting with a cold disk of develops quickly a patchy multi-armed structure in the gaseous phase. At the end of the simulation, when the dust reached already the saturation stage and the gas is in the non-linear regime of the growth of instabilities, the gaseous pattern is dominated by a multi-armed, irregular morphology outside 200 pc and a fairly regular, mildly changed distribution in the central part (Fig. 17, left). In contrast to the gas, the dust is also rather irregularly distributed in the circumnuclear region (Fig. 17, right). Outside this nuclear region, but still within the central 200-400 pc prominent multi-armed spirals are visible. In that region the dust component is strongly correlated with the gaseous phase. Moreover, in agreement with the reference model the structures in the dust are more pronounced than those seen in the gaseous phase. The difference in the locations of unstable regions between both components becomes more pronounced at earlier stages of the evolution, when the gas forms structures around a galactocentric distance of 400 pc, whereas the dust becomes mainly unstable inside the central 100 pc.
Both can be explained in terms of the local Toomre parameter of the components: takes its minimum value of 1.2 at pc growing to values of 1.5 at 200 pc. Therefore, the gas becomes preferentially unstable in a broad ring at about 400 pc. On the other hand, there is no pressure support at all for the dust component. Hence, on small scales the dust is only prevented from collapse by the friction with the gas (and, by this, partly due to the gas pressure). On large scales, the dust (and the gas) can be stabilized by differential rotation. However, in the region of rigid rotation exists no differential rotation and, therefore, the dust can form quickly fragments or rings.
3.2.4 Equation of state (gas component)
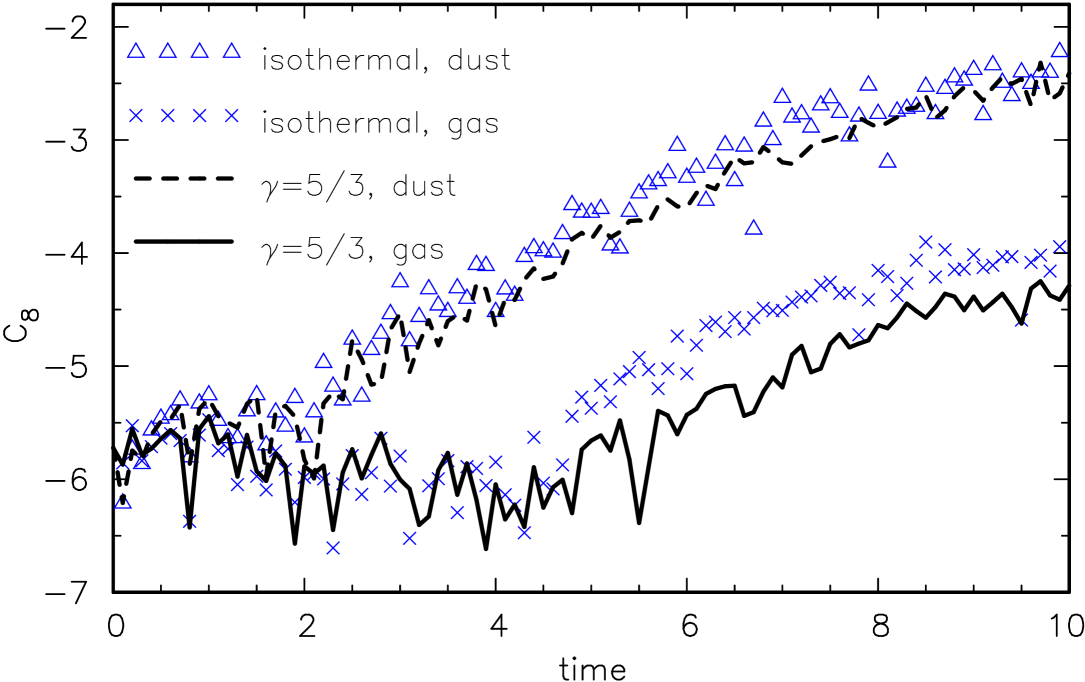
In order to investigate the influence of the equation of state of the gaseous phase, we performed a simulation with an isothermal equation of state () instead of . The other parameters were kept identical to the reference model. Both simulations give nearly the same results as the growth rates of the dominant global amplitudes demonstrate (Fig. 18). Thus, the behaviour of the dusty disks does not strongly depend on the adopted equation of state, provided the minimum Toomre parameters are the same.
3.2.5 Miscellaneous
The influence of several ”technical” parameters was studied by comparing the evolution of the dominant mode with that of a reference model.
Grid boundaries. As a first test we investigated the influence of the radial extent of the grid by varying the inner and outer radial boundary by a factor of 0.5 and 2, respectively. The growth rates, however, remained basically unaffected by the variation of the boundaries.
Grid resolution. In order to test the influence of the grid resolution, we performed a simulation with 686686 grid cells. Both simulations show only minor differences, e.g. the evolution of the dominant mode is rather similar in both cases for dust and gas: the instabilities set in at about the same time, the growth rates differ slightly, i.e. they are marginally larger in the high-resolution model. The saturation levels, however, are identical. Therefore, we conclude that our results are independent of the grid resolution.
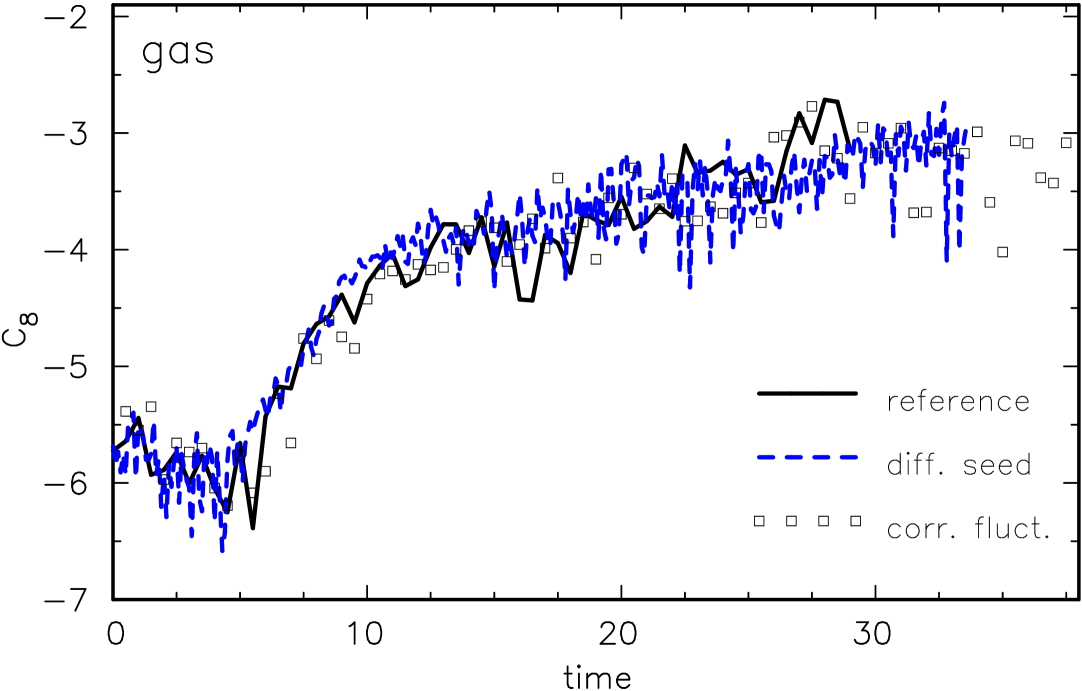
Different seeds. The influence of the initial setup of perturbations was tested in two ways: First, a different set of random numbers was used to determine the initial fluctuations. In a second simulation the initial perturbations of dust and gas were correlated by taking locally identical relative perturbations, i.e. an overdensity of gas corresponds to the same overdensity in dust (in the standard setup the perturbations were uncorrelated). The global Fourier amplitudes were kept constant at a value of . The dominant Fourier modes evolve very similar in all these simulations (Fig. 19). The main difference is the end of the simulations, which was chosen to be the time when the numerical timestep drops below 1 yr. In all simulations this was initiated by the formation of a small scale gravitationally unstable clump. In all three simulations this happened at a time Myr or later. Therefore, we conclude that the formation of the main structures is rather insensitive to the detailed setup of initial perturbations.
Artificial viscosity. The use of artificial viscosity is a standard tool in hydrodynamics in order to cope with shocks. Principally, shocks are expected in the late stage of the evolution, especially during the non-linear or the saturation stage. On the other hand, artificial viscosity is formulated qualitatively similar to the terms describing friction, i.e. it couples to velocity differences. Therefore, we did not apply artificial viscosity to the models shown so far in order to avoid a spurious mixing of effects induced by friction and artificial viscosity.
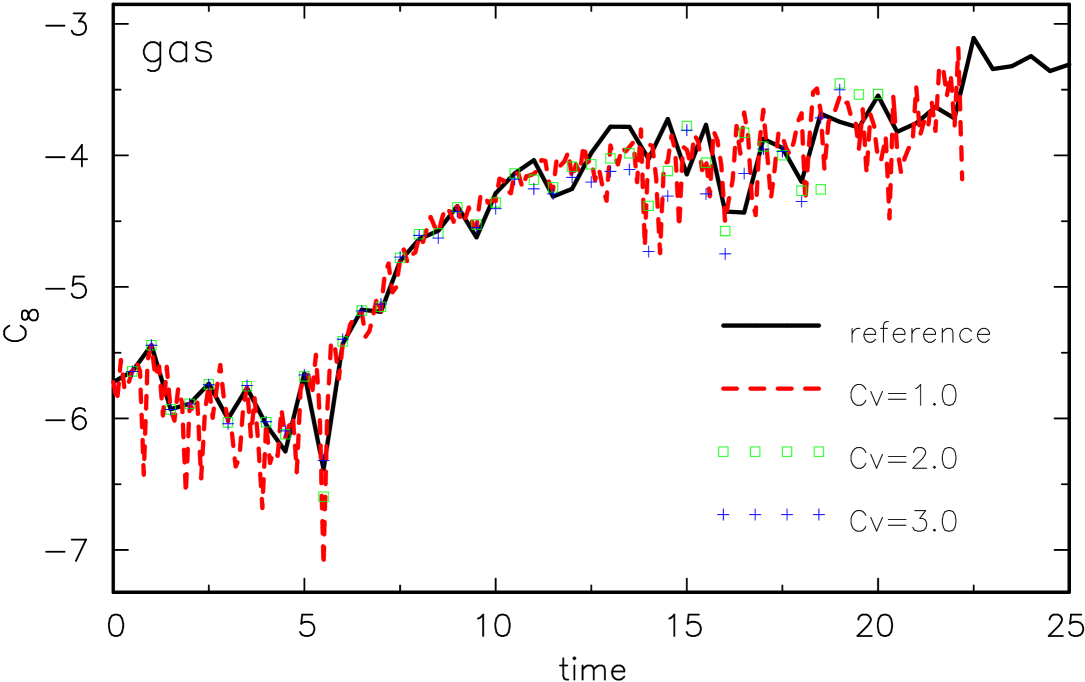
However, we wanted to test the possible impact of (artifical) viscosity on our results. Therefore, we implemented the von Neumann-Richtmyer artificial viscosity described in Stone & Norman (stone92 (1992)) and modified the determination of the timestep in our code accordingly. The free constant (called in Stone & Norman) describes roughly the number of cells over which a shock is smeared out. was varied from 1 to 3. The evolution of the global modes was basically unaffected by the application of artificial viscosity as the similar Fourier amplitudes in Fig. 20 demonstrate. Hence, shocks seem to be less important for the structures formed in our simulations. This, however, might change when strongly barred nuclei are investigated as the simulations by Athanassoula (athanassoula92 (1992)) have revealed.
Transition to flat rotation. In the reference model the region which became unstable first was given by the transition from rigid rotation to the flat part of the rotation curve, i.e. at a distance of pc (cf. also time in Fig. 6). Within that region the circular frequency is constant which means that a perturbation always acts on the same neighbouring gas packets and differential rotation can not pull apart those gas elements, by this preventing gravitational instability. Contrary to that, in the flat part of the rotation curve differential rotation stabilizes additionally the disk.
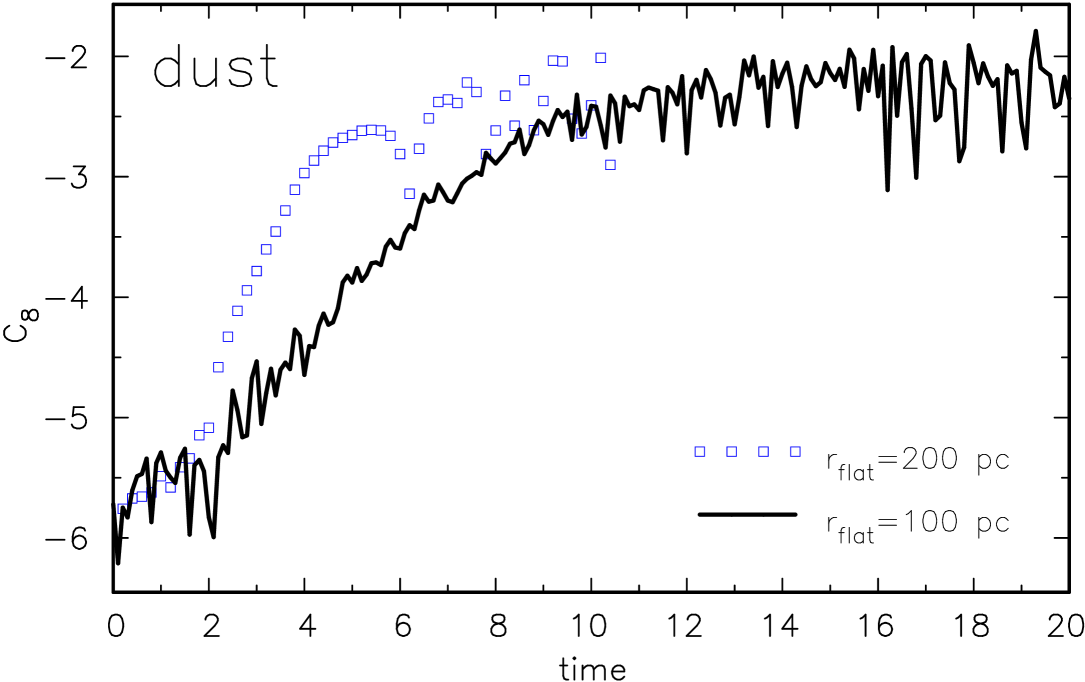
Fig. 21 compares the -modes for a rotation curve with a transition to the flat part at pc instead of 100 pc as in the reference model. In agreement with the simple considerations of the previous paragraph the dominant mode grows faster: after a short initial period the region of instability extends beyond 100 pc making a larger area unstable, by this enhancing the growth rate of the -mode. Compared to other modes the dominance of the high- modes is even more pronounced, because they affect a larger area and, thus, more mass. The saturation levels, however, are nearly identical in both simulation which can be understood as a consequence of the only small mass fraction () which resides in the area between 100 and 200 pc.
4 Discussion
4.1 Preliminary remarks
From previous works it is well known analytically as well as numerically that adding a cold component can destabilize galactic disks (e.g. Jog & Solomon jog84 (1984); Orlova et al. orlova02 (2002)). In our example the cold component is the dust phase, whereas the dynamically warm or hot component is the gas. A quick (but dirty) first estimate of the stability of the components can be done by inspecting the Toomre stability parameter, i.e. stability is provided if exceeds unity:
| (20) |
is here the velocity dispersion of the component of interest, e.g. the sound velocity in case of a gaseous phase. This criterion is exact only for axisymmetric perturbations in flat, single-component gaseous disks. Qualitatively, however, it holds for a large variety of systems, if the RHS is replaced by a slightly larger numerical value. E.g. in case of stars one has a value of (BT87) or for non-axisymmetric modes one gets in case of flat rotation curves (Polyachenko et al. polyachenko97 (1997)).
For a two component system the Toomre criterion gives only a good estimate of the stability in some limiting cases in which the dynamics of the components can be well separated, i.e. the meaning of the dynamically active mass or surface density and its stabilizing pressure or velocity dispersion are well defined. This situation holds for some of the systems under investigation here, e.g. they can be described as cold dust disks embedded in a dynamically warm or hot gaseous disk which is in rotational equilibrium. The Toomre parameter is then determined by the external rotation curve, the dust distribution and its velocity dispersion. Since the dust is assumed to be pressureless, i.e. the Toomre parameter vanishes. Thus, without other stabilizing processes the dust disk would become gravitationally unstable to all perturbations with short wavelengths333The same result can be derived from a more detailed stability analysis of two-component systems (Jog & Solomon jog84 (1984))..
In case of a weak coupling between gas and dust, the dust disk would evolve like a two-component disk. Especially the dust disk would become violently Jeans-unstable, provided the dust remains pressureless as assumed by Noh et al. (noh91 (1991)). The latter would be the case, if the increase of velocity dispersion of the dust phase can be compensated by dissipative processes like inelastic collisions of dust particles. As a result the dust might form dense regions, eventually dominated by dust. However, there is no evidence for the existence of such pure ”dust balls” which means that there is either a sufficiently strong coupling between dust and gas or there is no efficient dust ”cooling” (or both of them). In the case of protoplanetary disks Weidenschilling (weidenschilling80 (1980)) and Cuzzi et al. (cuzzi93 (1993)) stressed the importance of turbulence which limits the density in the dust layer, by this preventing the formation of dust-dominated regions. Similarly, small-scale turbulence in galactic disks might be an important (dynamical) heating mechanism, even in the absence of a drag force. On the other hand, in the limiting case of a very short frictional timescale the velocity of the dominant gaseous phase is simply imprinted on the dust component. The behaviour of the complete system is then again well described by that of a single component system characterized by the gas parameters.
The most interesting regime is that where the coupling between gas and dust is intermediate and the dominant gaseous component is dynamically not too hot, i.e. not all instabilities of the gaseous component are completely suppressed.
4.2 Is the dust component dynamically important?
The simulations have revealed that the dust component is dynamically important only, if the dust-to-gas mass ratio exceeds 1%. This value is close to values of reported for the interstellar dust surrounding the solar system. In-situ measurements of the gas-to-dust ratio performed with the satellites Ulysses and Galileo in the heliosphere give a value of (Frisch et al. frisch99 (1999)). If one corrects their sample (which was dominated by micron-sized grains) for smaller grains missed because of the interaction with the heliosphere increases by a factor of 2 to 2%, the value we used for our reference model.
On the other hand, there are several dust-to-gas determinations from interstellar absorption lines towards different directions (e.g. CMa) which show a large scatter of giving values down to only (Frisch et al. frisch99 (1999)). Though the exact numbers strongly depend on details of the analysis (e.g. the mass distribution of the grains, the gas column densities, the adopted stellar abundances), the high local variability seems to be characteristic for the dust distribution.
In external galaxies measurements of the dust-to-gas mass ratio are derived from IRAS observations. Young & Scoville (young91 (1991)) give a mean value of . They explain the large discrepancy to the Milky Way ( 1%) by the assumption that the bulk of dust might be cold ( K) radiating at wavelengths larger than 100 m, whereas IRAS is mainly sensitive for ”warmer” dust. Detailed determinations of the dust-to-gas mass ratio also suffer from difficult gas mass estimates. Especially, in the central regions where molecular hydrogen is often the dominant gas phase, the gaseous mass can only be inferred from CO measurements and a subsequent conversion to the H2 mass. Uncertainties in this conversion might easily accommodate a factor of two in the mass determinations.
Though there are only a few dust-to-gas mass determinations, there is a clear close-to-linear correlation of with the metallicity (e.g. Issa et al. issa90 (1990), Hirashita hirashita99 (1999)). In case of M51 the dust-to-gas ratio is about 2%, whereas for dwarf galaxies like the Magellanic Clouds is a factor of ten or more smaller. Edmunds & Eales (edmunds98 (1998)) estimated an upper total dust mass limit for spiral galaxies with a standard yield of to be 0.2% of the total baryonic mass fraction. Assuming a gas mass fraction of 10%, this gives an upper dust-to-gas ratio of about 2% averaged over the whole galaxy. In the central regions of galaxies, however, the effective yields are larger, e.g. Pagel (pagel87 (1987)) gives a value 4.5 times larger than in the disk, and the limits on are accordingly higher. Therefore, dust-to-gas mass ratios of 1% or slightly more seem not to be unusual high for normal spiral galaxies.
Due to all these uncertainties, however, it is difficult to give a reliable global value for the dust-to-gas mass ratio in galactic centers. Local measurements yield dust-to-gas ratios exceeding the critical 1% margin, whereas global ones favour smaller values. However, both estimates might suffer from systematic effects (and the differences of both are a hint for that). Therefore, it seems that dust-to-gas mass ratios of 1% or more for normal galaxies cannot be ruled out from current data. Especially in the strongly obscured metal-enriched nuclear regions the dust mass fractions might exceed the locally determined values.
It is also interesting to note that a strong place-to-place variation of the dust-to-gas ratio is found in our simulations. This is especially remarkable, because we started with an almost uniform dust-to-gas ratio (deviations of the order ). Hence, even without an inhomogeneous dust production, large spatial gas-to-dust variations are produced.

4.3 The friction instability
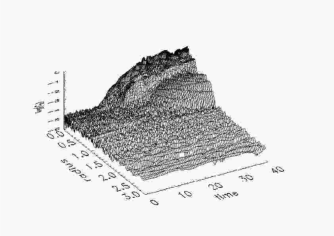
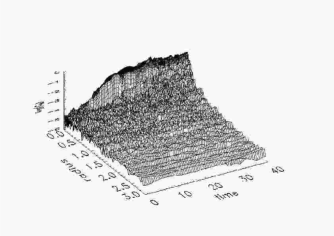
An interesting difference between the single-component model and the dusty disks is that the dust forms ring-like perturbations in the central area, whereas the gas develops initially only high- spiral modes (compare e.g. Figs. 2 and 6). Obviously, the dust introduces an additional axisymmetric instability as the evolution of the azimuthally averaged surface densities of the dust component show (Fig. 22).
An axisymmetric instability due to a drag force has been predicted by Goodman & Pindor (goodman00 (2000)). Their instability works without self-gravity, but needs the assumption that the drag force scales non-linearily (or more exact super-linear) with the surface density of the dust. Qualitatively, the mechanism works as follows (see also Goodman & Pindor goodman00 (2000)): due to the friction there is a steady, but slow inflow of dust. If the frictional force scales super-linear with , the friction becomes stronger in areas with enhanced by this increasing the coupling to the gas and reducing the radial inflow. As a result starts to grow exponentially.
As Goodman & Pindor (goodman00 (2000)) pointed out, the drag description of Noh et al. (noh91 (1991)) which we used here and which scales the frictional force strictly linear with the surface density does not allow for their instability mechanism. On the other hand, the self-gravity of the pressureless dust might play here a crucial role. The potential well of a ring-like perturbation acts like a super-linear frictional term which reduces the inflow velocity of the dust due to its gravity: dust flows from outer regions to the perturbed region, but cannot leave it inwards due to self-gravity. Additionally, the altered local gravity decreases the density gradient of the gas component. Therefore, the pressure gradient is reduced and the difference of the rotation speeds of gas and dust becomes smaller. As a result the frictional force and the loss of angular momentum decreases, by this stabilizing the formed ring. That the dust’s self-gravity is the driving agent is also supported by the fact that the rings form, when the spatially resolved Fourier amplitudes become non-linear.
4.4 Variation of dust treatment


As discussed at the beginning of this section, the implementation of a persistently pressureless component, subject to self-gravity but without coupling to another dynamically warm component results in a very unstable disk. In order to investigate the dependence of the coupled gas-dust system on the dust treatment, we performed two experiments, in which we modified the equation of motion of the dust by either describing the dust with a small, but non-vanishing pressure term and by neglecting the self-gravity of the dust.
These simulations demonstrate that the self-gravity of the dust is the main reason for the enhanced instability of dusty disks. In case of a disabled self-gravity of the dust, the dust ”feels” only the more slowly developing potential wells of the gaseous phase. The Fourier amplitudes start to grow with a substantial time delay, whereas they grow immediately in the reference model (Fig. 23). Once small perturbations in the gas phase begin to form, the pressureless dust follows them immediately as the similar evolution of amplitudes shows (Figs. 23 and 24). Due to the small mass fraction of the dust, the growth of the gaseous density perturbations is almost unaffected by the presence of a gravitation-free dust. In fact, the dust marginally delays the onset of growth of the gaseous perturbations due to the frictional force.
Different to the self-gravity of the dust component, the treatment as a pressureless phase is less important, provided the dust is still dynamically cold. The growth rates of the Fourier amplitudes are merely identical, if an adiabatic equation of state is used for the dust as a model with makes clear (Fig. 24). The saturation levels do not vary with the different treatments of the dust.
4.5 Dynamics of dust grains
For simplicity we investigated in this paper a dust component which is only coupled to the gas by a frictional force (and gravity). The collisional cross-section which enters the estimate of the frictional timescale in the thick disk limit (cf. Sect. 2.2.1 and Eq. (9)) is derived from the geometrical cross-section.
Generally, it is assumed that dust particles are charged, and the sign of the charge depends among other parameters on the grain size. Such a charge leads to an additional Coulomb drag term for the interaction with ions. In case of fractional ionization () this contribution is small compared to the collisional term, whereas it can become a substantial contribution in highly ionized areas (Draine draine03 (2003)). In the thick-disk limit for calculating the frictional timescale an additional Coulomb term yields a reduction of the frictional timescale, whereas in the thin-disk limit is unaffected, because the frictional timescale is anyway dominated by the longer dynamical timescale.
In addition to an enhanced Coulomb drag charged particles are also subject to a Lorentz force exerted by the interaction with the galactic magnetic field. For typical field strengths in the ISM of a few Draine (draine03 (2003)) estimated a cyclotron period of the order of yrs. From a comparison of with the collisional timescale of a few yrs (cf. Eq. (11)), we find that the momentum exchange due to friction exceeds the coupling to the magnetic field, provided we apply average ISM properties for estimating . On the other hand, in cool molecular clouds, the collisional timescale can be longer due to the reduced thermal velocities. Then the dust might be strongly coupled to the magnetic field.
In addition to drag processes and a Lorentz force, the dust is also influenced by radiation pressure due to the (usually anisotropic) interstellar radiation field. Additionally, dust dynamics is subject to recoil effects from photoelectric emission and photodesorption which can be of similar order as the radiation pressure. Draine (draine03 (2003)) estimated the drift velocities related to these radiation induced effects to be of the order of for a carbonaceous grain. Though this velocity is not very small compared to the relative velocities between gas and dust in our reference model (), we neglected radiation processes, because the related speeds are always small compared to the velocities reached during the growth of instabilities. Additionally, the determination of the interstellar radiation field would also require a consistent treatment of star formation and radiation transport in the ISM which is beyond the scope of this paper. The positional error resulting from the neglection of the drift velocities is only 4 pc within 100 Myr.
4.6 Miscellaneous aspects
4.6.1 Treatment of stellar component and dark matter
In our simulations stars and dark matter were treated as a rigid component taken into account by its contribution to the rotation curve. By this, an exchange of angular momentum between the dusty gaseous disks and the stellar component or the halo is neglected. Such a coupling can be very important, especially for the large-scale evolution of galactic disks (e.g. Klypin et al. klypin02 (2002)). On the other hand we focussed here mainly on the central kpc. In this region the mass of the dark matter is assumed to be small compared to the mass of the baryons (in case of normal galaxies). Thus, neglecting an interaction between the gaseous disk and a dynamically hot halo in the central area might be a less severe restriction. The situation is less clear for the stellar component. E.g. the perturbation exerted by a stellar bar will probably induce a strong -mode which might either dominate the appearance of the dusty disk or lead to a complicated mode-mode coupling between the dominant high--modes of the dusty/gaseous disk and the -bar mode.
4.6.2 Formation and destruction of dust
In this work we did not consider dust formation and destruction processes. One reason was that we wanted to focus on the dynamical impact of the dust component on the stability of the gaseous disk and, thus, we wanted to isolate the influence as direct as possible. A second reason was that there is still no completely satisfying model for dust formation, though many aspects have been uncovered so far. From stellar outflows it is known that dust formation is strongly related to star formation; other observations suggest that dust is formed in evolved stars or in supernovae events (e.g. Draine draine03 (2003)). Similarly, the growth and destruction of dust shows a large variety of processes which are important for the evolution of the dust population. Therefore, the implementation of a detailed evolutionary model for the dust component seems to be out of reach at the moment. On the other hand, a simplified treatment of dust formation and destruction might be possible on the basis of a live stellar component which includes a simple description of star formation and stellar evolution.
Due to the complexity of the processes governing the formation and destruction of dust, only rough estimates on the related timescales are possible. If we assume that dust formation is mainly driven by stars (or supernovae), then the star formation timescale provides a lower limit for the dust formation timescale . For normal spiral galaxies the star formation rate is typically of the order of one or a few yielding a timescale of the order of (several) yrs. A similar lifetime was invoked by Draine & Salpeter (draine79 (1979)) in order to explain the large fraction of Si bound in dust grains (and not in the gaseous ISM). These lifetimes exceed other involved timescales like the revolution periods or the frictional timescales by far. Thus, dust formation and destruction is probably less important for the overall dynamical processes presented in this paper. On the hand, the secular evolution of the disk might be strongly affected, when the dust-to-gas ratio becomes sufficiently large. Additionally, the spatial distribution of the dust-to-gas ratio might be influenced by locally concentrated star forming events.
These mentioned aspects (a live stellar disk, the influence of a stellar (mini-)bar and effects related to simplified dust formation and destruction model) will be part of a future paper.
5 Summary
We investigated the influence of a cold dust component on the evolution of galactic gaseous disks by means of 2-dimensional hydrodynamical simulations for flat disks. We focussed especially on the question, whether a small contribution of dust is able to destabilize a gaseous disk and what kind of structures are formed. We coupled gas and dust by a drag force depending on the relative velocities between both components and a frictional timescale. The latter is derived either only from collisions between gas and dust particles (thick disk limit) or from collisions followed by momentum equipartition in the gaseous disk (thin disk limit). Our initial models are composed of a submaximal exponential gaseous disk, a small admixture of dust and a rigid stellar and dark halo component. The rotation curve is assumed to rise linearily inside a radius of 100 pc becoming flat outside.
From the evolution of the Fourier amplitudes we found that the higher-order modes are the dominant unstable modes in the purely gaseous simulation (in our case ). Their growth is mainly restricted to the central kpc. An admixture of 2% dust (relative to the gas mass) destabilizes the gaseous disk. The dust component becomes non-linear after 100 Myr, followed by the gas 50 Myrs later. Different to the dust-free calculations, all modes have similar Fourier amplitudes.
The formed structures of both, gas and dust, are rather patchy and multi-armed as expected from the similar Fourier amplitudes of the different modes. The dust component shows much more contrast between arm and inter-arm regions than the gas. The dust is spatially correlated with gas, but it does not exactly follow the gas. Peaks in the dust distribution are frequently at the inner edges of peaks in the gas distribution. Some dust peaks are also completely outside gas concentrations and some are exactly at the positions of gas peaks. This results in a large scatter of dust-to-gas ratios at different places. The dust develops also thin filaments which sometimes connect the arms. Therefore, the dust distribution has a more cellular appearance, whereas the gas develops a multi-armed spiral morphology. The dust is sometimes organized in a ring-like structure which is the result of an instability driven by the frictional force and the self-gravity of the dust (or adjacent gas).
Below a dust-to-gas mass ratio of 1% the dynamical influence of the dust on the gaseous disk becomes negligible. This critical value is close to the observed mean value in normal galaxies like the Milky Way. Since the dust-to-gas ratio scales linearily with metallicity, larger local values of , especially in the central galactic regions, seem to be reasonable. Such values are also in agreement with local gas-to-dust determinations. Since already a dust-to-gas ratio of 2% significantly affects the evolution of the disk, even the observed small dust admixtures are expected to have an impact on the dynamics of some galaxies (e.g. the dust-rich M51). For a 10% admixture of dust the gaseous component is completely destabilized. The growth rates are enhanced by a factor of 3-4 with almost no latency phase. The saturation levels reached after 30 Myr are substantially larger than in the low- models.
The Toomre parameter of the gaseous disk has almost no influence on the dust component, but it strongly controls the gaseous phase. As usual a larger gives more stable disks. However, the destabilizing influence of the cold dust was even found for a hot disk with , though the saturation level is too small to be observable.
The results are robust with respect to technical parameters like application of artificial viscosity, grid size and grid boundaries. They are also independent on the adopted equation of state for the gas. For the dust treatment it is essential to take the self-gravity of the dust into account. The adopted equation of state of the dust is less important, provided the gas is treated as a dynamically cold component.
Acknowledgements.
N.O. acknowledges financial support from the Deutsche Forschungsgemeinschaft under grant 436 RUS 17/65/02 which made a visit in Kiel possible. The simulations have been performed on the NEC-SX5 at the computing center of the university of Kiel. The authors are grateful to Vladimir Korchagin for discussions about disk stability which stimulated this work.References
- (1) Ann H.B. 2001, AJ121, 2515
- (2) Athanassoula E. 1992, MNRAS259, 345
- (3) Bertin G., & Romeo A.B. 1988, A&A195, 105
- (4) Binney J., & Tremaine S. 1987, Galactic Dynamics, Princeton Univ. Press
- (5) Carollo C.M., & Stiavelli M. 1998, AJ115, 2306
- (6) Carollo C.M., Stiavelli M., & Mack J. 1998, AJ116, 68
- (7) Carollo C.M., Stiavelli M., de Zeeuw P.T., Mack J. 1997, AJ114, 2366
- (8) Cuzzi J.N., Dobrovolskis A.R., Champney J.M. 1993, Icarus 106, 102
- (9) Draine B.T. 2003, in The Cold Universe, Saas-Fee Advanced Course 32, D. Pfenniger (ed.), in press, (also astro-ph/0304488)
- (10) Draine B.T., & Salpeter E.E. 1979, ApJ231, 438
- (11) Edmunds M.G., Eales S.A. 1998, MNRAS299, L29
- (12) Elmegreen B.G., Elmegreen D.M., Brinks E., et al. 1998, ApJ503, 119
- (13) Elmegreen B.G., Elmegreen D.M., Eberwein K.S. 2002, ApJ564, 234
- (14) Englmaier P., & Shlosman I. 2000, ApJ528, 677
- (15) Epstein P.S. 1924, Phys. Rev. 23, 710
- (16) Frisch P.C., Dorschner J.M., Geiss J., et al. 1999, ApJ525, 492
- (17) Goldreich P., & Ward W.R. 1973, ApJ183, 1051
- (18) Goodman J., & Pindor B. 2000, Icarus 148, 537
- (19) Héraudeau Ph., & Simien F. 1998, A&AS133, 317
- (20) Hirashita H. 1999, ApJ510, L99
- (21) Issa M.R., MacLaren I., Wolfendale A.W. 1990, A&A236, 237
- (22) Jog C.J., & Solomon P.M., 1984, ApJ276, 114
- (23) Jogee Sh., Shlosman I., Laine S. et al. 2002, ApJ575, 156
- (24) Klypin A., Zhao H., Somerville R. 2002, ApJ573, 597
- (25) Laughlin G., Korchagin V., Adams F.C. 1998, ApJ504, 945
- (26) Maiolino R., Salvati M., Marconi A. et al. 2001, A&A375, 25
- (27) Montenegro L.E., Yuan C., Elmegreen B.G. 1999, ApJ520, 592
- (28) Noh H., Vishniac E.T., Cochran W. 1991, ApJ383, 372
- (29) Orlova N., Korchagin V.I., Theis Ch. 2002, A&A384, 872
- (30) Pagel B.E.J. 1987, in The Galaxy, G. Gilmore, B. Caswell (eds.), Reidel, Dordrecht, p. 341
- (31) Polyachenko V.L., Polyachenko E.V., Strel’nikov A.V. 1997, Astron. Zhurnal 23, 551 (translated Astron. Lett. 23, 483)
- (32) Romeo A.B. 1992, MNRAS256, 307
- (33) Regan M.W., & Mulchaey J.S. 1999, AJ117, 2676
- (34) Safronov V.S. 1969, Evolution of the Protoplanetary Cloud and Formation of the Earth and the Planets, Nauka, Moscow, Transl. Israel Program for Scientific Translations, Vol. 206, NASA Technical Translations NASA-TT F-677 (1972)
- (35) Spitzer L. 1978, Physical Processes in the Interstellar Medium
- (36) Stone, J.M., & Norman M.L. 1992, ApJS80, 753
- (37) Young J.S., & Scoville N.Z. 1991, ARA&A29, 581
- (38) Wada K., & Koda J. 2001, PASJ53, 1163
- (39) Weidenschilling S.J. 1980, Icarus 44, 172