eurm10 \checkfontmsam10 \pagerange1–3
Superclusters and Voids in the Sloan DSS
Abstract
We analyze quasi-2-dimensional slices of the SDSS EDR. Gaussian smoothing with weighting by the inverse of the selection function provides 2D density fields across the full survey depth. Superclusters (SC) are characterized by a percolation algorithm in the large-scale smoothed field. Group candidates are identified with density maxima in the small-scale smoothed field. The group mass function depends on the SC environmental density. We derive the shape-dependent 3-point correlation function and the void size distribution. These are well reproduced by the galaxies identified in high-resolution CDM simulations.
1 Cosmic Density Fields
fig1.jpg and fig2.jpg
Establishing large-scale cosmic density fields from the observed galaxy distribution was an early aim of analyzing galaxy redshift surveys [Saunders, Frenk, Rowan-Robinson, Lawrence & Efstathiou, G. (1991), (Saunders et al. 1991)]. Averaging over local random inhomogeneities, the density field provides genuine measures of the complex pattern of sheets and filaments in the universe comprising the ‘cosmic web’ [Bond, Kofman & Pogosyan (1996), (Bond, Kofman, & Pogosyan 1996)]. Our analysis is based on the ongoing SLOAN Redshift Survey intended to derive one million galaxy redshifts within one quarter of the sky. Here we analyze the first preliminary data release of 34 000 galaxies in two thick stripes along the celestial equator in the Northern (top) and Southern (bottom) hemispheres. This part of the survey is 95 % complete for red magnitudes . We constrain the analysis to a depth of that corresponds to a limiting distance of 570 Mpc ().
The cosmic density field in Figure 1 was Gaussian smoothed with the galaxy selection function as inverse weight to get an approximately uniform coverage of the survey volume [Einasto et al. (2003), (Einasto et al. 2003)]. We identify 43 superclusters as the largest nonlinear structures in the survey. The most massive system in the North is the Supercluster 126 containing 7 Abell clusters and 6 X-ray clusters from the ROSAT bright survey [Schwope et al. (2000), (Schwope et al. 2000)]. Most superclusters form complex multi-branching filaments with one or two strong central concentrations. The richest system in the South is the Pegasus-Pisces supercluster 3 with 9 Abell clusters.
The high-resolution density field provides a detailed insight into the cosmic web. All supercluster concentrations are subdivided into interconnected filamentary branches with galaxies like pearls on a string. We identify about 5000 galaxy groups, for which we derive harmonic radii and the velocity dispersions to estimate the virial mass for gravitationally bound systems. We find that the upper limit of the group masses is about 5 times higher in the central supercluster regions. Furthermore, we find that the group masses scatter over a larger range in overdense regions due to a further evolution of the mass hierarchy. The environmental dependence of group and cluster properties was established in high-resolution numerical simulations of galaxy formation.
2 The 3-Point Correlation Function and Void Size Distribution
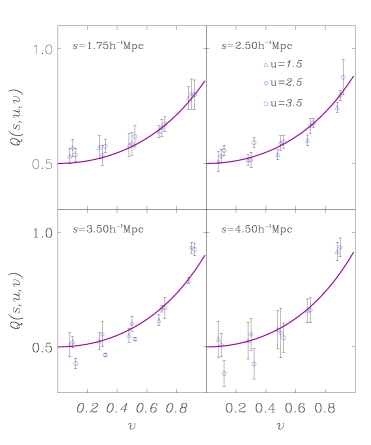
We quantify the filamentarity of the galaxy distribution in deriving the reduced 3-point correlation function shown in Figure 2, left panel. It is a reliable measure of hierarchical clustering, sensitive to the morphology of structures and accessible to gravitational perturbation theory. The four panels show the redshift space correlation function for galaxies sitting on the edges of triangles with sides , , and (, ). The increase with is characteristic for filaments. The solid lines show theoretical fits derived empirically for LCRS galaxies [Jing & Börner (1998), (Jing & Börner 1998)] that are in agreement with our data (cf. also [Kayo et al. (2004), Kayo et al. (2004)] for a recent analysis of the SDSS first data release). We compare our results with high-resolution DM-simulations ( particles with spatial resolution of a few kpc) in a 60 Mpc box size for a concordance CDM-model. There is a strong influence of redshift space corrections that remove almost all -dependence of the reduced 3-point amplitude but well preserves the increase of with (anisotropy of filamentarity of the clustering) predicted from gravitational perturbation theory. We find a weak but significant increase of this filamentarity effect for blue versus red galaxies. In the simulations we find a stronger anisotropy of for halos identified at high redshifts () than at the present epoch. Our results indicate that the amplitude of the 3-point function can be reproduced in high-resolution CDM-simulations and is not overpredicted by a factor of two as claimed by [Jing & Börner (1998), Jing & Börner (1998)].
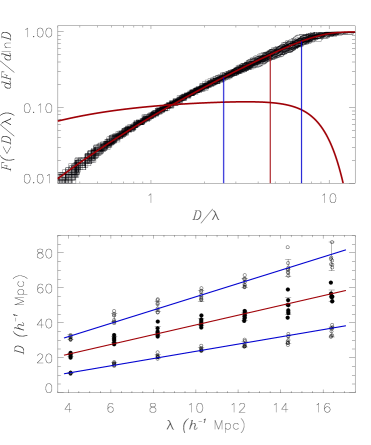
We identify a sample of voids covering most of the survey area in seven volume-limited data sets from the SDSS-EDR with the 2D-void finder of [Arbabi-Bidgoli & Müller (2002), Arbabi-Bidgoli & Müller (2002)]. The size distribution weighted with the void area is shown in Figure 2 as function of the ratio of diameter to the mean galaxy separation , , i.e. . The broad size distribution with a cut-off is in agreement with recent excursion set modeling by [sheth03, Sheth & Van de Weygaert (2003)], but it shows no abundance peak at that scale. The high abundance of small voids is typical for the galaxy void hierarchy. Voids among red galaxies (preferentially in clusters) are 15 % larger than among blue galaxies. The lower panel of Figure 2 shows that the void sizes (median and quartiles) have a characteristic linear scaling with the mean galaxy separation if the galaxies are randomly diluted. This scaling law (cf. [mueller00, Müller et al. (2000)]) characterizes the void hierarchy in the universe and in simulations.
Acknowledgements.
We want to thank our collaborators Maret and Jaan Einasto, Douglas Tucker, Sepehr Arbabi-Bidgoli, Enn Saar, and Pekka Heinämäki.References
- [Arbabi-Bidgoli & Müller (2002)] Arbabi-Bidgoli, S. & Müller, V. 2002 MNRAS 332, 205.
- [Bond, Kofman & Pogosyan (1996)] Bond, J., Kofman, L. & Pogosyan D. 1996 Nature 380, 603.
- [Einasto, Einasto, Tago, Müller, Andernach (2001)] Einasto, M., Einasto, J., Tago, E., Müller & Andernach, H. 2001 AJ 122, 2222.
- [Einasto et al. (2003)] Einasto, J., Hütsi, G., Einasto, M., Saar, E., Tucker, D., Müller, V., Heinämäki, P. & Allam, S. 2003 A&A 405, 245.
- [Jing & Börner (1998)] Jing, Y. & Börner, G. 1998 ApJ 503, 37.
- [Kayo et al. (2004)] Kayo, I., Suto, Y., Nichol, R. et al. 2004 PASP in press, asto-ph/0403638.
- [Müller, Arbabi-Bidgoli, Einasto & Tucker (2000)] Müller, V., Arbabi-Bidgoli, S., Einasto, J. & Tucker, D. 2000 MNRAS 325, 280.
- [Saunders, Frenk, Rowan-Robinson, Lawrence & Efstathiou, G. (1991)] Saunders, W., Frenk, C., Rowan-Robinson, M., Lawrence, A. & Efstathiou, G. 1991 Nature 349, 32.
- [Schwope et al. (2000)] Schwope, A., Hasinger, G., Lehmann, I. et al. 2000 Astron.N. 321, 1.
- [Sheth & Van de Weygaert (2003)] Seth, R. & Van de Weygaert, R. 2003 MNRAS submitted, astro-ph/0311260.