PFP 1: A Large Annular Planetary Nebula Caught in the First Stages of ISM Interaction
Abstract
This paper presents (H + [NII]) imaging and spectroscopy of a previously unknown, highly evolved planetary nebula of low excitation. It was discovered serendipitously from AAO/UKST H Survey images as part of a project to exploit the survey data and has evaded detection by previous surveys due to very low surface brightness. It is a remarkably annular planetary nebula, some 19′ across, making it one of the largest examples of its type. We estimate a radius of 1.5 pc and a distance of 550pc as derived from a new H surface brightness – radius relation. PFP 1 has near perfect circular symmetry, broken only at the NW edge which is coupled with significantly increased (H + [NII]) intensity. This indicates an early stage of an interaction with the interstellar medium. A blue central star candidate has been identified from the SuperCOSMOS Sky Survey data.
1 Department of Physics, University of Bristol, Bristol, BS8 1TL, UK
mark.pierce@bristol.ac.uk
2 Department of Physics, Macquarie University, Sydney, NSW 2109, Australia
dfrew@ics.mq.edu.au
3 Anglo-Australian Observatory, PO Box 296, Epping, NSW 1710, Australia
qap@ics.mq.edu.au
Keywords: ISM: planetary nebulae: general: individual (PFP 1); techniques: photometric, spectroscopic
1 Introduction
We report the discovery of a highly evolved, annular planetary nebula (PN) of large angular size in the early stages of an interaction with the interstellar medium (ISM) which we designate PFP 1. Old interacting PNe are recognised as valuable probes of the ISM (e.g. Tweedy, Martos, & Noriega-Crespo 1995; Xilouris et al. 1996; Kerber et al. 2000), but using them to build up a global picture of the ISM properties is hampered by the lack of known examples. This poor detection rate is due to the intrinsic low surface brightness of these objects. The AAO/UKST H Survey (Parker & Phillipps 1998, 2003) offers high quality narrowband images for the whole of the Southern Galactic Plane (SGP) and therefore provides a new tool which is uniquely suited to the detection of many more of these large, diffuse PNe.
Because they are so difficult to detect, studies of these objects were relatively neglected until recent years in favour of younger, brighter PN. Early work by Smith (1976) looked at the effect of a PN-ISM interaction on the position of the central star (CS) with respect to the nebula. Jacoby (1981) was the first to present detailed observational evidence of an interacting PN, Abell 35. However, it was not until later, after analyses by Borkowski, Sarazin, & Soker (1990) and Soker, Borkowski, & Sarazin (1991), that the usefulness of interacting PNe as probes of the ISM itself was recognised.
These initial studies sparked a renewed effort to find this kind of object. Tweedy & Kwitter (1996) present an imaging atlas of the 27 PNe of diameter 8′ known at that time and find evidence for PN-ISM interaction in all but four cases. More recent discoveries have added to the haul (e.g. Rauch 1999; Hewett et al. 2003), taking the number of PNe known to be interacting with the ISM to over 100.
Most previous investigations to find large, faint PNe have relied on careful scrutiny of broadband photographic survey images, e.g. Melmer & Weinberger (1990). While it has met with some success, this method is not ideal because the narrow emission lines of PN spectra are diluted in the broad bandpass of the survey filters. This problem is particularly acute for PNe of really low surface brightness and large angular extent. Use of narrowband imaging around an emission line such as H alleviates this problem, but has until recently been limited to searches of relatively small areas; e.g. Jacoby & van de Steene (1995) describe a search for new PNe around PG1159 stars using narrowband imaging.
The AAO/UKST H Survey is now available online (Parker & Phillipps 2003) and offers an unrivalled means of searching for this kind of low surface brightness object. The survey comprises contemporaneous narrowband H and broadband R photographic images which are scanned and digitised by the SuperCOSMOS plate scanning machine at ROE (Hambly et al. 2001), see http://www-wfau.roe.ac.uk/sss/halpha/. This SuperCOSMOS H Survey (SHS) is available both as 16 blocked down images and full, 0.67′′, resolution pixel data. The use of hypersensitised Tech-Pan film (Parker & Malin 1999) as the detector gives fine, arcsec spatial resolution and extreme sensitivity to faint diffuse emission (down to 5R 1111 Rayleigh = 106/4 photons cm-2 s-1 sr-1 = 2.41 10-7 erg cm-2 s-1 sr-1 at H, Parker et al., in preparation).
The survey data have already been successfully mined for small and moderate-sized PNe via painstaking visual inspection of the survey exposures to yield over 1000 new examples (e.g. Parker et al. 2003) in the Galaxy as a whole as well as over 300 new PNe in the Galactic Bulge (Peyaud, Parker, & Acker 2003). When completed, this project will more than double the number known in the southern hemisphere as compared with the combined work of the previous century.
The serendipitous discovery of PFP 1 from examination of blocked-down H data by MJP has powerfully demonstrated the utility of this technique for discovering large ( 4′) emission nebulosities, and has led DJF and QAP to re-examine the entire H survey in this way. Rebinning the data to lower resolution enhances the visibility of extended faint nebulosity. Of course, once discovered, the full resolution pixel data can be examined which permits finer study of the substructure of the PN and any interaction. As a result more than 30 large PNe candidates were discovered (some up to 30′ diameter), as well as several new optical SNR candidates (cf. Parker, Frew, & Stupar 2004). Several of the PN candidates have already been spectroscopically confirmed and will be the subject of a separate paper (Frew & Parker 2004, in preparation).
2 Observations
2.1 AAO/UKST H Survey Image
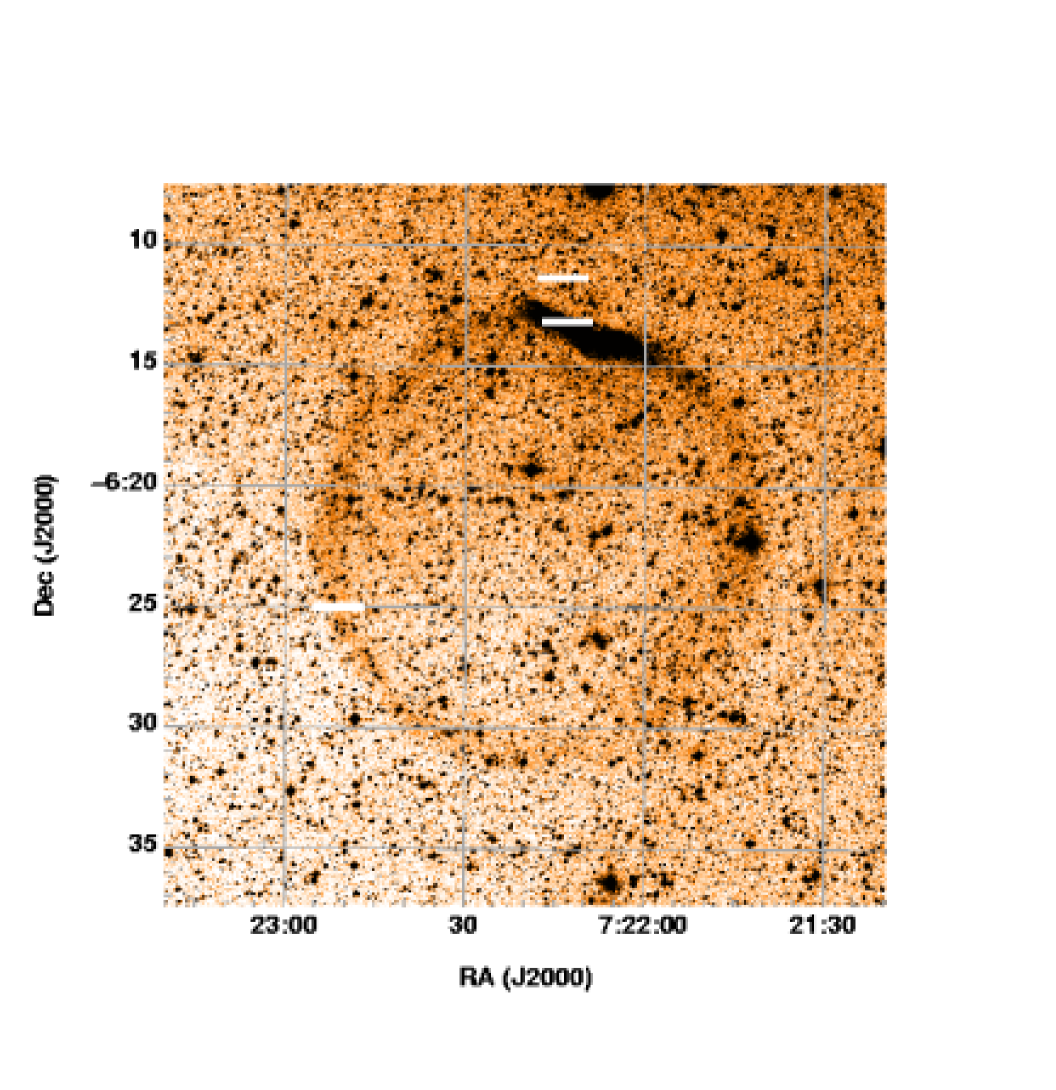
PFP 1 was discovered in the NW corner of survey field HAL1109. We show the full resolution 30′ by 30′ (H + [NII]) SHS image in Figure 1. Most of the ring is extremely faint, with the brightest part being the interacting northwest rim. The enhanced limb itself can just be discerned on the POSS I and POSS II red plates and the SERC ER survey as an elongated wisp of nebulosity (5′ long) which is easily overlooked; there is little sign of the rest of the 19′ diameter annulus. The wisp is considerably fainter in the blue, being barely visible at the plate limit on the SERC EJ survey. This is a result of the relatively weak [OIII] emission from this object as revealed by our spectra (Section 2.3).
From examination of various online multiwavelength data in the vicinity of PFP 1, such as CO maps (Dame et al. 1987), IRAS dust maps (Wheelock et al. 1994) and the SuperCOSMOS H data itself, it is clear that PFP 1 sits in a region of low extinction, devoid of active star formation. The nearest large scale emission within 50 square degrees is from the CMa OB1/R1 association which sits 6∘ south west at a distance of 1400pc (Mel’Nik & Efremov 1995). There is also a diffuse H filament which extends perpendicular to the plane at = 225∘ (Haffner, Reynolds, & Tufte 1998) 3∘ south of the nebula, which may link with general emission within the Galactic plane.
| Name | PFP 1 |
|---|---|
| Designation | PN G222.1+03.9 |
| () J2000 | 07 22 17.7, -06 21 46.4 |
| () | 222.15, 3.94 |
| SHS field | HAL1109 |
| Angular Dimensions | 1150′′ x 1100′′ |
| Excitation class | 2a, 0.6b |
| Reddening, E(B-V) | 0.050.05 |
| logF(H) | –10.730.20 |
| logF(H) | –11.210.21 |
| Distance | 550 220 pc |
| Nebular Diameter | 3.0 1.2 pc |
| Nebular Mass | 0.6 M⊙ |
| ne(rms) | 2 cm-3 |
| Age | 70 30 x 103 yr |
| a Aller (1956) | |
| b Dopita & Meatheringham (1990) | |
2.2 SHASSA and VTSS Images
The integrated H flux for this object was determined from the Southern H Sky Survey Atlas data (SHASSA, Gaustad et al. 2001). SHASSA offers narrowband (H + [NII]) and continuum CCD images of the whole southern sky. The data are at much lower spatial resolution (48′′ pixels) compared with SHS (0.67′′ pixels) but have the benefit of being continuum subtracted and intensity calibrated to a Rayleigh scale. Despite the relatively coarse resolution of the SHASSA data, PFP 1 is such an exceptionally large object that it is easily resolved by the survey.
These continuum subtracted data were used to measure the flux of both the whole nebula as well as the bright interacting rim. The flux measurement for the whole nebula was taken through a 20′ circular aperture, while the bright region was fitted as tightly as possible with an elliptical aperture. The Starlink routine Aperphotom was used in the Gaia image analysis package to make the measurements and the results are given in Table 3. In order to accurately account for the surrounding diffuse H emission, measurements of sky background were made through an aperture identical to the object aperture at fifteen points immediately adjacent to the nebula. The scatter in these is our principal uncertainty in the flux measurement.
The continuum subtracted SHASSA data come in two forms: raw, 48′′ resolution or data smoothed to 4′. The full resolution SHASSA data shows some unphysical, negative pixel values which appear to be residuals from poorly subtracted stellar images. To check that these do not unduly influence the flux measurement, we carried out the same procedure on SHASSA fields for 40 well-studied PN (of a range of surface brightness) with an independent measure of H flux given in the literature. This confirmed that, despite the artefacts, aperture photometry on the full resolution data returns the best measurement of the H flux which agrees with published results to F(H) = -0.001dex, = 0.07 for SHASSA minus literature fluxes.
The [NII]/H ratios for the northern rim and the remainder of the annulus (from the spectra described in Section 2.3) were used to deconvolve the H and [NII] contributions from the SHASSA red flux, knowing the bandpass of the filter (Gaustad et al. 2001). Their quoted zero-point error of 9 and our estimated error in the integrated [NII]/H ratio for the whole nebula of 30, have been added quadratically to get the overall uncertainty in the flux. We estimate logF(H)= –10.730.20 and use the observed H/H ratio (from our spectra) to derive logF(H) = –11.210.21.
We also looked at the relevant field (Mon07) from the Virginia Tech Spectral-Line Survey (VTSS; Dennison, Simonetti, & Topasna 1998). The VTSS resolution is coarser than SHASSA (1.6′ pixels) and consequently it is more difficult to adequately subtract the diffuse background. On the other hand, the H filter has a narrower bandpass and the [NII] contribution can be ignored. However, Gaustad et al. (2001) found the VTSS data to be fainter than SHASSA by a factor of 1.25 in one field, while Finkbeiner (2003) found this offset to be applicable to all fields in common. We confirm these findings by estimating H fluxes from VTSS for 9 well-studied PNe on different fields, finding an offset of 0.09 dex (VTSS fainter). We applied this correction to the integrated flux for PFP 1 estimated from the VTSS image and get logF(H) = –10.80.3, where the error is dominated by the uncertain background subtraction. Nevertheless, this is excellent agreement with our [NII]-corrected flux derived from SHASSA.
| Date (UT) | Slit | position | Expos | ure |
|---|---|---|---|---|
| 13 02 2004 | NW rim - 07h | 22m 13s -06∘ 13′ 05′′ | 1200s | |
| 14 02 2004 | NW rim - 07h | 22m 13s -06∘ 13′ 05′′ | 900s | 2 |
| 14 02 2004 | E rim - 07h | 22m 51s -06∘ 25′ 00′′ | 1200s | |
| 14 02 2004 | Offset Sky - 07h | 22m 14s -06∘ 11′ 20′′ | 900s |
2.3 Spectroscopic Observations
| ID | Wavelength (Å) | F() | I() | |
| OII | 3727 | 585 | 611 | |
| NeIII | 3869 | * | * | |
| H | 4340 | 45 | 46 | |
| H | 4861 | 100 | 100 | |
| OIII | 4959 | 50 | 50 | |
| OIII | 5007 | 141 | 140 | |
| OI | 6300 | * | * | |
| OI | 6364 | * | * | |
| NII | 6548 a | 228 | 216 | |
| H | 6563 a | 301 | 285 | |
| NII | 6584 a | 727 | 688 | |
| SII | 6717 a | 133 | 125 | |
| SII | 6731 a | 85 | 80 | |
| NII/H | 3.170.20 | |||
| OIII/H | 1.900.10 | |||
| SII 6717/6731 | 1.570.05 | |||
| F(H) = 1.96 erg cm-2 s-1, c(H) = 0.07 | ||||
| a From gaussian deblends of close lines. | ||||
| * Present but faint or affected by sky lines. | ||||

Spectra were obtained with the SAAO 1.9m telescope on the nights of Feb 13 and Feb 14, 2004. The standard grating spectrograph was used with a SITe 1798 x 266 pixel CCD coupled to an f/2.2 camera with an 86 mm beam. Grating 7 was used (300 lines/mm), giving a spectral coverage of 3600–7400Å. On-chip binning (2x) perpendicular to the dispersion direction was used to reduce readout noise. The slit width was widened to 400m (2.4′′ on the sky) to allow greater throughput for the faint emission of the extended PNe observed on this run, though with some loss of resolution (to 7Å). The unvignetted slit length perpendicular to the dispersion was 1.6′ and was fixed in an east-west direction. Spectra of both the faint eastern edge of the PN shell and the bright rim were obtained in separate observations summarised in Table 2. An offset sky frame was also taken as the nebula subtended the entire slit. The positions of the slit are shown in Figure 1. Dome screen flats from a quartz-iodine lamp and twilight flats were also obtained together with observations of spectrophotometric standard stars (Stone & Baldwin 1983) and PN flux standards from the list of Dopita & Hua (1997). Wavelength calibration was applied via Cu-Ar arc exposures bracketing the observations. The spectra were reduced and examined using standard IRAF routines.
The two spectra of the NW rim taken on Feb 14 were combined and used for the analysis which follows. As the conditions on Feb 13 were not photometric, the spectrum taken on that night was examined separately and confirms the findings from the two combined spectra. The combined spectra are plotted in Figure 2.
Table 3 includes the measured flux values, normalised to H = 100 in column 2 and the fluxes corrected for reddening in column 3, (assuming H/H = 2.85; Brocklehurst 1971) and adopting the R= 3.1 reddening law of Savage & Mathis (1979). The line intensities are estimated to be accurate to 30 , and as an internal check, the ratios [OIII] 5007/4959 = 2.8 and [NII] 6584/6548 = 3.2, agree well with the theoretical values of each. We derive the logarithmic extinction at H, c = 0.07, which leads to E(B-V)= 0.05 and a total visual absorption, AV= 0.15.
2.4 Identification of Candidate Central Star
| Band | Source | magnitude |
| BJ* | SSS | 15.43 0.15 |
| R2 | SSS | 15.45 0.15 |
| I | SSS | 16.51 0.15 |
| J | 2MASS | 16.64 0.16 |
| Colour | ||
| BJ–R | –0.02 | |
| R–I | –1.06 | |
| BJ–J | –1.21 |
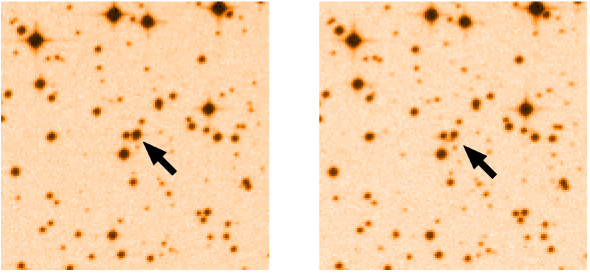
In order to find potential central star candidates, we examined digitised UKST R and BJ plates from the SuperCOSMOS Sky Survey (hereafter SSS, Hambly et al. 2001, see http://www-wfau.roe.ac.uk/sss/index.html). A careful visual inspection revealed an object just 15′′ from the geometric centre of this large nebula which is brighter in the blue plate than the red when compared with other stars in the field. The two images of this object are shown in Figure 3, first in BJ then in R. North is up and east is left.
The CS should still be close to the centre of PFP 1; only the northwest rim is brightened, implying that the interaction is at an early stage and that the bulk of the nebula is still moving with the CS. Objects showing more advanced interaction may have a substantially displaced CS, e.g. Sh 2-174 (Tweedy & Napiwotzki 1994) where the CS has actually left the nebula, and Sh 2-216 (Tweedy et al. 1995) where the CS is displaced by 24′ from the geometric centre of this 1.6∘ PN, due to the nebular material being slowed and ultimately reabsorbed into the ISM.
Some additional work was required to determine the BJ magnitude from the SSS data. The SuperCOSMOS detection and parameterisation software had not deblended the candidate CS from its nearest neighbour to the east in the blue data, although this pair were separated in R. We used the Starlink routine SExtractor in conjunction with Gaia to deblend these two objects from the UKST BJ pixel data. As SExtractor provides a flux measurement from aperture photometry for each object, we were able to make flux measurements for 2000 stars within 10′ of our candidate CS. This formed a well constrained BJ – flux relation which could be used to calibrate the BJ magnitude of the now deblended CS candidate based on its measured flux. Fitting to the calibration curve in this way gave us a magnitude estimate of B15.43 0.15 mag for our favoured CSPN. This magnitude is consistent with those tabulated in the USNO-B1.0 and GSC 2.2.01 surveys.
In Table 4 we show photometric measurements of the candidate CS obtained from the SSS, as well as the J (1.6m) magnitude from the Two Micron All Sky Survey (2MASS) Point Source Catalog. Along with the blue BJ–R colour of 0.0, the BJ–J colour of –1.2 indicates that this is a very blue object, and is consistent with the predicted B–J = –1.1 for a 105K CSPN, giving us confidence that we have indeed identified the true central star.
An apparent blue magnitude of 15.4 is quite a reasonable value for an evolved CSPN at the distance and reddening that we derive for PFP 1. The calculated M 6.6 is similar to the central star of the similarly large PN Sh 2-216, which has MB = 6.5 from an accurately determined trigonometric parallax (Harris et al. 1997).
3 Analysis
3.1 Distance and Mass
In the absence of definitive photometric and spectroscopic information on the candidate central star, the distance can be estimated by the classical Shklovsky method, assuming a value for the ionised mass of the shell. Inverting this procedure allows a determination of ionised masses for a number of evolved PNe of similar evolutionary age and morphology to our object, with distances taken from the literature. Ionised masses were calculated using the formula of Pottasch (1996):
| (1) |
where is the distance in kpc, is the flux in units of 10-11 erg cm-2 s-1, and is the nebular radius in arcseconds. We have assumed a filling factor, = 0.3 (cf. Mallik & Peimbert 1988; Boffi & Stanghellini 1994; Pottasch 1996). The range of ionised masses for 25 low surface brightness PNe with good distance determinations is 0.06 to 1.3 solar masses, excluding the anomalous objects PHL 932 (Mendez et al. 1988; Acker et al. 1998) and K 1-27 (Rauch, Koeppen, & Werner 1994; Ciardullo et al. 1999). This brackets the distance of PFP 1 to between 240 and 770 pc.
Since the more massive (evolved) PNe are known to have fainter central stars, the difference between the central star magnitude and the integrated H magnitude of the nebula is an indicator of the ionised mass of the object, and functions as a distance-independent parameter. We have found for evolved PNe with logS() –3.5 erg cm-2 s-1 sr-1 that = mB,CS – mHβ,neb ranges between –4.0 and +4.0 and correlates quite well with ionised mass. The H magnitudes were derived using the formula of Jacoby (1989) and are corrected for reddening. Note that for objects that suffer moderate reddening (or less), the apparent magnitudes may be used with little loss in utility. We have found –1.0 for low-mass, high-excitation, optically-thin PNe and that is generally positive for the larger, more massive PNe with fainter, more rapidly evolving central stars. The mass of our PN is probably not as low as 0.1 M⊙, a value typical of high-excitation objects such as NGC 246, NGC 7094 and Abell 36 (Kaler 1981), which have relatively luminous central stars, and presumably lower progenitor star masses. For PFP 1, we derive mHβ,neb = +14.1 and = +1.2, suggesting our PN has a relatively faint central star (for its observed H flux) and therefore a moderately high ionised mass and large intrinsic diameter, consistent with the low excitation class. Hence the distance is unlikely to be near the lower bound of our bracketed range.
An alternative distance method is to use an empirical H surface brightness – radius relation, calibrated with PNe which have accurate distance estimates determined using a primary method. H fluxes for these PNe were taken from the literature, supplemented with flux measurements derived from SHASSA data (see Section 2.2) for a number of low surface brightness objects. The log of the radius (derived from the quoted distance) can be plotted against the log of the reddening corrected surface brightness to give a well defined trend which can be used as a distance indicator accurate to 40. A preliminary version of this plot is shown in Figure 4 and is broadly consistent with an R-3 law as found for Magellanic Cloud PNe by Stanghellini et al. (2003). Full details of the calibration will be published elsewhere (Frew & Parker, in preparation).

From our estimated dereddened log S(H) = –6.05, we derive a radius, r= 1.5 0.6 pc, and the distance, D = 550 220 pc, immediately follows. The estimated ionised mass is then 0.6 M⊙ (for an assumed = 0.3) comfortably within the range calculated for other highly-evolved PNe. We intend to improve our distance estimate by obtaining accurate UBV photometry and a spectrum of the CSPN candidate.
3.2 Other Nebular Parameters
We used the combined spectrum of the NW rim to estimate the principal nebular parameters, tabulated in Table 1. We were also able to measure an [NII]/H ratio in the much fainter eastern rim for comparison purposes (see Section 4). The derived reddening, E(B–V) = 0.05, can be compared to the asymptotic extinction of E(B-V)= 0.26 (AV= 0.81) in this direction, as determined from the exinction map of Schlegel, Finkbeiner, & Davis (1998). This is an unusually transparent sightline through the disk, despite the low galactic latitude ( = 3.9∘), so no accurate distance estimate is possible using the extinction-distance method.
The surface brightness at H derived from the brightest 71 binned pixels (99 arcsec) along the slit is log S(H)= –4.97, which can be compared with logS(H)= –5.43 derived using the brightest SHASSA pixel value, after deconvolving the [NII] contribution to the SHASSA data and correcting for background. There is a 30 probable error on the H flux through the slit which sampled the brightest portion of the northern rim, which is only about 35′′ north to south. Considering that each 48′′ SHASSA pixel in the vicinity would sample nebulosity of varying surface brightness, we consider these values to be in reasonable agreement. The interacting rim is therefore a factor of 5–10 higher in surface brightness than that averaged over the entire nebula.
The excitation class is low, only 2 on the scale of Aller (1956), as revealed by the relatively strong [NII] and [OII] lines and weak [OIII] emission seen in our spectra. The spectrum shows very strong similarity to the bright eastern section of Sh2-216 (Fesen, Blair, & Gull 1981), though the [NII] emission is somewhat stronger; this may be an abundance effect. A decimal excitation class of 0.6 was calculated according to Dopita & Meatheringham (1990), Equation 2.1a:
| (2) |
Both indices indicate a nebula of low excitation, as expected for a highly evolved PN of large intrinsic diameter surrounding a faint evolved central star at the beginning of the white dwarf cooling track.
From the [SII]6717/6731 ratio of 1.57 we can only find the limit for n 102 cm-3 (Stanghellini & Kaler 1989) because the [SII] ratio is insensitive to electron density at this value. We can also calculate an approximate value of ne from the H flux, radius and distance of the object:
| (3) |
where D is in pc and is the radius in arcsec. We get n 2cm-3, which is one of the lowest values known.
We are unable to calculate the electron temperature due to the non-detection of the [OIII]4363 and the [NII]5755 lines.
The kinematic age can be crudely estimated assuming an expansion velocity of 20 kms-1 (Borkowski et al. 1990). The age is then 70x103 yr although this is a lower limit because the expansion rate is likely to have slowed over the course of its evolution.
Although we only have low dispersion spectra, using the emission line fitting routines in the RVSAO package in IRAF leads to a heliocentric corrected radial velocity of –18 19 kms-1, based on fits to 8 lines. Comparing equivalent measures for two Dopita & Hua (1997) PNe standards observed on the same night, we find agreement to 20 kms-1.
4 ISM Interaction
Tweedy & Kwitter (1996) suggest three criteria to confirm that PN asymmetry is caused by a PN-ISM interaction. They propose that such interactions are characterised by an asymmetry in the outer region of the nebula, accompanied by an increase in brightness at the interacting edge which also exhibits an increased [NII]/H ratio with respect to the rest of the nebula. This increased [NII]/H ratio results from material being compressed at the PN-ISM boundary, raising the density which, in turn, increases the recombination rate and lowers the ionisation state of that portion of gas. The new PN presented in this paper can be seen to satisfy the first two criteria from the SHS image. The beginning of an asymmetry, coupled with an increase in brightness, can be clearly seen in Figure 1. Our spectroscopic measurements of line ratios (see Table 3) further confirm this by showing that the bright rim does have an enhanced [NII]/H ratio of 3.2 compared with the east rim of the nebula where [NII]/H = 1.5. The ratio for the whole nebula is [NII]/H = 1.8.
Borkowski et al. (1990) discuss PN-ISM interactions in terms of the expansion velocity of the PN and the velocity of the progenitor star with respect to its surroundings. In a homogeneous, isotropic ISM, the PN will start to interact on its leading edge. As the PN expansion causes the nebular density to fall below a critical value, the gas in the shell is compressed, resulting in a brightness enhancement in this direction. As the interaction develops the leading edge of the nebula is slowed by the ISM and the PN shell becomes distorted as we see in the case of PFP 1.
At first glance this appears to be a reasonable explanation for the morphology of the new PN, especially as our examination of Galactic environment found that it sits in a low density region despite its small z distance of 40 pc. We could therefore conclude that the interaction is taking place because the PN is moving in that direction with respect to the local ISM, implying that the CS is moving NW across the field.
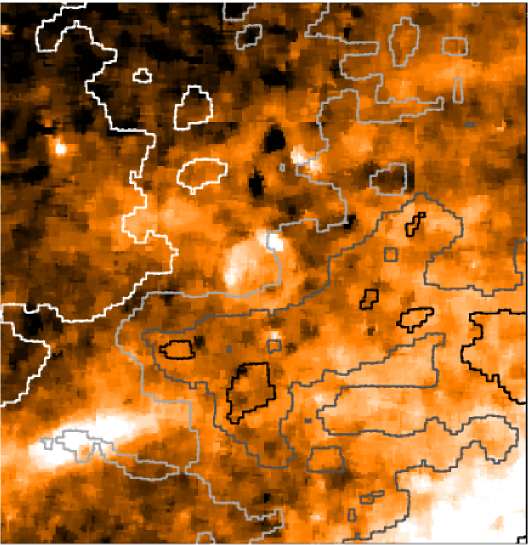
As an alternative cause of the interaction, we also investigated whether the PN is simply expanding into a region or cloud of enhanced density to the NW. An IRAS 100m dust map does show very faint dust emission sitting to the south of PFP 1 with a prominence that curls round the west edge and extends to the interacting rim. The IRAS data are plotted in Figure 5 as contours over the SHASSA H image. In the absence of distance information for the emitting dust we cannot tell whether this really is responsible for the PN interaction or if it is merely a line of sight coincidence.
5 Summary
We present preliminary observational findings of an extremely large, highly coherent, ring-shaped planetary nebula which has just started to interact with the local ISM. Using a new H surface brightness – radius relation we derive a distance of 550 pc for the new PN which is consistent with limits obtained from the inverted Shlkovsky method. The low reddening, coupled with the lack of features seen in CO and IRAS dust emission explains why PFP 1 has been able to expand unencumbered to its present size of 3.0 pc. We find two possible causes for the interaction evident on the NW rim: the motion of the PN with respect to its surroundings as per Borkowski et al. (1990) or an encounter with a region of enhanced density as it expands, but are unable to state conclusively which is responsible based on the available data. An accurate proper motion determination of the CS candidate would be useful in establishing which of these scenarios is most likely. Analysis of moderate resolution spectra has shown that this is a PN of low excitation, which is consistent with other large-diameter senile examples. A candidate CS has been identified from UKST BJ and R plates. Follow up spectroscopy is planned to confirm whether this is the true central star.
The same technique which led to the discovery of PFP 1 has furnished us with 30 other candidate PNe of size 4′. A follow up program is underway to obtain spectra and narrowband imaging of this sample to be presented in a forthcoming paper (Frew & Parker, in preparation).
Acknowledgments
This study used data from the AAO/UKST H Survey, now available online as the SuperCOSMOS H Survey (SHS) by the WFAU of the Royal Observatory, Edinburgh. These data were supplemented with calibrated images from the Southern H Sky Survey Atlas (SHASSA) and data from the Virginia Tech Spectral-Line Survey (VTSS) which were produced with support from the National Science Foundation. This research has made use of the SIMBAD database, operated at CDS, Strasbourg, France. This publication makes use of data products from the Two Micron All Sky Survey, which is a joint project of the University of Massachusetts and the Infrared Processing and Analysis Center/California Institute of Technology, funded by the National Aeronautics and Space Administration and the National Science Foundation. MJP acknowledges support from PPARC and DJF acknowledges an Australian Postgraduate Award and an ANSTO travel grant which enabled him to make the observations reported in this paper. QAP acknowledges support from the AAO and Macquarie University.
References
Acker, A., Fresneau, A., Pottasch, S. R., & Jasniewicz, G. 1998, A&A, 337, 253
Aller, L. H. 1956, Gaseous nebulae (London: Chapman & Hall, 1956)
Boffi, F. R., & Stanghellini, L. 1994, A&A, 284, 248
Borkowski, K. J., Sarazin, C. L., & Soker, N. 1990, ApJ, 360, 173
Brocklehurst, M. 1971, MNRAS, 153, 471
Ciardullo, R., Bond, H. E., Sipior, M. S., Fullton, L. K., Zhang, C.-Y., & Schaefer, K. G. 1999, AJ, 118, 488
Dame, T. M., Ungerechts, H., Cohen, R. S., de Geus, E. J., Grenier, I. A., May, J., Murphy, D. C., Nyman, L.-A., et al. 1987, ApJ, 322, 706
Dennison, B., Simonetti, J. H., & Topasna, G. A. 1998, PASA, 15, 147
Dopita, M. A., & Hua, C. T. 1997, ApJS, 108, 515
Dopita, M. A., & Meatheringham, S. J. 1990, ApJ, 357, 140
Fesen, R. A., Blair, W. P., & Gull, T. R. 1981, ApJ, 245, 131
Finkbeiner, D. P. 2003, ApJS, 146, 407
Gaustad, J. E., McCullough, P. R., Rosing, W., & Van Buren, D. 2001, PASP, 113, 1326
Haffner, L. M., Reynolds, R. J., & Tufte, S. L. 1998, ApJ, 501, L83
Hambly, N. C., MacGillivray, H. T., Read, M. A., Tritton, S. B., Thomson, E. B., Kelly, B. D., Morgan, D. H., Smith, R. E., et al. 2001, MNRAS, 326, 1279
Harris, H. C., Dahn, C. C., Monet, D. G., & Pier, J. R. 1997, in IAU Symp. 180: Planetary Nebulae, 40
Hewett, P. C., Irwin, M. J., Skillman, E. D., Foltz, C. B., Willis, J. P., Warren, S. J., & Walton, N. A. 2003, ApJ, 599, L37
Jacoby, G. H. 1981, ApJ, 244, 903
—. 1989, ApJ, 339, 39
Jacoby, G. H., & van de Steene, G. 1995, AJ, 110, 1285
Kaler, J. B. 1981, ApJ, 250, L31
Kerber, F., Furlan, E., Rauch, T., & Roth, M. 2000, in ASP Conf. Ser. 199: Asymmetrical Planetary Nebulae II: From Origins to Microstructures, 313
Mallik, D. C. V., & Peimbert, M. 1988, RMxAA, 16, 111
Melmer, D., & Weinberger, R. 1990, MNRAS, 243, 236
Mel’Nik, A. M., & Efremov, Y. N. 1995, AstL, 21, 10
Mendez, R. H., Kudritzki, R. P., Groth, H. G., Husfeld, D., & Herrero, A. 1988, A&A, 197, L25
Parker, Q. A., Frew, D. J., & Stupar, M. 2004, AAO Newsl., 104, 9
Parker, Q. A., & Malin, D. 1999, PASA, 16, 288
Parker, Q. A., & Phillipps, S. 1998, PASA, 15, 28
Parker, Q. A., & Phillipps, S. 2003, in ASP Conf. Ser. 289: The Proceedings of the IAU 8th Asian-Pacific Regional Meeting, Volume I, 165–176
Parker, Q. A., et al. 2003, in Proc. IAU Symp. 209, Planetary Nebulae and their role in the Universe
Peyaud, A. E. J., Parker, Q. A., & Acker, A. 2003, in SF2A-2003: Semaine de l’Astrophysique Francaise, 311
Pottasch, S. R. 1996, A&A, 307, 561
Rauch, T. 1999, A&AS, 135, 487
Rauch, T., Koeppen, J., & Werner, K. 1994, A&A, 286, 543
Savage, B. D., & Mathis, J. S. 1979, Ann. Rev. Astron. Astrophys., 17, 73
Schlegel, D. J., Finkbeiner, D. P., & Davis, M. 1998, ApJ, 500, 525
Smith, H. 1976, MNRAS, 175, 419
Soker, N., Borkowski, K. J., & Sarazin, C. L. 1991, AJ, 102, 1381
Stanghellini, L., & Kaler, J. B. 1989, ApJ, 343, 811
Stanghellini, L., Shaw, R. A., Balick, B., Mutchler, M., Blades, J. C., & Villaver, E. 2003, ApJ, 596, 997
Stone, R. P. S., & Baldwin, J. A. 1983, MNRAS, 204, 347
Tweedy, R. W., & Kwitter, K. B. 1996, ApJS, 107, 255
Tweedy, R. W., Martos, M. A., & Noriega-Crespo, A. 1995, ApJ, 447, 257
Tweedy, R. W., & Napiwotzki, R. 1994, AJ, 108, 978
Wheelock, S. L., Gautier, T. N., Chillemi, J., Kester, D., McCallon, H., Oken, C., White, J., Gregorich, D., et al. 1994, NASA STI/Recon Tech Report N, 95, 22539
Xilouris, K. M., Papamastorakis, J., Paleologou, E., & Terzian, Y. 1996, A&A, 310, 603