Serpens X-1 observed by INTEGRAL††thanks: Based on observations with INTEGRAL, an ESA project with instruments and science data centre funded by ESA member states (especially the PI countries: Denmark, France, Germany, Italy, Switzerland, Spain), Czech Republic and Poland, and with the participation of Russia and the USA.
Here we report results of an INTEGRAL-AO1 observation of the X-ray burst and atoll source Ser X-1 performed in May 2003. The object was observed for a total on-source time of 400 ks but nearly 8∘ off-axis due to its amalgamation with an observation of SS 433, the pointing target source. Ser X-1 has been clearly detected up to 30 keV with unprecedented positional accuracy for high-energy emission. The 20–30 keV light curve showed substantial variability during the observation. Comparison with previous observations indicates that the source was in its high (‘banana’) state and displayed a soft spectrum during the INTEGRAL pointing. A (non simultaneous) radio-to-–rays broad-band spectral energy distribution is also presented for the first time and discussed.
Key Words.:
X-rays: binaries — X-rays: individuals: Ser X-1 — Stars: neutron1 Introduction
Low Mass X-ray Binaries (LMXRBs) form the most populated class of Galactic X-ray binaries. They are X-ray binary systems in which the mass donor star is less than about 1 and loses matter via Roche-lobe overflow to a very compact accretor. Matter forms an accretion disk as it falls towards the compact object. Many of these systems contain a weakly magnetized neutron star (NS) and are persistently bright in X-rays.
The study of spectral and temporal properties of NS LMXRBs in the X-ray energy band below 20 keV has shown the existence of two subclasses of sources. These were identified by their difference in the hardness ratio from two adjacent X-ray bands as a function of the source intensity in the total energy band (hardness-intensity diagram) and/or their track on an X-ray ‘colour-colour’ diagram (CD) constructed by using two hardness ratios using different energy bands. These two subclasses were labeled as Z sources, if they track a Z-shape, or part of it, in the CD and atoll sources if their position in the CD draws an atoll-shaped figure. Indeed, Z sources are in general permanently bright, while atoll sources show flux variations by factors ranging from about 5 to about 1000 or more and, in parallel, substantial spectral variations (e.g., Piraino et al. 1999). Also, the timing behaviour is different between the two subclasses; see e.g. van der Klis (2000) for details on this classification and on the properties of these subclasses. However, recent results indicate that atoll sources actually track a Z shape on year-long timescales (Gierliński & Done 2002; Muno et al. 2002).
Ser X-1, or 4U 1837+04, has been classified as an atoll source (e.g., Liu et al. 2001). Archival EXOSAT data (Seon & Min 2002) showed this object in the ‘banana’ (i.e. high luminosity) state during the observations. More recent BeppoSAX and RXTE pointings (Oosterbroek et al. 2001) caught the source while it was again in a high activity state, with an unabsorbed flux (1–200 keV) of 8.010-9 erg cm-2 s-1. We refer the reader to the work of these authors for the most recent description of the broadband X–ray spectral and timing properties of this source. Ser X-1 has never been seen in the hard (‘island’) state that is observed in atoll sources at low luminosities (Hasinger & van der Klis 1989).
This source also exhibits Type I X-ray bursts (e.g. Lewin et al. 1995); moreover, during 2001, BeppoSAX pinpointed a very long (4 hours) X-ray burst (Cornelisse et al. 2002), making this source join the group of ‘superbursters’ (see Kuulkers 2003 for a review). By studying X-ray bursts observed with Einstein, Christian & Swank (1997) deduced a distance to the source of 8.4 kpc. This implies a 1–200 keV luminosity of 6.71037 erg s-1 during the BeppoSAX observation of Oosterbroek et al. (2001), which means roughly one third of the Eddington luminosity for a NS.
The optical counterpart to Ser X-1, located in a crowded stellar field (Thorstensen et al. 1980), was correctly identified by Wachter (1997) and, subsequently, spectroscopically confirmed and studied by Hynes et al. (2004). Very recently, the radio counterpart was discovered with the VLA (Migliari et al. 2004).
In this paper we report and discuss the results of an observation of Ser X-1 performed with the INTErnational Gamma–RAy Laboratory (INTEGRAL; Winkler et al. 2003) during AO1 on May 2003, i.e. less than 7 months after the launch of this spacecraft. This paper is thus structured as follows: Sect. 2 describes the observations and the data analysis, Sect. 3 reports the results of the INTEGRAL pointing as well as the construction of a broadband spectral energy distribution (SED) for Ser X-1 using literature data along with the high-energy ones presented here; then, in Sect. 4 a discussion will be given.
2 Observations and data analysis
The observations presented here were acquired during revolutions 67 to 69, i.e. between 12:00 UT of 3 May 2003 and 09:26 UT of 9 May 2003, for a total on-source time of 400 ks, with the IBIS (Ubertini et al. 2003) and SPI (Vedrenne et al. 2003) instruments onboard INTEGRAL. These detectors allow an actual 20 keV – 10 MeV spectral coverage altogether. In particular, the IBIS telescope is composed of two detector layers: ISGRI (Lebrun et al. 2003), optimized for the energy range 20–200 keV, and PICsIT (Di Cocco et al. 2003; Labanti et al. 2003), covering the range from 175 keV to 10 MeV. Data were acquired with a spacecraft rectangular 55 dithering pattern mode.
The field of Ser X-1 was also intermittently observed with Unit 2 of the coded-mask X-ray monitor JEM-X on board INTEGRAL (Lund et al. 2003). During the period in which the observation reported here was performed, Unit 1 of JEM-X was not available, being turned off to avoid fast degradation of the detector. The present INTEGRAL observation of Ser X-1 was amalgamated with one targeting SS433 (Cherepashchuk et al. 2003), thus leaving Ser X-1 about 78 off axis; hence, JEM-X could only observe this object for a small fraction of the total 400 ks exposure time. All JEM-X observations of Ser X-1 were at an off-axis angle larger than 36; we only considered JEM-X pointings in which the source was less than 45 off axis, because of uncertainties in the knowledge of the instrument response at larger offset angles. Thus, JEM-X data from 22 pointings, corresponding to about 40 ks of observation time, have been used in the present analysis.
Ser X-1 was outside the field of view of the fourth instrument carried by INTEGRAL, i.e. the optical camera OMC (Mas-Hesse et al. 2003), and therefore no data collected with OMC were available for this source during the present INTEGRAL pointing.
The data reduction and analysis was performed with the standard Offline Scientific Analysis (OSA v3.0111Available through the INTEGRAL Science Data Centre (ISDC, Geneva, Switzerland) at the web address: http://isdc.unige.ch/index.cgi?Soft+download), whose algorithms are described in Goldwurm et al. (2003a) for IBIS and in Diehl et al. (2003) for SPI. The count rates extracted from the standard pipeline were normalized to those measured during off-axis observations of the Crab, in order to obtain fluxes in terms of physical units. Given the present uncertainties in the flux evaluation for off-axis sources (see Goldwurm et al. 2003b), we adopted a procedure similar to that explained by Goldoni et al. (2003) to analyse the IBIS data for off-axis sources. For JEM-X the analysis was performed using software still under development at DSRI, Copenhagen (Denmark). The count rates extracted for Ser X-1 were compared to results from off-axis Crab observations analyzed with the same software. For details concerning the JEM-X analysis software see Westergaard et al. (2003).
3 Results
| Energy range | INTEGRAL | Flux | Luminosity |
|---|---|---|---|
| (keV) | instrument | (erg cm-2 s-1) | (erg s-1) |
| 3–5 | JEM-X | (2.20.2)10-9 | 1.91037 |
| 5–10 | JEM-X | (1.760.15)10-9 | 1.51037 |
| 10–15 | JEM-X | (0.440.10)10-9 | 3.71036 |
| 15–35 | JEM-X | 110-9 | 8.41036 |
| 20–30 | ISGRI | (6.20.3)10-11 | 5.21035 |
| 20–30 | SPI | 5.010-11 | 4.21035 |
| 30–40 | ISGRI | 610-12 | 51034 |
| 30–40 | SPI | 2.610-11 | 2.21035 |
| 220–280 | PICsIT | 110-10 | 81035 |
Measurements and upper limits for the X-ray emission in various energy bands from Ser X-1 during the present INTEGRAL pointing are listed in Table 1. Below we report the findings obtained with each instrument onboard INTEGRAL.
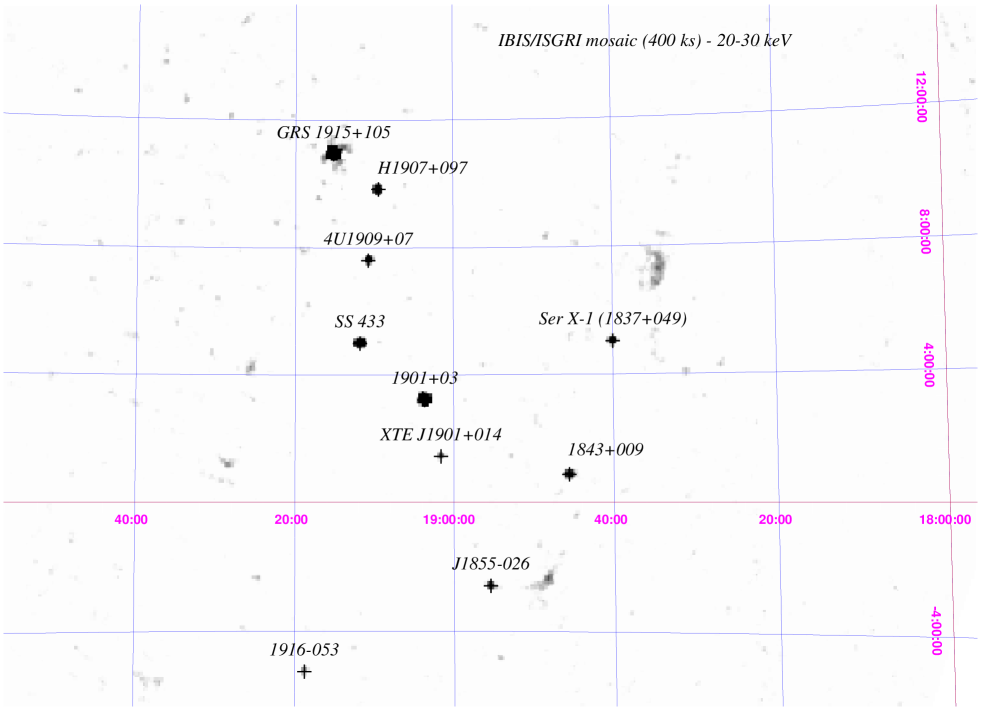
Ser X-1 was clearly detected with ISGRI in the 20–30 keV band (Fig. 1) with a significance of 25 over the whole 400 ks observation, with a count rate of 0.840.03 counts s-1. Nothing was detected above 30 keV at the position of this source: the upper limit to the emission in the 30–40 keV range is reported in Table 1. Our ISGRI results agree with those obtained by Molkov et al. (2004) using INTEGRAL observations acquired before and after ours.
The object was also not detected in the whole spectral range covered by PICsIT. A upper limit of 4 photons cm-2 s-1 in the energy band centered at keV and = 60 keV wide was obtained from the PICsIT data (see Table 1).
SPI also did not reveal any significant emission from Ser X-1. From Table 1 one can note an apparent discrepancy between the flux obtained from the ISGRI detection and the SPI upper limit: this can be explained in terms of a not yet complete correction for systematic errors.
JEM-X detected the source in the 3–15 keV band with significance 30 in 2200 s when the source was 36 off axis. Using off-axis observations of the Crab (as mentioned in the previous section), we measured, in the three bands 3–5, 5–10 and 10–15 keV, the fluxes shown in Table 1. A 3 upper limit was instead obtained from the 15–35 keV band data; its value is in agreement with the ISGRI 20–30 keV detection.
The ISGRI source detection was at coordinates = 18h 40m 000, = +05∘ 02′ 06′′ (J2000). The significance of the detection implies a 90% confidence positional accuracy of 1′ (Gros et al. 2003). As regards JEM-X, it detected Ser X-1 at = 18h 39m 562, = +05∘ 01′ 57′′ (J2000) with a 99% confidence uncertainty of 40′′ in both coordinates. The two positions are in good agreement with each other, given the off-axis location of the source within the fields of view of ISGRI and JEM-X. The object localization afforded by these two instruments onboard INTEGRAL is moreover fully consistent with that of the optical counterpart MM Ser (Thorstensen et al. 1980; Wachter 1997) as well as with the radio position (Migliari et al. 2004).
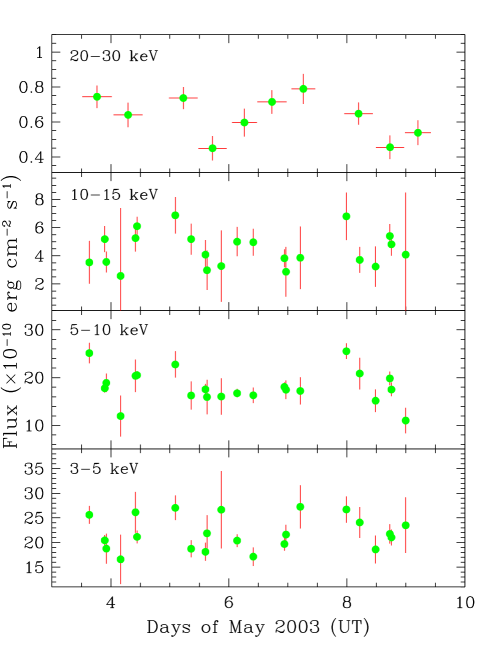
The 20–30 keV light curve of Ser X-1, rebinned to 40 ks, is shown in Fig. 2. We chose this temporal resolution as it turned out to be the best tradeoff between the time sampling and the S/N ratio of each bin. Substantial fluctuations are apparent in this band; so, in order to test their reality, we performed a fit to the data points on the hypothesis that the emission is constant. By means of a standard test it was found that the constancy of the 20–30 keV emission from this source is rejected at the 99.99% confidence level.
Figure 2 also shows the Ser X-1 light curves in the 3–5, 5–10 and 10–15 keV ranges as obtained with JEM-X. Each point corresponds to a single JEM-X pointing (2 ks long). We also explored the JEM-X light curves using higher time resolutions down to 500 s in the parts of the observation covered by the instrument (slots lasting 5 ks on average and separated by off-source intervals of about 20 ks). We did not find any hint of X-ray bursts or superbursts in these light curves. We of course cannot exclude the possibility that X-ray (super)bursts from Ser X-1 may have occurred in the 6 days covered by our INTEGRAL observation during the time intervals in which the source was outside the JEM-X field of view.
Observations with the All-Sky Monitor (ASM222ASM light curves are
available at:
http://xte.mit.edu/ASM_lc.html; Levine et al.
1996) onboard the satellite RXTE (Bradt et al. 1993) showed that
Ser X-1 had an average flux of 2088 mCrab in the 1.5–12 keV band at
the time of the INTEGRAL pointing, taking into account that 75 ASM
counts s-1 correspond to 1 Crab in this band. For comparison, during
the BeppoSAX observation, the ASM data indicate that the source was
at 2393 mCrab in the same energy band.
This 15% difference in brightness apparently was not reflected in
the overall spectral shape in the 1.5–12 keV range: indeed, the ASM hardness
ratios HR1 and HR2 (defined as the ratio between the ASM counts in the
3–5 keV band and those in the 1.5–3 keV band, and as the ratio of the
counts in the 5–12 keV band to those in the 3–5 keV band, respectively),
were 1.010.11 and 1.200.10 during the INTEGRAL pointing
and 1.020.04 and 1.200.03 at the time of the BeppoSAX
observation, respectively.
In addition, the JEM-X fluxes measured from Ser X-1 during the present INTEGRAL observation were found to be in general agreement with those obtained with the ASM in the spectral range over which the sensitivities of these two instruments overlap.
Feeling justified by these results, we expanded the spectral coverage of Ser X-1 down to 1.5 keV by adding to the INTEGRAL data set simultaneous 1.5–3 keV data acquired by the ASM. These ASM counts in the 1.5–3 keV were thus averaged over the duration of the INTEGRAL pointing; next, they were converted into fluxes assuming the spectral description for Ser X-1 provided by Oosterbroek et al. (2001), care being taken to rescale it with the use of the archival ASM data obtained simultaneously with the BeppoSAX observation.
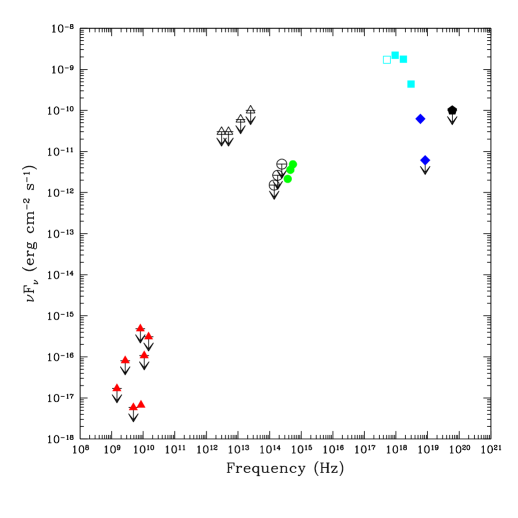
We then collected published optical data (Wachter 1997) and near-infrared (NIR) 2MASS data (Skrutskie et al. 1997), as well as far-infrared upper limits (Beichman et al. 1988) and radio data (Migliari et al. 2004; Wendker 1995 and references therein). This allowed us to construct, for the first time for Ser X-1, a broadband SED (Fig. 3) spanning radio to –ray frequencies. Although non-simultaneous with the high-energy part of the spectrum, these lower frequency data and upper limits can give us a general description of the overall SED of this source thanks to the relative long-term stability of its emission with time.
Optical and NIR data were corrected assuming a color excess = 0.8
(e.g. Hynes et al. 2004 and references therein) and converted into fluxes
using the normalizations by Fukugita et al. (1995) for the optical and
the ones referring to the 2MASS333These normalizations are
available at:
http://www.ipac.caltech.edu/2mass/releases/
allsky/faq.html
for the NIR. Given the resolution of the 2MASS survey (pixel size: 2′′)
and the crowding of the Ser X-1 field (e.g. Wachter 1997), we considered
the 2MASS NIR detections as conservative upper limits to the actual source
fluxes in the bands.
4 Discussion
We observed Ser X-1 with INTEGRAL; we detected the source in the 3–15 keV band with the JEM-X instrument, and in the 20–30 keV range with the ISGRI detector of the IBIS instrument. Upper limits for the source flux were instead obtained in the 30–40 keV band and around 250 keV with the ISGRI and PICsIT detectors, respectively. The positional accuracy in the 20–30 keV band (1′) is unprecedented, and the observation indicates that no significant nearby hard source is present within a radius of few degrees from Ser X-1. Thus we can exclude any contamination from persistent field sources in past observations of Ser X-1 made with previous non-imaging hard X-ray detectors (e.g., the HPGSPC and the PDS onboard BeppoSAX).
The source appears to be variable by a factor two in intensity in the 20–30 keV band on timescales of 100 ks (Fig. 2). A similar behaviour was present in the 2–10 keV band as observed by the MECS instrument onboard BeppoSAX (Oosterbroek et al. 2001), although in this case the variability amplitude was about 25%, thus not as strong as in the INTEGRAL observations. This however is most likely a sampling effect due to the shorter duration (60 ks) of the BeppoSAX pointing: indeed, during the first 80 ks of ISGRI data the flux variation in the 20–30 keV band is comparable to that seen with BeppoSAX.
The difference between the ISGRI and MECS light curves might however be due to a further reason: as the 20–30 keV flux is likely dominated by the Comptonization component, while that between 2 and 10 keV by the blackbody (or disk-blackbody) originating close to the NS surface, the two components might display variability with different timescales which in turn may be reflected in the light curve shape of the two above mentioned bands. Unfortunately, again the ASM and JEM-X light curves do not carry enough information to confirm or disprove this hypothesis.
The light curve sampling of JEM-X and ISGRI did not allow us to look for X-ray bursts from the surface of the NS harboured in this system throughout the entire observation: only in the 40 ks covered by JEM-X can we exclude their presence. We therefore cannot rule out that some of the variability we see in the 20–30 keV range is caused by these phenomena occurring when JEM-X was pointing off-source; however, for typical values of their spectral shape, rate and overall energy output (see e.g. Sztajno et al. 1983), we do not expect that X-ray bursts can contribute substantially to the total energy radiated in 40 ks by Ser X-1 in the 20–30 keV band, which amounts to 21040 erg.
The observed 100 ks timescale variability also cannot be explained assuming the occurrence of a ‘superburst’ like the one reported by Cornelisse et al. (2002), which lasted 4 hours and emitted 1040 erg in the 20–30 keV range. Indeed such a phenomenon, if present, can be contained in a single 40-ks bin of the 20–30 keV light curve reported in Fig. 2. The variations detected between adjacent bins in this spectral range might instead have been produced by a superburst but, again, the sparse ASM dwell-by-dwell and JEM-X data coverage during the INTEGRAL pointing does not allow us to check this hypothesis.
It should moreover be noted that the trend seen in the 20–30 keV light curve suggests that the source seems to vary periodically on a 3 days timescale: this roughly matches a possible (superorbital?) X-ray periodicity of 3.4 days already reported for Ser X-1 (Ponman 1981; Ritter & Kolb 2003).
The 20–30 keV flux measurement obtained with INTEGRAL is about 20% lower than that obtained from the model by Oosterbroek et al. (2001) in the same band (810-11 erg cm-2 s-1); this roughly agrees with the difference (15%) in the ASM flux as seen between the epochs of the BeppoSAX and INTEGRAL pointings. The 30–40 keV to 20–30 keV flux ratio in the INTEGRAL data is 0.1 which is consistent with the value of 0.054 as measured by BeppoSAX. The lack of sufficient coverage in the soft X-rays did not allow us to give a better description of the spectrum of this object; however, from the above results we can confidently say that we observed the atoll source Ser X-1 in its bright (banana) state, albeit at a lower intensity with respect to the time in which the BeppoSAX pointing was done, i.e., September 1999.
The broadband SED of Ser X-1 clearly shows a cut-off in the energy distribution above 31018 Hz (10 keV). This can be reasonably taken to be due to the drop of the Comptonization tail induced by the electron temperature, 3 keV as determined by Oosterbroek et al. (2001), and to the lack of further components in the –ray domain. No simple model can fit the overall SED: while the optical data fall above the extrapolation of the BeppoSAX X-ray model by a factor 100, a smooth connection between optical and radio data may be present. Indeed, radio and optical fluxes are marginally consistent with lying on the same power law, , with 0.2. This might indicate that the mechanism responsible for the radio emission (possibly a jet) can play a substantial role in the observed optical light from this source also (see e.g. Fender 2003 and Migliari et al. 2004).
Acknowledgements.
We thank Simone Migliari for having communicated to us the Ser X-1 radio detection result prior to publication. Pavel Binko is acknowledged for the help in the INTEGRAL data retrieval from the ISDC archive. This work has made use of the NASA Astrophysics Data System Abstract Service, of the SIMBAD database, operated at CDS, Strasbourg, France, and of data products from the 2MASS. ASM data were provided by the RXTE ASM teams at MIT and at the RXTE SOF and GOF at NASA’s GSFC. This research was partially funded by ASI. We also thank the referee for several comments which helped us to improve this paper.References
- (1) Beichman, C., Neugebauer, G., Habing, H.J., Clegg, P.E., & Chester, T.J. (eds.) 1988, IRAS Catalogs and Atlases Explanatory Supplement (Washington, DC: GPO), NASA RP-1190, vol. 1
- (2) Bradt, H.V., Rothschild, R.E., & Swank, J.H. 1993, A&AS, 97, 355
- (3) Cherepashchuk, A.M., Sunyaev, R.A., Seifina, E.V., et al. 2003, A&A, 411, L441
- (4) Christian, D.J., & Swank, J.H. 1997, ApJS, 109, 177
- (5) Cornelisse, R., Kuulkers, E., in ’t Zand, J.J.M., Verbunt, F., & Heise, J. 2002, A&A, 382, 174
- (6) Di Cocco, G., Caroli, E., Celesti, E., et al. 2003, A&A, 411, L189
- (7) Diehl, R., Baby, N., Beckmann, V., et al. 2003, A&A, 411, L117
- (8) Fender, R.P. 2003, in Compact Stellar X-Ray Sources, ed. W.H.G. Lewin & M. van der Klis (Cambridge: Cambridge Univ. Press), in press [astro-ph/0303339]
- (9) Fukugita, M., Shimasaku, K., & Ichikawa, T. 1995, PASP, 107, 945
- (10) Gierliński, M., & Done, C. 2002, MNRAS, 331, L47
- (11) Goldoni, P., Bonnet-Bidaud, J.M., Falanga, M., & Goldwurm A., 2003, A&A, 411, L399
- (12) Goldwurm, A., David, P., Foschini, L., et al. 2003a, A&A, 411, L223
- (13) Goldwurm, A., Gros, A., Goldoni, P., et al. 2003b, IBIS/ISGRI instrument specific software scientific validation report, v1.0
- (14) Gros, A., Goldwurm, A., Cadolle-Bel, M., et al. 2003, A&A, 411, L179
- (15) Hasinger, G., & van der Klis, M. 1989, A&A, 225, 79
- (16) Hynes, R.I., Charles, P.A., van Zyl, L., et al. 2004, MNRAS, 348, 100
- (17) Kuulkers, E. 2003, The observers’ view of (very) long X-ray bursts: they are super!, in proceedings of the 2nd BeppoSAX Meeting ”The Restless High-Energy Universe”, ed. E.P.J. van den Heuvel, J.J.M. in ’t Zand & R.A.M.J. Wijers, Nucl. Phys. B Suppl. Ser., in press [astro-ph/0310402]
- (18) Labanti, C., Di Cocco, G., Ferro, G., et al. 2003, A&A, 411, L149
- (19) Lebrun, F., Relay, J.P., Lavocat, P., et al. 2003, A&A, 411, L141
- (20) Levine, A.M., Bradt, H.V., Cui, W., et al. 1996, ApJ, 469, L33
- (21) Lewin, W.H.G., van Paradijs, J., & Taam, R.E. 1995, in X-ray Binaries, ed. W.H.G. Lewin, J. van Paradijs, & E.P.J. van den Heuvel (Cambridge: Cambridge Univ. Press), p. 175
- (22) Liu, Q.Z., van Paradijs, J., & van den Heuvel, E.P.J. 2001, A&A, 368, 1021
- (23) Lund, N., Budtz-Jørgensen, C., Westergaard, N.J., et al. 2003, A&A, 411, L231
- (24) Mas-Hesse, J.M., Giménez, A., Culhane, J.L., et al. 2003, A&A, 411, L261
- (25) Migliari, S., Fender, R.P., Rupen., M., et al. 2004, MNRAS, in press [astro-ph/0402600]
- (26) Molkov, S.V., Cherepashchuk, A.M., Lutovinov, A.A., et al. 2004, Astron. Lett., in press [astro-ph/0402416]
- (27) Muno, M.P., Remillard, R.A., & Chakrabarty, D. 2002, ApJ, 568, L35
- (28) Oosterbroek, T., Barret, D., Guainazzi M., & Ford, E.C. 2001, A&A, 366, 138
- (29) Piraino, S., Santangelo, A., Ford, E.C., Kaaret, P. 1999, A&A, 349, L77
- (30) Ponman, T.J. 1981, Space Sci. Rev., 30, 353
- (31) Ritter, H., & Kolb, U. 2003, A&A, 404, 301
- (32) Seon, K.-I., & Min, K.W. 2002, A&A, 395, 141
- (33) Skrutskie, M.F., Schneider, S.E., Stiening, R., et al. 1997, The Two Micron All Sky Survey (2MASS): Overview and Status, in The Impact of Large Scale Near-IR Sky Surveys, ed. F. Garzon, N. Epchtein, A. Omont, B. Burton, & P. Persi (Dordrecht: Kluwer Acad. Publ.), p. 25
- (34) Sztajno, M., Basinska, E.M., Cominsky, L.R., et al. 1983, ApJ, 267, 713
- (35) Thorstensen, J.R., Charles, P.A., & Bowyer, S. 1980, ApJ, 238, 964
- (36) Ubertini, G., Lebrun, F., Di Cocco, G., et al. 2003, A&A, 411, L131
- (37) van der Klis, M. 2000, ARA&A, 38, 717
- (38) Vedrenne, G., Roques, J.-P., Schönfelder, V., et al. 2003, A&A, 411, L63
- (39) Wachter, S. 1997, ApJ, 490, 401
- (40) Wendker, H.J. 1995, A&AS, 109, 177
- (41) Westergaard, N.J., Kretschmar, P., Oxborrow, C.A., et al. 2003, A&A, 411, L257
- (42) Winkler, C., Courvoisier, T.J.-L., Di Cocco, G., et al. 2003, A&A, 411, L1