Constraining the Lifetime of Circumstellar Disks in the Terrestrial Planet Zone: A Mid-IR Survey of the 30-Myr-old Tucana-Horologium Association
Abstract
We have conducted an N-band survey of 14 young stars in the 30 Myr-old Tucana-Horologium Association to search for evidence of warm, circumstellar dust disks. Using the MIRAC-BLINC camera on the Magellan I (Baade) 6.5-m telescope, we find that none of the stars have a statistically significant N-band excess compared to the predicted stellar photospheric flux. Using three different sets of assumptions, this null result rules out the existence of the following around these post-T Tauri stars: (a) optically-thick disks with inner hole radii of 0.1 AU, (b) optically-thin disks with masses of 10-6 M⊕ (in 1-µm-sized grains) within 10 AU of these stars, (c) scaled-up analogs of the solar system zodiacal dust cloud with 4000 the emitting area. Our survey was sensitive to dust disks in the terrestrial planet zone with fractional luminosity of log(Ldust/L∗) 10-2.9, yet none were found. Combined with results from previous surveys, these data suggest that circumstellar dust disks become so optically-thin as to be undetectable at N-band before age 20 Myr. We also present N-band photometry for several members of other young associations and a subsample of targets that will be observed with Spitzer Space Telescope by the Formation and Evolution of Planetary Systems (FEPS) Legacy Science Program. Lastly, we present an absolute calibration of MIRAC-BLINC for four filters (, , , and ) on the Cohen-Walker-Witteborn system.
1 INTRODUCTION
Circumstellar disks appear to be a nearly ubiquitous by-product of the star-formation process. Most low-mass stars in the youngest star-formation regions (e.g. the 1-Myr-old Orion Nebula Cluster (catalog ONC)) have spectroscopic or photometric evidence of a circumstellar disk (Hillenbrand et al., 1998). The masses of circumstellar disks found around some T Tauri stars are similar to that of the minimum mass solar nebula (Beckwith et al., 1990). Their physical sizes are similar to that of our own solar system (10s-100s AU; McCaughrean & O’Dell, 1996). Considering their masses, dimensions, and appearance at the very earliest stages of stellar evolution, these disks are considered “protoplanetary”. Radial velocity surveys of nearby solar-type stars indicate that at least 5% have at least one Jupiter-mass planet orbiting within a few AU (Marcy & Butler, 2000), indicating that the formation of gas giant planets is one likely outcome of circumstellar disk evolution.
The incidence of inner protoplanetary accretion disks diminishes with age, being very common at ages 1 Myr, and very rare at 10 Myr. The fraction of low-mass stars with disks inferred by IR excess (in the L-band; 3.5 µm) diminishes with age, with half losing their inner disks (0.1 AU) by age 3 Myr (e.g. Haisch, Lada, & Lada, 2001a). Using population statistics of pre-MS stars in the Taurus molecular clouds (catalog NAME TAURUS MOLECULAR CLOUD), multiple studies have demonstrated that the transition time for disks inside of 1 AU to go from optically-thick to optically-thin is 105 yr (Skrutskie et al., 1990; Wolk & Walter, 1996). While some studies argue that accretion terminates by age 6 Myr (Haisch, Lada, & Lada, 2001a), recent studies suggest that it may continue at lower accretion rates around some stars until at least age 10 Myr (Muzerolle et al., 2000; Mamajek, Meyer, & Liebert, 2002; Lawson et al., 2002; Lawson, Lyo, & Muzerolle, 2004). There are preliminary indications that disks may persist longer for stars in associations which lack massive OB stars and for the lowest mass stars (e.g. Lyo et al., 2003; Haisch, Lada, & Lada, 2001b). Although understanding the evolution of accretion disks has improved, the evolution of dust in the terrestrial planet zone is still largely unexplored.
Although the phenomenon of optically-thick accretion disks appears to be isolated to the first few Myr of a star’s life, numerous examples of older stars with optically-thin dust disks have been found over the past two decades, primarily using space-based IR telescopes, e.g. InfraRed Astronomical Satellite (IRAS) and Infrared Space Observatory (ISO) (Backman & Paresce, 1993; Lagrange, Backman, & Artymowicz, 2000). Optically-thin disks have been found around stars over a wide range of ages and masses, but those with the highest fractional luminosity ( = Ldisk/L⋆) are mostly confined to those younger than few100 Myr in age (Habing et al., 2001; Spangler et al., 2001). These dusty “debris” disks are inferred to be created by the collisions of larger bodies, rather than primordial ISM dust (Harper, Loewenstein, & Davidson, 1984; Backman & Paresce, 1993). For micron-size dust grains orbiting between 0.1-10 AU, the timescale for Poynting-Robertson drag to pull the grains into the star (101-5 yr) is short compared to typical stellar ages (107-10 yr), implying that either the observed phenomena is short-lived, or that grains must be replenished through collisions of larger bodies. There is preliminary evidence for a monotonic decrease in dust disk optical depth with age (Spangler et al., 2001), or possibly a more precipitous drop in optical depth after age 400 Myr (Habing et al., 2001). Most of the known debris disks have been identified by excess far-IR emission above that of the stellar photosphere (e.g. Silverstone, 2000), with characteristic dust temperatures of 30-100 K. Despite efforts to find warm (T 200-300 K) dust disks around field stars, precious few examples with detectable 10-12µm excesses are known (Aumann & Probst, 1991).
Observational constraints on the evolution of circumstellar dust in the terrestrial planet zone are currently scarce. Planned observations with the recently launched Spitzer Space Telescope (SST) by the Formation and Evolution of Planetary Systems (FEPS) Legacy Science program111http://feps.as.arizona.edu, among others, will remedy this situation. FEPS plans to systematically trace the evolution of circumstellar gas and dust around sun-like stars between the epoch of optically-thick accretion disks (ages few Myr) to the epoch of mature planetary systems (ages few Gyr; Meyer et al., 2002, 2004).
Although SST promises to provide a leap in our understanding of the circumstellar environs of stars, we can address a basic question about disk evolution using currently available ground-based facilities. How much dust remains within a few AU of young stars during the epoch of terrestrial planet formation? We address this question through a mid-IR survey of a sample of young, low-mass stars with ages of 30 Myr: the Tuc-Hor Association (catalog T-HA).
Dynamical simulations suggest that, given the surface mass density of the minimum-mass solar nebula, runaway growth can take place and form Moon-sized planetary “embryos” within 105 yr (Wetherill & Stewart, 1993). When the largest embryos reach radii of 1000 km, gravitational interactions increase the eccentricities and collision velocities of smaller planetesimals, causing more dust-producing collisions (Kenyon & Bromley, 2004). Over the next 107-108 yr, the growth of the largest embryos is dominated by giant impacts, which consolidate the embryos into a small number of terrestrial planets (Agnor, Canup, & Levison, 1999; Chambers, 2001). During this epoch in our own solar system, the proto-Earth is hypothesized to have been impacted by a Mars-sized planetesimal, which formed the Earth-Moon system (Hartmann & Davis, 1975; Stevenson, 1987). Chronometry studies using radioactive parent-daughter systems (such as 182Hf-182W) suggest that the Earth-Moon impact occurred 25-35 Myr after the formation of the solar system (Kleine et al., 2002; Kleine, Mezger, & Münker, 2003). We know that around at least one star (our Sun), terrestrial planets were forming at age 30 Myr.
In §2 we describe the sample, our mid-IR observations, and data reduction. §3 presents the results of our photometry. We present three simple circumstellar disk models in §4, and calculate upper limits to the amount of dust orbiting within 10 AU of the stars observed. In §5 we discuss our results in light of previous observational and theoretical efforts in order to better understand disk evolution around young stars. In the Appendix, we present information related to the photometric calibration of the MIRAC-BLINC system, as well as details regardings stars for which mid-IR excesses were detected.
2 OBSERVATIONS
2.1 The Sample
Our mid-IR survey contains 14 low-mass stars that we argue are probable members of the 30-Myr-old Tuc-Hor Association (catalog T-HA). The observations of the Tuc-Hor (catalog T-HA) stars are presented in Table 2. Observations of some Tuc-Hor (catalog T-HA) candidates that we reject as members, and other young stars (some of which are FEPS SST Legacy Science targets) are included in Table 3. Here we discuss some technical aspects of the Tuc-Hor (catalog T-HA) sample.
The Tucana (catalog Tucana Association) and Horologium associations are young stellar moving groups that were identified nearly contemporaneously by Zuckerman & Webb (2000, ZW00) and Torres et al. (2000, TDQ00). Zuckerman, Song, & Webb (2001, ZSW01) present an updated membership list and photometry, and suggest that the similar ages, kinematics, and positions of the Tucana (catalog Tucana Association) and Horologium associations allow us to consider them a single group (“Tuc-Hor (catalog T-HA)”). We adopt 30 Myr as a reasonable age estimate for Tuc-Hor (catalog T-HA) based on recent values in the literature (see Table 1).
The published membership lists for Tuc-Hor (catalog T-HA) appear to be somewhat subjective and contain some stars that are unlikely to be members. In order to include stars that are plausibly members of Tuc-Hor as part of our study, we used kinematics as the primary membership criterion (in addition to the other criteria used in previous studies). For the combined Tuc-Hor (catalog T-HA) membership lists of TDQ00, ZW00, ZSW01, we calculate membership probabilities using the equations of de Bruijne (1999), the heliocentric space motion of the Tucana (catalog Tucana Association) nucleus from ZW00, and the best long-baseline proper motions available at present (preferably Tycho-2 or UCAC2; Høg et al., 2000; Zacharias et al., 2003). We reserve rigorous discussion of membership and kinematics for a separate future study. For this study, we retain only those stars whose membership we could not reject based on proper motion data. We find that 30% of the stars proposed as members of Tuc-Hor (catalog T-HA) have proper motions inconsistent with the motion of the assumed Tucana “nucleus” (centered on the Tuc mini-cluster; using space motion vector given by Zuckerman & Webb, 2000). The published membership lists appear to contain several field stars, a handful of which we observed with MIRAC (Table 3) before appreciating that they were probable non-members. Care should be used by investigators employing samples of recently-discovered, diffuse stellar associations (e.g. Tuc-Hor (catalog T-HA)) for the study of age-dependent stellar phenomena.
We include in our Tuc-Hor (catalog T-HA) sample the active dwarf HD 105 (catalog HIP 490) (= HIP 490 (catalog HD 105)). HD 105 (catalog HIP 490) is in the same region of sky (, (ICRS) = 00h05m, –41∘45) as the other proposed Tuc-Hor (catalog T-HA) stars, and has a Hipparcos distance of = 40 pc. For our calculations we adopt the long baseline Tycho-2 proper motion (Høg et al., 2000) and the Tuc-Hor space motion vector from Zuckerman & Webb (2000). In subjecting HD 105 (catalog HIP 490) to the same kinematic tests as the other Tuc-Hor (catalog T-HA) candidates, we are unable to reject its membership. The calculated cluster parallax (25.3 mas) and predicted radial velocity (0 km s-1) agree very well with the observed trigonometric parallax (24.9 0.9 mas; ESA, 1997) and measured RV (+1.7 2.5 km s-1; Wichmann, Schmitt, & Hubrig, 2003). The equivalent width of the Li I 6707 line (165 mÅ; Cutispoto et al., 2002) is similar to that for early-G-type members of 50 Myr-old IC 2602 (catalog ) and IC 2391 (catalog ) clusters (Randich et al., 2001), and stronger than that found in 120-Myr-old Pleiades (catalog M 45) stars (Soderblom et al., 1993). Finally, the X-ray luminosity of HD 105 (catalog HIP 490) (log(LX) = 29.4 erg s-1; Cutispoto et al., 2002) is similiar to what is expected for early-G stars with ages of 10-100 Myr (Briceño et al., 1997). Therefore, we conclude that HD 105 (catalog HIP 490) is a likely member of the Tuc-Hor (catalog T-HA) association.
2.2 Data Acquisition
Mid-IR images of the Tuc-Hor (catalog T-HA) members and other young stars were obtained during the nights of 6-10 August 2001 and 22 August 2002 (UT) with the MIRAC-BLINC instrument on the Magellan I (Baade) 6.5-m alt-az telescope at Las Campanas Observatory, Chile. The Mid-InfraRed Array Camera (MIRAC-3) contains a Rockwell HF16 128 128 hybrid BIB Si:As array, and was built at the Steward Observatory, University of Arizona, and the Harvard-Smithsonian Center for Astrophysics (Hoffmann et al., 1998). The BracewelL Infrared Nulling Cryostat (BLINC) is a nulling interferometer mated to MIRAC-3 (Hinz et al., 2000). In our observing mode, however, BLINC is used as a re-imaging system, reducing the f/11 beam from the Magellan tertiary mirror to a f/20 beam required for the MIRAC-3 instrument. The pixel scale is 0.123″/pixel, resulting in a FOV of 15.7″.
Our intent was to survey for circumstellar dust surrounding our target stars in the terrestrial planet zone (0.3-3 AU), with characteristic temperatures of 300 K, and corresponding Wien emission peak at 10 µm. Observations were obtained with either the wide-band filter ( = 10.34µm for an A0 star, where is the isophotal wavelength, e.g. Golay, 1974) or narrow-band “” filter ( = 11.57µm for an A0 star) in standard chop-nod mode (4 position beam switching; see Appendix 1 of Hoffmann & Hora, 1999). The nod and chop separations were 8″, and the chop (frequency of 3-10 Hz) was in a direction perpendicular to the nod vector. The chop-nod imaging technique produces two positive and two negative images of the star in a square configuration on the detector. The nod separation was chosen so that all four images of the star appear on the detector with sufficient room for determination of the background flux in annuli surrounding each star image. We found that using chop frequencies between 3 and 10 Hz mitigated the effects of poorly subtracted sky background (background noise increases as chop frequency decreases) while maintaining observing efficiency (increasing the chop frequency adds overhead time, with minimal improvement in background subtraction). Chopping was done with an internal pupil plane beam-switching mirror within BLINC. The frame time (on-chip integration time) was either 10 ms (-band) or 40 ms (-band), and these frames were co-added in 15-30 s long integrations per nod beam. We found that derotating the MIRAC-BLINC instrument (i.e. freezing the cardinal sky directions on the detector) in the Nasmyth port during observations resulted in poorer background subtraction compared to turning the derotation off. Hence, for the majority of observations taken during these nights, the instrument derotation was turned off. The ability to guide the telescope while derotating the instrument, was not available during our observing runs. Hence the telescope was not guiding during most of our observations. This had negligible impact on the achieved image quality, but limited our ability to reliably co-add data for faint sources.
2.3 Reduction
The MIRAC images were reduced using the custom program mrc2fts (Hora, 1991) and IRAF222 IRAF is distributed by the National Optical Astronomy Observatories, which are operated by the Association of Universities for Research in Astronomy, Inc., under cooperative agreement with the National Science Foundation. http://iraf.noao.edu routines. Flat fields were constructed from images of high (dome) and low (sky) emissivity surfaces. A median sky frame was produced and subtracted from the individual (N 10) dome frames. The results were then median combined to produce the final flat field. The pixel-to-pixel variation in sensitivity (2% r.m.s.) of the MIRAC detector is small enough that flat-fielding had negligible effect on our derived photometry.
Aperture photometry was derived using the IRAF phot package. We used aperture radii of either 0.62” (5 px) or 1.23” (10 px), depending on which flux had the higher S/N ratio after the photometric errors were fully propagated (dominated by sky noise for large aperture or uncertainty in aperture correction for smaller apertures). The photometry derived with aperture radii of 5 px and 10 px were consistent within the errors for all of the stars observed. The background level was determined by measuring the mean sky value per pixel in an annulus centered on the star with inner radius 1.85” (15 pix) and outer radius 3.08” (25 pix) for subtraction. The background annulus radii were chosen so as to sample a negligible contribution of the star’s PSF, but to avoid the PSFs from the other images of the same star. For the faintest sources, an aperture radius of 5 px was usually used, in which case an aperture correction was applied to place all photometry on the 10 px system. The aperture corrections were determined nightly using standard stars, and the typical correction to the 5 px aperture radius photometry was –0.32 0.05 mag. Photometric solutions (zero points and airmass corrections) were determined for every night of observations. The typical airmass corrections at -band were 0.1-0.2 mag airmass-1. The conversion between fluxes (in mJy) and magnitudes is simply magλ(star) = –2.5 log{(star)/(0)}, where (star) is the star’s flux at wavelength , and (0) is the flux of a zero-magnitude star (see Appendix A). The sensitivity was such that we could detect a star with of magnitude 7.5 in -band, at S/N 5, with 600 s of on-source integration time.
We observed standard stars taken from the MIRAC manual (Hoffmann & Hora, 1999), the list of ESO IR standards (van der Bliek, Manfroid, & Bouchet, 1996), and the list of Cohen et al. (1999). M. C. calculated an independent calibration of the MIRAC photometric system, using the approach identical to that described in Cohen, Wheaton, & Megeath (2003). Discussion on the input data for the absolute photometric calibration, the zero-magnitude attributes of the MIRAC filter systems, and standard star fluxes, are given in Appendix A. The absolute accuracy of the standard star fluxes among the four filters ranges from 1.7-4.5%.
3 RESULTS
-band photometry for young stars in Tuc-Hor (catalog T-HA) is presented in Table 4, while photometry for stars in other regions (most belonging to young, nearby associations) is presented in Table 5. Near-infrared () photometry from the 2MASS catalog (Cutri et al., 2003) was used to help predict the brightness of the stellar photospheres at 10µm. For the range of spectral types investigated, models predict that 0.00 within our photometric errors (typically 0.05-0.10 mag), hence we plot and on the same color-color plot, and generically refer to these colors as “” throughout. A color-color plot of the Tuc-Hor (catalog T-HA) stars is illustrated in Fig. 1.
Fig. 1 indicates that colors are fairly uniform for stars with 0.7, i.e. for FGK stars. We decided to analyze the M stars separately from the FGK stars. We surmise that much of the structure in the published color-color relations for dwarfs is probably due to statistical fluctuations (e.g. Cohen et al., 1987; Waters, Cote, & Aumann, 1987; Mathioudakis & Doyle, 1993; Kenyon & Hartmann, 1995). After examining our data and those from previous studies of large dwarf samples, we decided to assume a constant color for the photospheres of FGK stars. In calculating a mean intrinsic color, we include the FGK stars in Tables 4 and 5, but exclude the FGK stars HD 143006 (catalog ), [PZ99] J161411 (catalog PZ99 J161411.0-230536) (both with 2), and HIP 95270 (catalog ) and HIP 99273 (catalog ) (known to have far-IR excesses which may contaminate -band flux, e.g. Zuckerman & Song, 2004). The median, unweighted mean, and weighted mean color for the FGK stars are all similar (0.05, 0.04 0.02, and 0.07 0.02, respectively). These estimates agree well with the mean FGK dwarf color found by Fajardo-Acosta, Beichman, & Cutri (2000, +0.04 implies +0.05) and are close to the value for AFGK-type dwarfs found by Aumann & Probst (1991, = +0.02 implying = +0.01) 333Although not explicitly stated, the K photometry from Aumann & Probst (1991) appears to be on the CIT system, where 2MASS = – 0.019 (Carpenter, 2001). The MIRAC -band photometric system assumes N = 0.00 for Vega (catalog ), whereas Aumann & Probst (1991) list [12] = +0.01 for Vega (catalog ). We ignore any color terms in converting [12] to a predicted magnitude, and derive (–[12]) – 0.01.. Within the uncertainties, our measured mean color for FGK dwarfs is consistent with previous determinations. The mean colors for the young stars in our observing program do not appear to be biased toward red colors due to the presence of circumstellar material. We adopt = +0.05 as the photospheric color for FGK-type stars with 0.69.
The observed colors of the M-type stars are systematically redder than those of the FGK stars, as well as the M-giant standards. We looked for independent confirmation that the turn-up in color for the coolest dwarfs is a real effect, and not due to circumstellar material. We measure a color of = 0.33 0.06 for the 12-Myr-old M0 star GJ 803 (catalog ). Song et al. (2002) studied the spectral energy distribution of GJ 803 (catalog ) and concluded that the observed cold dust excess detected by IRAS at 60µm does not contribute significant flux at 12µm, and that the IRAS 12µm flux is consistent with a NextGen model photosphere. Our observed 11.6µm flux (608 32 mJy) agrees very well with the predicted photospheric flux (633 mJy at 11.6µm), as well as the color-corrected IRAS 12µm flux (537 32 mJy). These observations confirm that the observed color for GJ 803 (catalog ) is photospheric, and that the turn-up in color for M stars is real. It appears that none of the M-type stars has a statistically significant mid-IR excess. For the purposes of calculating upper limits on mid-IR excess, we fit a line to the mean colors for the KM-type stars with 0.6 (excluding the T Tauri star [PZ99] J161411 (catalog PZ99 J161411.0-230536)), and model the M-type dwarf photosphere colors as: = –0.947 + 1.448 (0.69 0.92).
We determine whether a star has detectable excess at or through calculating the excess as:
| (1) |
| (2) |
The contribution to the -band excess from interstellar extinction will only become similar in size to our photometric errors if 1-2 mag, hence we can safely ignore extinction for the stars observed. We examined the residuals (defined as ) in order to identify statistically-significant outliers (i.e. possible -band excess stars). The 5-Myr-old Upper Sco members HD 143006 (catalog ) and [PZ99] J161411 (catalog PZ99 J161411.0-230536) (Preibisch & Zinnecker, 1999) both stand out with definite -band excesses ( 15-20), and they are discussed further in Appendix B. There are two stars with positive 2-3 excesses (HIP 6485 (catalog ) and HIP 6856 (catalog )), however there are three stars with 2-3 deficits (HIP 9685 (catalog ), GJ 879 (catalog ), and [PZ99] J161318 (catalog PZ99 J161318.6-221248)). Hence, the weak excesses for HIP 6485 (catalog ) and HIP 6856 (catalog ) are probably statistical and not real. Excluding the two Upper Sco stars with strong -band excesses, we find that 56 12% of the excesses E(N) are within 1 of zero, and 88 15% are within 2 (uncertainties reflect Poisson errors). It does not appear necessary to introduce a non-zero uncertainty in the intrinsic . If one wanted to force 68% of the residuals to be within 1 and 95% to be within 2, then either [] 0.07-0.09 mag, or our observational uncertainties are underestimated by 40%. We searched for, and could not find, a plausible reason why our photometric errors would be underestimated by such a large amount. The observations of our standard stars certainly do not support a significant increase in our quoted photometric errors. More calibration observations are required to see if this dispersion can be attributed to actual structure in the intrinsic colors of normal dwarf stars as a function of spectral type.
Among the Tuc-Hor (catalog T-HA) stars, only one star has as observed -band flux 3 above that expected for stellar photosphere: HIP 6856 (catalog ) (3.0 excess). However, there is a Tuc-Hor member with a similarly sized flux deficit (HIP 9685 (catalog ); –2.9), so it is difficult to claim that the excess for HIP 6856 is statistically significant. We find that none of the 14 Tuc-Hor (catalog T-HA) members has an -band excess more than 3 offset from the dwarf color relation. We estimate a conservative upper limit to the -band excess due to a hypothetical dust disk as 3 the uncertainty in the flux excess (; given in column 8 of Table 4).
4 DISK MODELS
Our survey was designed to be sensitive enough to detect the photospheres of young stars, hence we can place meaningful constraints on the census of even optically-thin circumstellar disks in our target sample. We analyze the upper limits to possible mid-IR excess for the Tuc-Hor stars using three different models. The first model assumes a geometrically-thin, optically-thick disk with a large inner hole. The second model assumes emission from an optically-thin disk of single-sized grains. The third model treats the hypothetical disks as a scaled-up version of the zodiacal dust disk in our solar system.
4.1 Optically-Thick Disk With Inner Hole
Infrared and submillimeter observations of T Tauri stars in dark
clouds show that roughly half are orbited by an optically-thick
circumstellar dust disk (see review by Beckwith, 1999).
While the stars in our sample are roughly an order of magnitude
older (30 Myr) than typical T Tauri stars
in dark clouds (3 Myr),
we can ask the question: If the Tuc-Hor (catalog T-HA) stars have
optically-thick,
geometrically-thin disks, what is the minimum inner hole radius allowed
by observations?
To answer this question for each star, we adopt the axisymmetric,
geometrically-thin, optically-thick disk model of Adams, Lada, & Shu (1987),
and follow the formalism of Beckwith et al. (1990).
While we assume a face-on orientation ( = 0), our
results are not strongly dependent on this assumption.
We also assume that
the disk is optically-thick between and
(300 AU is assumed for all models) and at all frequencies
(1 – 1). This is a safe assumption for
T Tauri star disks in the wavelength regime probed in this study
( 100 µm; Beckwith et al., 1990).
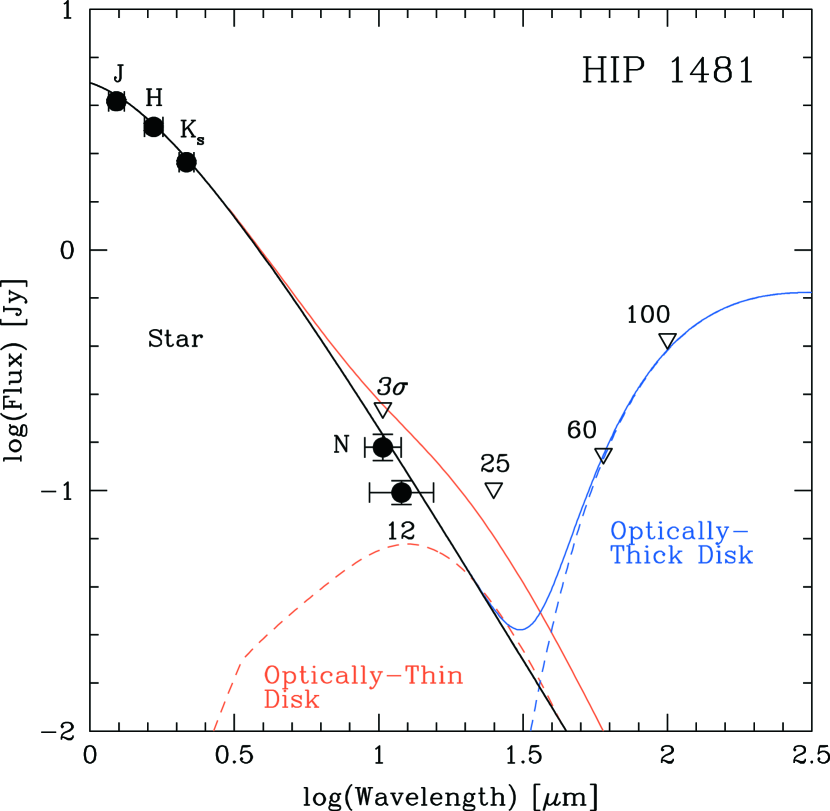
Our -band photometry alone allows us to rule out optically-thick disks with inner hole radii of 0.1 AU for the Tuc-Hor stars. Stronger constraints on inner disk radius for a hypothetical optically-thick circumstellar disk can be calculated by including IRAS photometry. For IRAS point sources, we adopt 25 µm, 60 µm, and 100 µm fluxes and upper limits from the Faint Source Catalog (Moshir et al., 1990). Where no IRAS point source is detected, we adopt the IRAS Point Source Catalog upper limits of 0.5 Jy (25 µm), 0.6 Jy (60 µm), and 1.0 Jy (100 µm) (IPAC, 1986). For the brightest stars, the IRAS 60 µm and 100 µm data provide the strongest constraints on the existence of an optically thick disk, whereas for the fainter K and M-type stars, the MIRAC photometry provides the strongest constraint. IRAS did not map the region around HD 105 (catalog ), hence the inner hole radius we derive for this star is based only on the MIRAC -band 3 upper limit. In Fig. 2, we illustrate a typical example (HIP 1481) of how the MIRAC and IRAS photometry constrain the existence of optically-thick disks around the Tuc-Hor (catalog T-HA) stars. The values we derive for the minimum inner hole radius for a hypothetical optically-thick disk are given in column 5 of Table 6. The median value of the minimum inner hole radius is 0.3 AU (range: 0.1-7.9 AU). The -band and IRAS upper limits place the strongest constraints on inner hole size for the luminous F stars ( 5 AU), and the weakest constraints for the faint K/M stars ( 0.1 AU). The MIRAC and IRAS photometry easily rule out the existence of optically-thick disks with inner hole radii of 0.1 AU of the 30 Myr-old Tuc-Hor (catalog T-HA) stars.
4.2 Optically-Thin Disk
In the absence of circumstellar gas, a putative mid-IR excess around a 30-Myr-old star would be most likely to be due to an optically-thin debris disk rather than an optically-thick T Tauri-type disk. The stellar ages (107.5 yr) are orders of magnitude greater than the Poynting-Robertson drag timescale (103-4 yr) for typical interplanetary dust grains orbiting 1 AU from a solar-type star. Small dust grains must be continually replenished by collisions of larger bodies, or else they would be only detectable for astrophysically short timescales. Using a simple, single grain-size model, we place upper limits on the amount of orbiting dust within several AU of the 30-Myr-old Tuc-Hor (catalog T-HA) stars.
Circumstellar dust grains surrounding young main sequence stars should most likely have radii somewhere between the scale of typical ISM grains (0.01-1 µm; Mathis, Rumpl, & Nordsieck, 1977) and solar system zodiacal dust (10-100 µm; Grün et al., 1985). Theoretically, an ensemble of dust grains produced from a collisional cascade of fragments is predicted to follow the equilibrium power-law size distribution (Dohnanyi, 1969): d = d, where = 3.5. Indeed this power law distribution is observed for ISM grains (Mathis, Rumpl, & Nordsieck, 1977) and asteroids (Greenberg & Nolan, 1989). With = 3.5, most of the mass is in the largest (rarest) grains, but most of the surface area in the smallest (most common) grains. If the grain size distribution has a minimum cut-off, the mean grain size is calculated to be = 5/3 (e.g. Metchev, Hillenbrand, & Meyer, 2004). A limit on the minimum grain size can be estimated from consideration of radiation pressure blow-out (e.g. Artymowicz, 1988):
| (3) |
Where is the luminosity of the star, is the radiation pressure efficiency factor averaged over the stellar spectral energy distribution, is the Newtonian gravitational constant, is the mass of the star, is the speed of light, and is the grain density (assumed to be 2.5 g cm-3; Grün et al., 1985). The minimum grain size corresponds to the case where the ratio of the radiation pressure force to the stellar gravitational force is / = 1. For this calculation we assume the geometric optics case where = 1. For the idealized grain orbiting the Sun at 1 AU, we calculate = 0.2 µm and = 0.4 µm. The grain size lower limit may be larger if the momentum imparted by stellar winds dominates radiation pressure. The minimum grain size will be somewhat lower if we calculate using Mie theory and stellar spectral energy distributions, instead of adopting the geometric optics case. Highlighting the uncertainty in this calculation, we note that the value of that we calculate for the Sun is smaller than the mean interplanetary dust particle orbiting in the Earth’s vicinity (Grün et al., 1985). This is largely due to a complex interplay between Poynting-Robertson drag and collisions. Increasing the cross-section of dust particles in the solar system zodiacal dust cloud by 104 (i.e. comparable to what we are sensitive to in Tuc-Hor, see §4.3), will decrease the collision timescale, and correspondingly decrease the mean particle size to comparable to the blow-out grain size (Dominik & Decin, 2003).
We model the thermal emission from an optically-thin disk of single-sized dust grains of radius orbiting in an annulus between inner radius and outer radius . Spherical grains emit thermally at a temperature where the incident energy flux from the star is equal to the isotropically emitted output energy flux of the grain. We approximate the emissivity of the single-size dust grains by using the simple model of Backman & Paresce (1993): emissivity for , and for longer wavelengths, where we assume = 1.5. Our adopted value of is similar to that observed for zodiacal dust (see Fig. 2 of Fixsen & Dwek, 2002) and ISM grains (Backman & Paresce, 1993). The mass opacity is calculated as . The optical depth of emission through the disk annulus is , where is the surface density of the disk in g cm-2. We calculate the orbital distance from the star () of dust grains heated to temperature using equation #5 from Wolf & Hillenbrand (2003). We verify that this relation is valid by comparing our calculations with Backman & Paresce (1993) for grains much larger than the Wien peak of incident light (blackbody case) and for grains much smaller than the Wien peak of incident light (e.g. ISM grains). For the Tuc-Hor (catalog T-HA) stars, the Wien peak of incident starlight is comparable to . We assume a flat mass surface density profile (; ), which is appropriate for a population of dust grains in circular orbits subject to Poynting-Robertson drag (see discussion in §4.1 of Wolf & Hillenbrand, 2003, and references therein). This predicted power law is close to what is observed for the zodiacal dust disk in our own solar system (; Kelsall et al., 1998).
Where exactly to define the inner and outer radii of a hypothetical dust disk requires some basic modeling. Among the Tuc-Hor (catalog T-HA) stars, 90% of the thermal emission from our hypothetical disk model at -band comes from within 1.5-2.2 of the star, where is the radius at which the dust is at the Wien temperature () for the isophotal wavelength of the -band filter, and (eqn. 6.9 of Whittet, 2003). For simplicity, we adopt a consistent definition of the outer radius for all stars as 2. Beyond 2, the hypothetical dust disk contributes negligible flux (10%) to what is observed in the -band filter. Approximately 50% of the thermal emission observed in -band from a hypothetical dust disk comes from within 0.4-0.5 of the star. For , we adopt the radius for which the grain temperature is 1400 K – approximately the silicate dust sublimation limit. The temperatures of the inner edges of typical T Tauri star disks appear to be near this value (Muzerolle et al., 2003). For the Tuc-Hor (catalog T-HA) stars, AU and AU. Hence we are most sensitive to dust at orbital radii comparable to our inner solar system.
Results for a typical set of fitted model parameters for our optically-thin disk model are illustrated in Fig. 2. Our calculations suggest that the survey was sensitive to dust disk masses of ( g) in a single-sized dust grain population (of uniform size , typically 0.1-2 µm). Our optically-thin model puts upper limits of 10-6-10-5 g cm-2 on the surface density of micron-sized dust grains in the 0.1-10 AU region around the Tuc-Hor (catalog T-HA) stars. For the masses and surface densities quoted, we assume that all of the mass is in dust grains of size . In order to convey how sensitive our assumptions are for our final results, we show the effects of changing various parameters on our results in Table 7. The dust disk masses that we calculate are similar to those found by other studies (Chen & Jura, 2001; Metchev, Hillenbrand, & Meyer, 2004) which also use the single grain-size approximation. The dust mass surface density upper limits that we calculate are 10-7-10 that of the solids in the minimum mass solar nebula (Weidenschilling, 1977), however we are not sensitive to bodies much larger than the wavelength of our observations, or to gas.
4.3 Single-Temperature Zody Disk
Another simple model to apply to our data is that of a scaled-up version of the terrestrial-zone zodiacal dust cloud in our own solar system. Though the detailed zodiacal dust model for the inner solar system is quite complex (Kelsall et al., 1998), it can also be approximated by a single temperature blackbody (T = 260 K) with bolometric luminosity 8 10-8 L⊙ (Gaidos, 1999). This luminosity and temperature imply an equivalent surface area of 5 10-6 AU2 1 1021 cm2. Gaidos (1999) defines this area as 1 “zody” (1 ). The unit is useful for comparing relative amounts of exozodiacal dust between the Sun and other stars.
With none of our stars having statistically significant -band excesses, we calculate upper limits to the number of zodys present using 3 the uncertainty in the excess measurement, assuming , and blackbody emission from large grains (i.e. analogous to the situation for the solar system zodiacal dust disk). An upper limit on the fraction of grain thermal emission to stellar emission ( = ) was also calculated for each star using these assumptions. While the MIRAC photometry is capable of detecting 4000 disks at T = 260 K (equivalent ) around the Tuc-Hor members observed, no convincing mid-IR excesses were detected.
For completeness, we note that the fraction of disk luminosity to stellar luminosity ( = ) has been observed to fall off as (Spangler et al., 2001). The disk fractional luminosity is predicted to follow if the observed amount of dust is proportional to the collision frequency of large particles, and P-R drag is the dominant dust removal mechanism. Recently, Dominik & Decin (2003) argue that for the very luminous debris disks that have been detected so far, the collision timescales are much shorter than the P-R drag timescales, all the way down to the blow-out grain size. For this collision-dominated scenario, Dominik & Decin (2003) predict that the dust luminosity evolves as . While these models ignore effects like, e.g., gravitational perturbations, or ejections, of dust-producing planetesimals by planets (which likely had an enormous effect on the early evolution of the asteroid belt in our solar system), they provide simple, physically plausible models with which to compare observations.
If one takes the solar system zodiacal dust disk (, at log()= 9.66), and scale it backward in time according to Spangler et al’s relation () or the theoretical P-R drag-dominated evolution (), one would predict at age 30 Myr zodiacal dust disks with (6900 ) or (23000 ), respectively. Hence, for the simple model of collisionally replenished, P-R-drag-depleted disks, we should have easily detected the solar system’s zodiacal dust disk at age 30 Myr. For the empirical relation (Spangler et al., 2001), we could have detected the Sun’s zody disk around most (13/15) of the 30-Myr-old Tuc-Hor (catalog T-HA) stars in our sample. Backward extrapolation of the Sun’s zodiacal dust disk luminosity using Dominik & Decin’s relation for collisionally-dominated disks would yield (150 ). Such a disk would not have been detectable in our survey, consistent with our null result. If analogs of the Sun’s zodiacal dust disk are common around 30-Myr-old stars, must evolve as a shallower power law (1.65) than either Spangler et al.’s empirical relation or the P-R-drag-dominated dust depletion model.
5 DISCUSSION
In Fig. 3, we plot the incidence of -band excess versus stellar age for samples of low-mass stars. While 80% of 1-Myr-old stars have in Taurus have -band excesses (Kenyon & Hartmann, 1995), only 10% of 10-Myr-old stars in the TW Hya Association (catalog TWA) and Pic Moving Group (catalog bPMG) show comparable excess emission (Jayawardhana et al., 1999; Weinberger et al., 2003a, b). Of these 10-Myr-old stars, only a few are known to have optically-thick disks (TW Hya (catalog ), Hen 3-600 (catalog )), while the others are optically-thin disks. Our survey imaged a small number (N = 5) of Upper Sco (catalog ) members (5-Myr-old) as well, among which two have clear -band excesses. By an age of 30 Myr, we find that -band excesses due to optically-thick or optically-thick disks, are rare (7%). Excluding the 10-Myr-old star Pic (catalog bet Pic), Aumann & Probst (1991) find only one star ( Lep (catalog zet Lep)) among a sample of 548 field AFGK stars (0.2%) with a convincing 12µm excess. These results seem to imply that dust appears to be efficiently removed from 5-10 AU of young stars on timescales similar to that of the cessation of accretion. While accretion terminates over a wide range of ages (1-10 Myr; Haisch, Lada, & Lada, 2001a; Hillenbrand et al., 2004), the duration of the transition from optically-thick to optically-thin has been observed to be remarkably short (105 yr; Skrutskie et al., 1990; Wolk & Walter, 1996).
Gravitational perturbations of small planetesimals (0.1-100 km radius) by growing planetary embryos (2000 km radius) can theoretically cause collisional cascades of dust grains that produce observable mid-IR signatures (Kenyon & Bromley, 2004). Simulations show that when the largest planetary embryos reach radii of 3000 km, the population of dust-producing 0.1-100 km-size planetesimals in the planet-forming zone becomes collisionally depleted, and -band excesses become undetectable. The timescale over which the -band excess would be detectable during this phase of terrestrial planet formation is of order 1 Myr. With a larger sample size (e.g. FEPS Spitzer Legacy survey), one might be able to probe whether this is occurring around stars at age 30 Myr. With 10% of 10 Myr-old stars having detectable -band excesses (Jayawardhana et al., 1999; Weinberger et al., 2003a, b), we may be witnessing the signature from runaway protoplanet growth in the terrestrial planet zone (Kenyon & Bromley, 2004). This would agree with the isotopic evidence in our own solar system that Moon- to Mars-sized protoplanetary embryos accreted within the first 10-20 Myr (Kleine et al., 2002; Kleine, Mezger, & Münker, 2003), ultimately leading to the formation of the Earth-Moon system.
6 CONCLUSIONS
We have undertaken a mid-IR survey of 14 young stars in the nearby 30-Myr-old Tuc-Hor Association (catalog T-HA) in order to search for emission from warm circumstellar disks. No excess emission at 10 µm was detected around any Tuc-Hor (catalog T-HA) members. If optically-thick disks do exist around these stars, their inner holes must be large (range: 0.2-5.8 AU). Combining our photometric results with optically-thin dust disk models, we place the following physical constraints on dust orbiting within 10 AU of these 30-Myr-old stars: fractional disk luminosities of 10-2.9 and dust emitting surface areas 4000 that of the inner solar system zodiacal dust. The disk masses of micron-size dust grains with orbital radii between the silicate dust sublimation point and 10 AU must be less than . The photometric upper limits also suggest that the upper limit on the surface density of micron-sized grains is 10-7 g cm-2. These results imply that inner disks dissipate on timescales comparable to the cessation of accretion.
Appendix A Appendix: MIRAC Photometric Calibration
With a significant body of MIRAC-BLINC observations acquired during the 2001-2003 observing runs at Magellan I, it was decided to calculate the photometric attributes of commonly used MIRAC bands on the Cohen-Walker-Witteborn (CWW) system of absolute infrared calibration (e.g. Cohen, Wheaton, & Megeath, 2003, and references therein). The photometric standard system for previously published MIRAC studies is given in Appendix 2 of the MIRAC3 User’s Manual (Hoffmann & Hora, 1999).
Relative spectral responses (RSRs) for each combination of filter and window were constructed. The throughput chain consists of the following groups of components: atmosphere, telescope optics, BLINC optics, MIRAC optics, and MIRAC detector. The complete throughput equation consists of the following components multiplied together: atmosphere, 3 aluminum mirrors (Magellan), dewar window (KRS-5 or KBr), KBr lens (in BLINC), 5 gold mirrors (3 in BLINC, 2 in MIRAC), filter, and the Si:As array. Most of the MIRAC observations were taken in just four of the seventeen filters currently available in the three MIRAC filter wheels: , , , and , and these were the filters we absolutely calibrated. For each MIRAC filter, we list a manufacturer’s name, mean filter wavelength (), bandwidth (; defined as the FWHM of the normalized transmission curve divided by the mean wavelength), and the temperature at which the filter profile was measured (or extrapolated). The transmission profiles for the filters are plotted in Fig. 4. While we list mean filter wavelengths () in this discussion, the isophotal wavelengths () are given in Table 8.
The filter (OCLI “Astro L”; = 3.84µm; = 16.2%; 77 K) is the same one used in all previous and current MIRAC L-band observations, and the transmission curve is plotted in Fig. A2.2 of Hora (1991). The filter (OCLI code W10773-8; = 10.75 µm; = 47.2%; Ambient) was purchased in 1994 in preparation for comet Shoemaker-Levy-9 observations, and has been in use ever since. Pre-1994 MIRAC observations employed a slightly bluer wideband filter whose characteristics we only present here for completeness (OCLI code W10575-9; = 10.58 µm; = 45.8%; Ambient). The narrow 11.6 µm filter (OCLI “Astronomy R”; = 11.62 µm; = 9.5%; extrapolated to 5 K) has been used since MIRAC was commissioned (Hora, 1991). Its transmission curve includes the effects of a BaF2 blocker, and it is the only filter of the four that we were able to linearly extrapolate its transmission characteristics to the detector’s operating temperature (5 K; data at Ambient and 77 K were available). The or “Q-short” filter has also been used for the lifetime of MIRAC, and its characteristics are only currently known at ambient temperature: µm; %).
We followed Cohen et al. (1999) in using PLEXUS (Clark, 1996) to assess mean, site-specific atmospheric transmission. Transmission curves for KRS-5 and KBr were taken from the Infrared Handbook (Wolfe & Zissis, 1985). We used a KRS-5 window during the August 2001 and May 2002 runs, and a KBr window for the August 2002 and March 2003 runs. The reflectivities of the gold and aluminum mirrors were assumed to be flat in the wavelength range of interest (2-20 µm). The quantum efficiency for the MIRAC doped-silicon blocked-impurity-band (BIB) array was taken from Stapelbroek et al. (1995), following Hoffmann et al. (1998). The zero magnitude attributes of the MIRAC filter systems are given in Table 8. Standard star fluxes on the CWW system for the four primary MIRAC filters (with the KRS-5 dewar window) are given in Table 9. When the KBr dewar window is used on MIRAC-BLINC, the standard star fluxes are nearly identical (to within 7% of the quoted flux uncertainties), so the same fluxes and magnitudes can be safely adopted. The flux densities in Tables 4 and 5 are referenced to this system.
Appendix B Appendix: Comments on Individual Sources
The only young stars in our survey to show a significant -band excess were the T Tauri stars HD 143006 (catalog ) and [PZ99] J161411.0-230536 (catalog ), both members of the 5-Myr-old Upper Sco (catalog ) OB subgroup. Both stars are targets in the FEPS Spitzer Legacy Science program, but only HD 143006 (catalog ) was previously known to possess a circumstellar disk. Both were detected by IRAS, and the MIRAC -band fluxes are consistent with the color-corrected 12 µm measurements in the IRAS FSC (Moshir et al., 1990). Here we discuss these stars in more detail.
B.1 [PZ99] J161411.0-230536
J161411 (catalog PZ99 J161411.0-230536) is a K0-type weak-lined T Tauri (EW(H) = 0.96Å) star discovered by Preibisch et al. (1998). In a spectroscopic survey to identify new members of Upper Sco (catalog ) (Mamajek, Meyer, & Liebert, in prep.), the authors obtained a red, low-resolution spectrum of J161411 (catalog PZ99 J161411.0-230536) in July 2000, which shows an asymmetric H feature with blueshifted emission and redshifted absorption (net EW(H) = 0.36Å). We confirm the strong lithium absorption (EW(Li 6707) = 0.45 Å) observed by Preibisch et al. (1998). The UCAC2 proper motion (Zacharias et al., 2003) for J161411 (catalog PZ99 J161411.0-230536) is consistent with membership in the Upper Sco (catalog ) subgroup. The color (= 2.1) is similar to that of classical T Tauri stars in Taurus-Auriga (catalog ) (Kenyon & Hartmann, 1995). The photometric and spectroscopic evidence suggest that this 5-Myr-old, 1 M⊙ star is actively accreting from a circumstellar disk.
B.2 HD 143006
HD 143006 (catalog ) is a G5Ve (Henize, 1976) T Tauri star with strong Li absorption (EW(Li 6707) = 0.24Å; Dunkin, Barlow, & Ryan, 1997). The star is situated in the middle of the Upper Sco (catalog ) OB association, and its proper motion (, = -11, -20 mas/yr; Zacharias et al., 2003) and radial velocity (-0.9 km/s; Dunkin, Barlow, & Ryan, 1997) are indistinguishable from other association members (de Bruijne, 1999). Several studies have classified HD 143006 as a distant G-type supergiant or “pre-planetary nebula” (Carballo, Wesselius, & Whittet, 1992; Kohoutek, 2001), however we believe this is erroneous. If HD 143006 (catalog ) were indeed a supergiant at = 3.4 kpc (Pottasch & Parthasarathy, 1988), its tangential velocity would be 370 km/s – extraordinarily fast for a population I star. The MIRAC and photometry agrees well with the data points in the SED for HD 143006 (catalog ) plotted in Fig. 2 of Sylvester, Skinner, Barlow, & Mannings (1996). The spectral energy distribution for HD 143006 (catalog ) and its optically-thick disk is well-studied from 0.4-1300 µm, so we do not discuss this object further.
References
- Adams, Lada, & Shu (1987) Adams, F. C., Lada, C. J., & Shu, F. H. 1987, ApJ, 312, 788
- Agnor, Canup, & Levison (1999) Agnor, C. B., Canup, R. M., & Levison, H. F. 1999, Icarus, 142, 219
- Artymowicz (1988) Artymowicz, P. 1988, ApJ, 335, L79
- Aumann & Probst (1991) Aumann, H. H. & Probst, R. G. 1991, ApJ, 368, 264
- Backman & Paresce (1993) Backman, D. E. & Paresce, F. 1993, Protostars and Planets III, 1253
- Beckwith (1999) Beckwith, S. V. W. 1999, NATO ASIC Proc. 540: The Origin of Stars and Planetary Systems, 579
- Beckwith et al. (1990) Beckwith, S. V. W., Sargent, A. I., Chini, R. S., & Guesten, R. 1990, AJ, 99, 924
- Beichman et al. (1988) Beichman, C. A., Neugebauer, G., Habing, H. J., Clegg, P. E., & Chester, T. J. 1988, NASA RP-1190, Vol. 1
- Bessell & Brett (1988) Bessell, M. S. & Brett, J. M. 1988, PASP, 100, 1134
- Briceño et al. (1997) Briceño, C., Hartmann, L. W., Stauffer, J. R., Gagne, M., Stern, R. A., & Caillault, J. 1997, AJ, 113, 740
- Briggs (1962) Briggs, R. E. 1962, AJ, 67, 710
- Burns, Lamy, & Soter (1979) Burns, J. A., Lamy, P. L., & Soter, S. 1979, Icarus, 40, 1
- Carballo, Wesselius, & Whittet (1992) Carballo, R., Wesselius, P. R., & Whittet, D. C. B. 1992, A&A, 262, 106
- Carpenter (2001) Carpenter, J. M. 2001, AJ, 121, 2851
- Chambers (2001) Chambers, J. E. 2001, Icarus, 152, 205
- Chen & Jura (2001) Chen, C. H. & Jura, M. 2001, ApJ, 560, L171
- Chiang & Goldreich (1997) Chiang, E. I. & Goldreich, P. 1997, ApJ, 490, 368
- Clark (1996) Clark, F. O. 1996, PLEXUS Version 2.1a, CD-ROM (Hanscom AFB, MA: Phillips Lab., Dir. Geophys., Air Force Mater. Command).
- Cohen et al. (2003) Cohen, M., Megeath, S. T., Hammersley, P. L., Martín-Luis, F., & Stauffer, J. 2003, AJ, 125, 2645
- Cohen et al. (1987) Cohen, M., Schwartz, D. E., Chokshi, A., & Walker, R. G. 1987, AJ, 93, 1199
- Cohen et al. (1992) Cohen, M., Walker, R. G., Barlow, M. J., & Deacon, J. R. 1992, AJ, 104, 1650
- Cohen et al. (1999) Cohen, M., Walker, R. G., Carter, B., Hammersley, P., Kidger, M., & Noguchi, K. 1999, AJ, 117, 1864
- Cohen, Wheaton, & Megeath (2003) Cohen, M., Wheaton, W. A., & Megeath, S. T. 2003, AJ, 126, 10
- Cutispoto et al. (2002) Cutispoto, G., Pastori, L., Pasquini, L., de Medeiros, J. R., Tagliaferri, G., & Andersen, J. 2002, A&A, 384, 491
- Cutri et al. (2003) Cutri, R. M. et al. 2003, 2MASS All-Sky Catalog of Point Sources, VizieR Online Data Catalog, 2246, 0
- de Bruijne (1999) de Bruijne, J. H. J. 1999, MNRAS, 306, 381
- Dohnanyi (1969) Dohnanyi, J. W. 1969, J. Geophys. Res., 74, 2531
- Dominik & Decin (2003) Dominik, C. & Decin, G. 2003, ApJ, 598, 626
- ESA (1997) ESA 1997, The Hipparcos and Tycho Catalogues, VizieR Online Data Catalog, 1239, 0
- Dunkin, Barlow, & Ryan (1997) Dunkin, S. K., Barlow, M. J., & Ryan, S. G. 1997, MNRAS, 290, 165
- Fajardo-Acosta, Beichman, & Cutri (2000) Fajardo-Acosta, S. B., Beichman, C. A., & Cutri, R. M. 2000, ApJ, 538, L155
- Fixsen & Dwek (2002) Fixsen, D. J. & Dwek, E. 2002, ApJ, 578, 1009
- Gaidos (1999) Gaidos, E. J. 1999, ApJ, 510, L131
- Ghez, Neugebauer, & Matthews (1993) Ghez, A. M., Neugebauer, G., & Matthews, K. 1993, AJ, 106, 2005
- Golay (1974) Golay, M. 1974, Astrophysics and Space Science Library, 41
- Greenberg & Nolan (1989) Greenberg, R. & Nolan, M. C. 1989, Asteroids II, 778
- Grün et al. (1985) Grün, E., Zook, H. A., Fechtig, H., & Giese, R. H. 1985, Icarus, 62, 244
- Habing et al. (2001) Habing, H. J. et al. 2001, A&A, 365, 545
- Haisch, Lada, & Lada (2001a) Haisch, K. E., Lada, E. A., & Lada, C. J. 2001a, ApJ, 553, L153
- Haisch, Lada, & Lada (2001b) Haisch, K. E., Lada, E. A., & Lada, C. J. 2001b, AJ, 121, 2065
- Harper, Loewenstein, & Davidson (1984) Harper, D. A., Loewenstein, R. F., & Davidson, J. A. 1984, ApJ, 285, 808
- Hartmann & Davis (1975) Hartmann, W. K. & Davis, D. R. 1975, Icarus, 24, 504
- Hawley, Gizis, & Reid (1996) Hawley, S. L., Gizis, J. E., & Reid, I. N. 1996, AJ, 112, 2799
- Henize (1976) Henize, K. G. 1976, ApJS, 30, 491
- Hillenbrand et al. (2004) Hillenbrand, L. A., et al. 2004, in prep
- Hillenbrand et al. (1998) Hillenbrand, L. A., Strom, S. E., Calvet, N., Merrill, K. M., Gatley, I., Makidon, R. B., Meyer, M. R., & Skrutskie, M. F. 1998, AJ, 116, 1816
- Hinz et al. (2000) Hinz, P. M., Angel, J. R. P., Woolf, N. J., Hoffmann, W. F., & McCarthy, D. W. 2000, Proc. SPIE, 4006, 349
- Hoffmann et al. (1998) Hoffmann, W. F., Hora, J. L., Fazio, G. G., Deutsch, L. K., & Dayal, A. 1998, Proc. SPIE, 3354, 647
- Hoffmann & Hora (1999) Hoffmann, W. F. & Hora, J. L. 1999, MIRAC3 User’s Manual
- Høg et al. (2000) Høg, E. et al. 2000, A&A, 355, L27
- Hora (1991) Hora, J. L. 1991, Ph.D. Thesis, The University of Arizona
- IPAC (1986) IPAC, 1986, IRAS Point Source Catalog
- Jayawardhana et al. (1999) Jayawardhana, R., Hartmann, L., Fazio, G., Fisher, R. S., Telesco, C. M., & Piña, R. K. 1999, ApJ, 521, L129
- Kelsall et al. (1998) Kelsall, T. et al. 1998, ApJ, 508, 44
- Kenyon & Bromley (2004) Kenyon, S. J. & Bromley, B. C. 2004, ApJ, 602, L133
- Kenyon & Hartmann (1995) Kenyon, S. J. & Hartmann, L. 1995, ApJS, 101, 117
- Kleine, Mezger, & Münker (2003) Kleine, T., Mezger, K., & Münker, C. 2003, Meteoritics & Planetary Science, vol. 38, Supplement, abstract no.5212, 38, 5212
- Kleine et al. (2002) Kleine, T., Münker, C., Mezger, K., & Palme, H. 2002, Nature, 418, 952
- Kleinmann et al. (1986) Kleinmann, S. G., Cutri, R. M., Young, E. T., Low, F. J., & Gillett, F. C. 1986, IRAS Serendipitous Survey Catalog, Tucson, Univ. of Arizona
- Kohoutek (2001) Kohoutek, L. 2001, A&A, 378, 843
- Lagrange, Backman, & Artymowicz (2000) Lagrange, A.-M., Backman, D. E., & Artymowicz, P. 2000, Protostars and Planets IV, 639
- Lawson et al. (2002) Lawson, W. A., Crause, L. A., Mamajek, E. E., & Feigelson, E. D. 2002, MNRAS, 329, L29
- Lawson, Lyo, & Muzerolle (2004) Lawson, W. A., Lyo, A.-R., & Muzerolle, J., 2004, MNRAS, in press
- Lyo et al. (2003) Lyo, A.-R., Lawson, W. A., Mamajek, E. E., Feigelson, E. D., Sung, E., & Crause, L. A. 2003, MNRAS, 338, 616
- Mamajek, Meyer, & Liebert (2002) Mamajek, E. E., Meyer, M. R., & Liebert, J. 2002, AJ, 124, 1670
- Marcy & Butler (2000) Marcy, G. W. & Butler, R. P. 2000, PASP, 112, 137
- Mathioudakis & Doyle (1993) Mathioudakis, M. & Doyle, J. G. 1993, A&A, 280, 181
- Mathis, Rumpl, & Nordsieck (1977) Mathis, J. S., Rumpl, W., & Nordsieck, K. H. 1977, ApJ, 217, 425
- McCaughrean & O’Dell (1996) McCaughrean, M. J. & O’Dell, C. R. 1996, AJ, 111, 1977
- Metchev, Hillenbrand, & Meyer (2004) Metchev, S. A., Hillenbrand, L. A., & Meyer, M. R. 2004, ApJ, 600, 435
- Meyer et al. (2004) Meyer, M. R. et al., 2004, ApJS, submitted
- Meyer et al. (2002) Meyer, M. R. et al. 2002, The Origins of Stars and Planets: The VLT View. Proceedings of the ESO Workshop held in Garching, Germany, 24-27 April 2001, p. 463.
- Moshir et al. (1990) Moshir, M. & et al. 1990, IRAS Faint Source Catalogue, version 2.0
- Mukai & Yamamoto (1982) Mukai, T. & Yamamoto, T. 1982, A&A, 107, 97
- Muzerolle et al. (2000) Muzerolle, J., Calvet, N., Briceño, C., Hartmann, L., & Hillenbrand, L. 2000, ApJ, 535, L47
- Muzerolle et al. (2003) Muzerolle, J., Calvet, N., Hartmann, L., & D’Alessio, P. 2003, ApJ, 597, L149
- Nelson et al. (1986) Nelson, G. J., Robinson, R. D., Slee, O. B., Ashley, M. C. B., Hyland, A. R., Tuohy, I. R., Nikoloff, I., & Vaughan, A. E. 1986, MNRAS, 220, 91
- Pottasch & Parthasarathy (1988) Pottasch, S. R. & Parthasarathy, M. 1988, A&A, 192, 182
- Preibisch et al. (1998) Preibisch, T., Guenther, E., Zinnecker, H., Sterzik, M., Frink, S., & Roeser, S. 1998, A&A, 333, 619
- Preibisch & Zinnecker (1999) Preibisch, T. & Zinnecker, H. 1999, AJ, 117, 2381
- Probst (1983) Probst, R. G. 1983, ApJS, 53, 335
- Randich et al. (2001) Randich, S., Pallavicini, R., Meola, G., Stauffer, J. R., & Balachandran, S. C. 2001, A&A, 372, 862
- Reach et al. (2003) Reach, W. T., Morris, P., Boulanger, F., & Okumura, K. 2003, Icarus, 164, 384
- Reid, Kilkenny, & Cruz (2002) Reid, I. N., Kilkenny, D., & Cruz, K. L. 2002, AJ, 123, 2822
- Siess, Dufour, & Forestini (2000) Siess, L., Dufour, E., & Forestini, M. 2000, A&A, 358, 593
- Siess, Forestini, & Dougados (1997) Siess, L., Forestini, M., & Dougados, C. 1997, A&A, 324, 556
- Silverstone (2000) Silverstone, M. D. 2000, Ph.D. Thesis, UCLA
- Skrutskie et al. (1990) Skrutskie, M. F., Dutkevitch, D., Strom, S. E., Edwards, S., Strom, K. M., & Shure, M. A. 1990, AJ, 99, 1187
- Soderblom et al. (1993) Soderblom, D. R., Jones, B. F., Balachandran, S., Stauffer, J. R., Duncan, D. K., Fedele, S. B., & Hudon, J. D. 1993, AJ, 106, 1059
- Song et al. (2002) Song, I., Weinberger, A. J., Becklin, E. E., Zuckerman, B., & Chen, C. 2002, AJ, 124, 514
- Song, Zuckerman, & Bessell (2003) Song, I., Zuckerman, B., & Bessell, M. S. 2003, ApJ, 599, 342
- Spangler et al. (2001) Spangler, C., Sargent, A. I., Silverstone, M. D., Becklin, E. E., & Zuckerman, B. 2001, ApJ, 555, 932
- Stapelbroek et al. (1995) Stapelbroek, M. G., Seib, D. H., Huffman, J. E., & Florence, R. A. 1995, Proc. SPIE, 2475, 41
- Stelzer & Neuhäuser (2001) Stelzer, B. & Neuhäuser, R. 2001, A&A, 372, 117
- Stevenson (1987) Stevenson, D. J. 1987, Annual Review of Earth and Planetary Sciences, 15, 271
- Sylvester, Skinner, Barlow, & Mannings (1996) Sylvester, R. J., Skinner, C. J., Barlow, M. J., & Mannings, V. 1996, MNRAS, 279, 915
- Torres et al. (2000) Torres, C. A. O., da Silva, L., Quast, G. R., de la Reza, R., & Jilinski, E. 2000, AJ, 120, 1410 (TDQ00)
- Torres et al. (2001) Torres, C. A. O., da Quast, G. R., de la Reza, R., da Silva, L., & Melo, C. H. F. 2001, ASP Conf. Ser. 244: Young Stars Near Earth, 43.
- Torres et al. (2003) Torres, C. A. O., Quast, G. R., de La Reza, R., da Silva, L., & Melo, C. H. F. 2003, ASP Conf. Ser. 287: Galactic Star Formation Across the Stellar Mass Spectrum, 439
- van der Bliek, Manfroid, & Bouchet (1996) van der Bliek, N. S., Manfroid, J., & Bouchet, P. 1996, A&AS, 119, 547
- Waters, Cote, & Aumann (1987) Waters, L. B. F. M., Cote, J., & Aumann, H. H. 1987, A&A, 172, 225
- Whittet (2003) Whittet, D. C. B. 2003, Dust in the Galactic Environment, 2nd ed., Bristol: Institute of Physics (IOP) Publishing, Series in Astronomy and Astrophysics
- Weinberger et al. (2003a) Weinberger, A. J., Becklin, E. E., Zuckerman, B., & Song, I. 2003, BAAS, 202, #34.01
- Weinberger et al. (2003b) Weinberger, A. J., Becklin, E. E., Zuckerman, B., & Song, I. 2003, BAAS, 203, #13.03
- Weidenschilling (1977) Weidenschilling, S. J. 1977, Ap&SS, 51, 153
- Wetherill & Stewart (1993) Wetherill, G. W. & Stewart, G. R. 1993, Icarus, 106, 190
- Wichmann, Schmitt, & Hubrig (2003) Wichmann, R., Schmitt, J. H. M. M., Hubrig, S., 2003, A&A, 399, 983
- Wolf & Hillenbrand (2003) Wolf, S. & Hillenbrand, L. A. 2003, ApJ, 596, 603
- Wolfe & Zissis (1985) Wolfe, W. L. & Zissis, G. J. 1985, Arlington: Office of Naval Research, Department of the Navy
- Wolk & Walter (1996) Wolk, S. J. & Walter, F. M. 1996, AJ, 111, 2066
- Wood et al. (2002) Wood, B. E., Müller, H., Zank, G. P., & Linsky, J. L. 2002, ApJ, 574, 412
- Zacharias et al. (2003) Zacharias, N., Urban, S. E., Zacharias, M. I., Wycoff, G. L., Hall, D. M., Germain, M. E., Holdenried, E. R., & Winter, L. 2003, VizieR Online Data Catalog, 1289, 0
- Zuckerman & Song (2004) Zuckerman, B., Song, I. 2004, ApJ, 603, 738
- Zuckerman et al. (2001) Zuckerman, B., Song, I., Bessell, M. S., & Webb, R. A. 2001, ApJ, 562, L87
- Zuckerman, Song, & Webb (2001) Zuckerman, B., Song, I., & Webb, R. A., 2001, ApJ, 559, 388 (ZSW01)
- Zuckerman & Webb (2000) Zuckerman, B. & Webb, R. A., 2000, ApJ, 535, 959 (ZW00)


| (1) | (2) | (3) | (4) | (5) |
|---|---|---|---|---|
| Reference | Group | Age | Method | Notes |
| … | … | (Myr) | … | … |
| Zuckerman & Webb (2000) | Tuc | 40 | H Emission | Comparing H emission of 3 stars to Per members |
| Torres et al. (2000) | Hor | 30 | Theoretical Isochrones | Siess, Forestini, & Dougados (1997) tracks |
| Torres et al. (2001) | Tuc-Hor | 20 | Velocity Dispersion | “GAYA” = Tuc-Hor |
| Stelzer & Neuhäuser (2001) | Tuc | 10-30 | X-ray Emission | Member LX values similar to TWA, Tau-Aur, & IC 2602 |
| Zuckerman, Song, & Webb (2001) | Tuc | 10-40 | Theoretical Isochrones | K & M stars; Siess, Dufour, & Forestini (2000) tracks |
| (1) | (2) | (3) | (4) | (5) |
|---|---|---|---|---|
| UT | Star | Band | On-Source | Flux |
| Date | Name | … | Time (s) | Standards |
| 2001 Aug 8 | HIP 105388 | 300 | Cet, CMa | |
| HIP 105404 | 600 | Cet, CMa | ||
| HIP 107947 | 600 | Cet, CMa | ||
| HIP 108195 | 360 | Cet, CMa | ||
| HIP 116748AB | 600 | Cet, CMa | ||
| HIP 1481 | 480 | Cet, CMa | ||
| HIP 1910 | 840 | Cet, CMa | ||
| HIP 2729 | 840 | Cet, CMa | ||
| 2001 Aug 9 | HIP 490 | 420 | Cet, Sgr, CMa | |
| HIP 6485 | 600 | Cet, Sgr, CMa | ||
| HIP 6856 | 660 | Cet, Sgr, CMa | ||
| HIP 9892 | 840 | Cet, Sgr, CMa | ||
| ERX 37N | 1020 | Cet, Sgr, CMa | ||
| 2001 Aug 10 | HIP 9685 | 690 | Cen, Cet, Sgr | |
| 2002 Aug 21 | HIP 1910 | 180 | Cru, Sgr, Cet |
| (1) | (2) | (3) | (4) | (5) |
|---|---|---|---|---|
| UT | Star | Band | On-Source | Flux |
| Date | Name | … | Time (s) | Standards |
| 2001 Aug 6 | GJ 799 AB | 11.6 | 135 | Cet |
| GJ 803 | 11.6 | 165 | Cet | |
| HIP 108195 | 11.6 | 60 | Cet | |
| 2001 Aug 7 | HIP 99273 | 11.6 | 255 | Car, PsA, Cru |
| 2001 Aug 8 | HD 143006 | 60 | Cet, CMa | |
| HD 143006 | 11.6 | 120 | Cru | |
| J161318.6-221248 | 600 | Cet, CMa | ||
| HD 181327 | 240 | Cet, CMa | ||
| HR 7329 | 60 | Cet, CMa | ||
| 2001 Aug 9 | RX J1853.1-3609 | 960 | Cet, Sgr, CMa | |
| RX J1917.4-3756 | 660 | Cet, Sgr, CMa | ||
| 2001 Aug 10 | HIP 63797 | 300 | Cen, Cet, Sgr | |
| J161411.0-230536 | 360 | Cen, Cet, Sgr | ||
| ScoPMS 214 | 450 | Cen, Cet, Sgr | ||
| ScoPMS 5 | 450 | Cen, Cet, Sgr | ||
| HIP 95149 | 360 | Cen, Cet, Sgr | ||
| HIP 113579 | 510 | Cen, Cet, Sgr | ||
| HIP 1134 | 480 | Cen, Cet, Sgr | ||
| 2002 Aug 21 | HIP 93815 | 180 | Cru, Sgr, Cet | |
| HIP 99803 A | 690 | Cru, Sgr, Cet | ||
| HIP 99803 B | 165 | Cru, Sgr, Cet | ||
| HIP 105441 | 360 | Cru, Sgr, Cet | ||
| HIP 107649 | 240 | Cru, Sgr, Cet | ||
| PPM 366328 | 180 | Cru, Sgr, Cet | ||
| HIP 108809 | 360 | Cru, Sgr, Cet | ||
| HIP 108422 | 300 | Cru, Sgr, Cet | ||
| GJ 879 | 240 | Cru, Sgr, Cet |
| (1) | (2) | (3) | (4) | (5) | (6) | (7) | (8) |
|---|---|---|---|---|---|---|---|
| Name | Name | Spec. | Pred. Fν | Meas. Fν | E(N) | Dev. | |
| … | … | Type | (mag) | (mJy) | (mJy) | (mJy) | () |
| HIP 490 | HD 105 | G0 | 6.12 0.02 | 139 | 138 8 | –1 8 | –0.2 |
| HIP 1481 | HD 1466 | F8 | 6.15 0.02 | 135 | 151 20 | +16 20 | +0.8 |
| HIP 1910 | BPM 1699 | M0 | 7.49 0.02 | 51 | 49 7 | –2 7 | –0.3 |
| HIP 2729 | HD 3221 | K4 | 6.53 0.02 | 111 | 102 5 | –9 5 | –1.7 |
| HIP 6485 | HD 8558 | G6 | 6.85 0.03 | 71 | 82 4 | +11 4 | +2.4 |
| HIP 6856 | HD 9054 | K2 | 6.83 0.02 | 72 | 85 4 | +13 4 | +3.0 |
| HIP 9685 | HD 12894 | F4 | 5.45 0.02 | 258 | 207 17 | –51 18 | –2.9 |
| HIP 9892 | HD 13183 | G5 | 6.89 0.02 | 68 | 67 6 | –1 6 | –0.2 |
| ERX 37N | AF Hor | M3 | 7.64 0.03 | 42 | 46 3 | +4 3 | +1.3 |
| HIP 105388 | HD 202917 | G5 | 6.91 0.02 | 67 | 65 9 | –2 9 | –0.3 |
| HIP 105404 | HD 202947 | K0 | 6.57 0.02 | 92 | 74 9 | –18 9 | –1.9 |
| HIP 107947 | HD 207575 | F6 | 6.03 0.02 | 151 | 155 12 | +4 12 | +0.3 |
| HIP 108195 | HD 207964 | F3 | 4.91 0.02 | 424 | 394 20aaHIP 108195 was also imaged at 11.6µm with a flux of 284 40 mJy. | –30 21 | –1.4 |
| HIP 116748A | HD 222259A | G6 | 6.68 0.03 | 83 | 75 12 | –8 12 | –0.7 |
| HIP 116748B | HD 222259B | K | 7.03 0.06 | 60 | 53 14 | –7 14 | –0.5 |
Note. — Columns (1) Hipparcos name, (2) other name, (3) spectral type, from either ZW00, TDQ00, or ZSW01, (4) magnitude from 2MASS (Cutri et al., 2003), (5) measured MIRAC -band flux, (6) predicted photospheric flux, (7) flux excess and uncertainty, (8) residual deviation = . ERX 37N is given in SIMBAD as [TDQ2000] ERX 37N. Predicted -band photospheric fluxes use or assume: 2MASS magnitudes, = 0, dwarf color relations from §3, and zero magnitude flux of 37.25 Jy for -band.
| (1) | (2) | (3) | (4) | (5) | (6) | (7) | (8) | (9) |
|---|---|---|---|---|---|---|---|---|
| Name | Name | Spec. | Ks | Band | Pred. Fν | Meas. Fν | E(N) | Dev. |
| … | … | Type | (mag) | … | (mJy) | (mJy) | (mJy) | () |
| Tuc-Hor Rejects | ||||||||
| HD 177171 | HIP 93815 | F7 | 3.81 0.10aaStar is saturated in 2MASS. We adopt the V magnitude from Hipparcos (ESA, 1997), and the intrinsic and color for F7 stars from Kenyon & Hartmann (1995) (converted to 2MASS system via Carpenter 2001), to calculate a rough magnitude. We assume an uncertainty of 0.10 mag. | 1171 | 1236 103 | +65 149 | +0.4 | |
| HD 191869 AbbZuckerman et al. (2001) calls the pair HIP 99803 NE and SW. A = SE and B = NW. | HIP 99803 A | F7 | 6.81 0.02 | 74 | 87 9 | +13 9 | +1.5 | |
| HD 191869 BbbZuckerman et al. (2001) calls the pair HIP 99803 NE and SW. A = SE and B = NW. | HIP 99803 B | 6.86 0.03 | 70 | 63 14 | –7 14 | –0.5 | ||
| HD 202746 | HIP 105441 | K2 | 6.40 0.02 | 107 | 116 11 | +9 11 | +0.8 | |
| HD 207129 | HIP 107649 | G0 | 4.12 0.02cc2MASS photometry is saturated. We take the magnitude from Aumann & Probst (1991) and transform it to the 2MASS system via equation (12) of Carpenter (2001). | 880 | 837 70 | –43 72 | –0.6 | |
| PPM 366328 | TYC 9129-1361-1 | K0 | 7.61 0.02 | 35 | 63 24 | +28 24 | +1.1 | |
| HD 208233ddWe can not rule out HIP 108422 as a Tuc-Hor member based on its proper motion, or the agreement between the calculated cluster parallax and Hipparcos trigonometric parallax. However, we conservatively exclude the star as a member at present, since no spectroscopic evidence of youth has been presented in the literature. If it is co-moving with the Tucana nucleus, we predict a RV of +3 km s-1. | HIP 108422 | G8 | 6.75 0.02 | 78 | 89 14 | +11 14 | +0.8 | |
| Upper Sco Members + FEPS | ||||||||
| J161411.0-230536 | TYC 6793-819-1 | K0 | 7.46 0.03 | 48 | 273 11 | +225 11 | +20.3 | |
| ScoPMS 214 | NTTS 162649-2145 | K0 | 7.76 0.02 | 42 | 37 5 | –5 5 | –1.0 | |
| ScoPMS 5 | HD 142361 | G3 | 7.03 0.02eeA 0.8” binary discovered by Ghez, Neugebauer, & Matthews (1993) and seen in MIRAC K-band images. MIRAC and 2MASS magnitudes are for unresolved pair. | 60 | 58 6 | –2 6 | –0.4 | |
| HD 143006 | HBC 608 | G6/8 | 7.05 0.03 | 134 | 648 31 | +514 31 | +16.5 | |
| HD 143006 | HBC 608 | G6/8 | 7.05 0.03 | 11.6 | 104 | 640 34 | +536 34 | +15.7 |
| J161318.6-221248 | TYC 6213-306-1 | G9 | 7.43 0.02 | 45 | 32 6 | –13 6 | –2.2 | |
| Pic Group Members | ||||||||
| GJ 799 A | HIP 102141 A | M4.5 | 5.70 0.10ffThe 2MASS magnitudes from Reid, Kilkenny, & Cruz (2002) appear to be at odds with the combined magnitude for A & B measured by Cutri et al. (2003), Nelson et al. (1986), and Probst (1983). The system is essentially an equal brightness binary at optical bands as well as at N, so we split the 2MASS magnitude evenly and adopt a generous 0.10 mag error. Spectral types are from Hawley, Gizis, & Reid (1996) | 11.6 | 202 | 259 24 | +57 30 | +1.9 |
| GJ 799 B | HIP 102141 B | M4 | 5.70 0.10ffThe 2MASS magnitudes from Reid, Kilkenny, & Cruz (2002) appear to be at odds with the combined magnitude for A & B measured by Cutri et al. (2003), Nelson et al. (1986), and Probst (1983). The system is essentially an equal brightness binary at optical bands as well as at N, so we split the 2MASS magnitude evenly and adopt a generous 0.10 mag error. Spectral types are from Hawley, Gizis, & Reid (1996) | 11.6 | 202 | 260 25 | +58 31 | +1.9 |
| GJ 803 | HIP 102409 | M0 | 4.53 0.02 | 11.6 | 627 | 608 32 | –19 34 | –0.6 |
| HD 181327 | HIP 95270 | F5/6 | 5.91 0.03 | 169 | 200 18 | +31 19 | +1.7 | |
| HR 7329 | HIP 95261 | A0 | 5.01 0.03 | 11.6 | 301 | 343 31 | +42 32 | +1.3 |
| HR 7329 | HIP 95261 | A0 | 5.01 0.03 | 387 | 466 52 | +79 53 | +1.5 | |
| CrA Off-Cloud Stars + FEPS | ||||||||
| RX J1853.1-3609 | HD 174656 | G6 | 7.28 0.02 | 48 | 46 4 | –2 4 | –0.4 | |
| RX J1917.4-3756 | SAO 211129 | K2 | 7.47 0.03 | 44 | 45 4 | +1 4 | +0.3 | |
| Sco-Cen Reject | ||||||||
| HD 113376ggRejected as a Sco-Cen member by Mamajek, Meyer, & Liebert (2002) | HIP 63797 | G3 | 6.70 0.02 | 81 | 83 9 | +2 9 | +0.2 | |
| Other FEPS Targets | ||||||||
| HD 181321 | HIP 95149 | G5 | 4.93 0.02 | 418 | 425 21 | +7 22 | +0.3 | |
| HD 191089 | HIP 99273 | F5 | 6.08 0.03 | 11.6 | 113 | 132 15 | +19 15 | +1.3 |
| HD 209253 | HIP 108809 | F6/7 | 5.39 0.02 | 273 | 255 21 | –18 22 | –0.8 | |
| HD 216803 | GJ 879 | K4 | 3.81 0.02cc2MASS photometry is saturated. We take the magnitude from Aumann & Probst (1991) and transform it to the 2MASS system via equation (12) of Carpenter (2001). | 1233 | 1027 85 | –206 88 | –2.3 | |
| HD 217343 | HIP 113579 | G3 | 5.94 0.03 | 164 | 160 8 | –4 9 | –0.4 | |
| HD 984 | HIP 1134 | F5 | 6.07 0.02 | 145 | 131 14 | –14 14 | –1.0 | |
.
Note. — (1) Hipparcos name, (2) other name, (3) spectral type (from SIMBAD unless otherwise noted) (4) magnitude from 2MASS (Cutri et al., 2003), unless otherwise noted, (5) measured MIRAC -band flux, (6) predicted photospheric flux, (7) flux excess and uncertainty, (8) residual deviation = .
| (1) | (2) | (3) | (4) | (5) | (6) | (7) | (8) | (9) | (10) | (11) |
|---|---|---|---|---|---|---|---|---|---|---|
| Name | log | log | rhole | Mdisk | log | Zodys | ||||
| … | (mas) | Teff | L/L⊙ | (AU) | (µm) | (AU) | (g cm-2) | (M⊕) | (Ld/L∗) | () |
| HIP 490 | 24.9 | 3.776 | +0.17 | 0.3 | 0.50 | 0.05-13.9 | 3.4E-06 | 7.8E-05 | -3.25 | 2.6E3 |
| HIP 1481 | 24.4 | 3.780 | +0.21 | 1.8 | 0.53 | 0.06-13.8 | 8.2E-06 | 1.9E-04 | -2.89 | 6.4E3 |
| HIP 1910 | 21.6 | 3.585 | –0.81 | 0.1 | 0.10 | 0.03-10.8 | 1.4E-05 | 1.9E-04 | -2.20 | 2.9E3 |
| HIP 2729 | 21.8 | 3.643 | –0.32 | 0.7 | 0.27 | 0.04-12.4 | 5.0E-06 | 9.2E-05 | -2.80 | 2.1E3 |
| HIP 6485 | 20.3 | 3.744 | –0.04 | 0.3 | 0.34 | 0.05-14.4 | 3.2E-06 | 7.7E-05 | -3.10 | 2.0E3 |
| HIP 6856 | 26.9 | 3.707 | –0.55 | 0.1 | 0.12 | 0.04-15.3 | 2.6E-06 | 7.1E-05 | -2.85 | 1.1E3 |
| HIP 9685 | 21.2 | 3.829 | +0.71 | 4.9 | 1.44 | 0.09-12.0 | 6.9E-06 | 1.2E-04 | -3.45 | 7.5E3 |
| HIP 9892 | 19.9 | 3.752 | –0.08 | 0.2 | 0.31 | 0.05-14.9 | 4.5E-06 | 1.2E-04 | -2.91 | 3.0E3 |
| ERX 37N | 22.6 | 3.540 | –0.89 | 0.1 | 0.14 | 0.02-8.6 | 8.3E-06 | 7.1E-05 | -2.48 | 1.2E3 |
| HIP 105388 | 21.8 | 3.746 | –0.16 | 0.2 | 0.26 | 0.05-15.3 | 5.4E-06 | 1.5E-04 | -2.75 | 3.6E3 |
| HIP 105404 | 21.7 | 3.719 | –0.21 | 0.2 | 0.26 | 0.04-14.6 | 6.4E-06 | 1.6E-04 | -2.68 | 3.8E3 |
| HIP 107947 | 22.2 | 3.795 | +0.38 | 2.1 | 0.75 | 0.06-13.0 | 6.3E-06 | 1.3E-04 | -3.16 | 4.8E3 |
| HIP 108195 | 21.5 | 3.817 | +0.91 | 7.9 | 2.40 | 0.11-11.7 | 1.0E-05 | 1.6E-04 | -3.53 | 8.6E3 |
| HIP 116748A | 21.6 | 3.746 | –0.09 | 1.0 | 0.31 | 0.05-14.8 | 8.0E-06 | 2.1E-04 | -2.65 | 5.0E3 |
| HIP 116748B | 21.6 | 3.645 | –0.46 | 0.2 | 0.19 | 0.04-13.0 | 1.4E-05 | 2.9E-04 | -2.24 | 5.8E3 |
Note. — (1) Star name. (2) Parallax. ERX 37N parallax calculated via cluster parallax method, the other values are from Hipparcos (ESA, 1997). (3) Stellar effective temperature. (4) Luminosity in solar units. (5) Lower limits on inner hole radius for a hypothetical optically-thick disk (§4.1). (6) Mean calculated grain size, where = 5/3, where is the blow-out grain size (Eqn. 1; §4.2). (7) Inner and outer radii for calculation of optically-thin disk (§4.2). (8) Disk surface mass density for optically-thin disk model (§4.2); independent of radius for our adopted model with (; ). (9) Upper limit on disk mass (in grains of size ) for optically-thin model (§4.2). (10) Upper limit to fractional luminosity of scaled-up zodiacal dust model (§4.3). (11) Upper limit to emitting area of scaled-up zodiacal dust model (in units of “zodys”, where 1 = 1021 cm2; §4.3).
| (1) | (2) | (3) | (4) | (5) | (6) |
|---|---|---|---|---|---|
| Parameter | rin | rout | Notes | ||
| = 2 | (1.00-1.17) | (1.4-2.3) | /(1.3-0.26) | (1.5-21) | crystalline case |
| = 1 | /(1.00-1.16) | /(1.4-2.3) | (1.2-0.24) | /(1.6-22) | amorphous case |
| = 0 | /(1.01-1.74) | /(2.7-12) | (1.5-0.013) | /(4.7-10700) | blackbody case |
| /(1.01-1.73) | /(1.6-4.4) | (9.5-0.32) | (3.8-0.017) | ||
| /(1.01-1.75) | /(1.6-7.1) | (95-2.7) | (38-0.054) | ||
| = 0.34 | no change | no change | (1.3-0.6) | /(1.5-2.8) | zodiacal case |
| = 1 | no change | no change | (1.3-0.17) | /(4.7-26) | |
| = 1.5 | no change | no change | /(1.1-21) | /(13-140) | min. mass solar nebula case |
Note. — Columns: (1) model parameter, (2-5) range of factors acted upon model values in Table 6 if parameter in column #1 is adopted, (6) case name.
| (1) | (2) | (3) | (4) | (5) | (6) | (7) | (8) |
|---|---|---|---|---|---|---|---|
| MIRAC | Bandwidth | In-Band | Fλ(iso) | Bandwidth | Fν(iso) | (iso) | |
| Band | (µm) | (µm) | (W cm-2) | (W cm-2 µm-1) | (Hz) | (Jy) | (Hz) |
| 3.844 | 0.5423 | 2.631E-15 | 4.852E-15 | 1.102E+13 | 238.8 | 7.793E+13 | |
| uncert. | 0.018 | 0.0037 | 1.609% | 8.469E-17 | 6.820E+10 | 4.1 | 7.361E+11 |
| 10.35 | 3.228 | 3.263E-16 | 1.011E-16 | 8.760E+12 | 37.25 | 2.946E+13 | |
| uncert. | 0.05 | 0.022 | 1.632% | 1.789E-18 | 4.170E+10 | 0.60 | 2.416E+11 |
| 11.57 | 0.8953 | 5.816E-17 | 6.496E-17 | 2.006E+12 | 29.00 | 2.592E+13 | |
| uncert. | 0.08 | 0.0135 | 2.110% | 1.686E-18 | 2.149E+10 | 0.61 | 2.827E+11 |
| 17.58 | 0.9130 | 1.123E-17 | 1.230E-17 | 8.834E+11 | 12.72 | 1.706E+13 | |
| uncert. | 0.14 | 0.0185 | 2.494% | 3.951E-19 | 1.263E+10 | 0.32 | 2.171E+11 |
Note. — Columns (1) name of MIRAC band, (2) isophotal wavelength, (3) wavelength bandwidth of RSR, (4) In-band flux for zero-magnitude star, (5) isophotal monochromatic intensity (wavelength units), (6) frequency bandwidth of RSR, (7) isophotal monochromatic intensity (frequency units), (8) isophotal frequency. Note that the stated quantities assume that a KRS-5 dewar window is used. If the KBr dewar window is used, the values are nearly identical. For KBr, every stated value is within 5% of the stated uncertainty for the , , and bands, and within 36% of the stated uncertainty for -band.
| (1) | (2) | (3) | (4) | (5) | (6) | (7) | (8) | (9) | (10) |
|---|---|---|---|---|---|---|---|---|---|
| HD | Alt. | Band | Mag | unc. | Fλ | unc. | Fν | unc. | unc. |
| Name | Name | … | … | … | (W cm-2 ) | (W cm-2 ) | (mJy) | (mJy) | (%) |
| 1522 | Cet | 0.800 | 0.022 | 2.32E-15 | 4.99E-17 | 1.14E+05 | 2.46E+03 | 2.15 | |
| 1522 | Cet | 0.807 | 0.021 | 4.81E-17 | 9.98E-19 | 1.77E+04 | 3.68E+02 | 2.08 | |
| 1522 | Cet | 0.772 | 0.026 | 3.19E-17 | 9.01E-19 | 1.42E+04 | 4.02E+02 | 2.83 | |
| 1522 | Cet | 0.775 | 0.030 | 6.02E-18 | 2.08E-19 | 6.23E+03 | 2.16E+02 | 3.46 | |
| 12929 | Ari | -0.762 | 0.021 | 9.79E-15 | 2.01E-16 | 4.82E+05 | 9.88E+03 | 2.05 | |
| 12929 | Ari | -0.754 | 0.020 | 2.02E-16 | 4.00E-18 | 7.46E+04 | 1.47E+03 | 1.98 | |
| 12929 | Ari | -0.789 | 0.025 | 1.34E-16 | 3.70E-18 | 6.00E+04 | 1.65E+03 | 2.75 | |
| 12929 | Ari | -0.787 | 0.030 | 2.54E-17 | 8.63E-19 | 2.62E+04 | 8.93E+02 | 3.40 | |
| 29139 | Tau | -3.045 | 0.021 | 8.01E-14 | 1.62E-15 | 3.94E+06 | 7.99E+04 | 2.03 | |
| 29139 | Tau | -3.013 | 0.020 | 1.62E-15 | 3.21E-17 | 5.97E+05 | 1.18E+04 | 1.98 | |
| 29139 | Tau | -3.074 | 0.025 | 1.10E-15 | 3.03E-17 | 4.92E+05 | 1.35E+04 | 2.75 | |
| 29139 | Tau | -3.058 | 0.029 | 2.06E-16 | 6.91E-18 | 2.13E+05 | 7.14E+03 | 3.36 | |
| 45348 | Car | -1.289 | 0.019 | 1.59E-14 | 3.04E-16 | 7.83E+05 | 1.50E+04 | 1.91 | |
| 45348 | Car | -1.309 | 0.020 | 3.38E-16 | 6.53E-18 | 1.24E+05 | 2.41E+03 | 1.94 | |
| 45348 | Car | -1.307 | 0.025 | 2.17E-16 | 6.03E-18 | 9.67E+04 | 2.69E+03 | 2.78 | |
| 45348 | Car | -1.307 | 0.029 | 4.10E-17 | 1.37E-18 | 4.24E+04 | 1.42E+03 | 3.35 | |
| 48915 | CMa | -1.360 | 0.017 | 1.70E-14 | 2.96E-16 | 8.36E+05 | 1.46E+04 | 1.75 | |
| 48915 | CMa | -1.348 | 0.018 | 3.50E-16 | 6.19E-18 | 1.29E+05 | 2.28E+03 | 1.77 | |
| 48915 | CMa | -1.346 | 0.023 | 2.24E-16 | 5.82E-18 | 1.00E+05 | 2.60E+03 | 2.59 | |
| 48915 | CMa | -1.341 | 0.027 | 4.23E-17 | 1.36E-18 | 4.38E+04 | 1.41E+03 | 3.21 | |
| 81797 | Hya | -1.362 | 0.019 | 1.70E-14 | 3.19E-16 | 8.37E+05 | 1.57E+04 | 1.88 | |
| 81797 | Hya | -1.309 | 0.019 | 3.38E-16 | 6.39E-18 | 1.24E+05 | 2.36E+03 | 1.89 | |
| 81797 | Hya | -1.351 | 0.027 | 2.25E-16 | 6.59E-18 | 1.01E+05 | 2.94E+03 | 2.92 | |
| 81797 | Hya | -1.350 | 0.030 | 4.26E-17 | 1.46E-18 | 4.41E+04 | 1.51E+03 | 3.42 | |
| 106849 | Mus | -1.594 | 0.029 | 2.11E-14 | 5.83E-16 | 1.04E+06 | 2.87E+04 | 2.77 | |
| 106849 | Mus | -1.647 | 0.027 | 4.61E-16 | 1.17E-17 | 1.70E+05 | 4.32E+03 | 2.54 | |
| 106849 | Mus | -1.708 | 0.031 | 3.13E-16 | 1.01E-17 | 1.40E+05 | 4.53E+03 | 3.24 | |
| 106849 | Mus | -1.700 | 0.039 | 5.89E-17 | 2.42E-18 | 6.09E+04 | 2.50E+03 | 4.10 | |
| 108903 | Cru | -3.299 | 0.039 | 1.01E-13 | 3.71E-15 | 4.99E+06 | 1.83E+05 | 3.66 | |
| 108903 | Cru | -3.354 | 0.038 | 2.22E-15 | 7.95E-17 | 8.18E+05 | 2.93E+04 | 3.58 | |
| 108903 | Cru | -3.413 | 0.041 | 1.51E-15 | 6.13E-17 | 6.73E+05 | 2.74E+04 | 4.07 | |
| 108903 | Cru | -3.403 | 0.043 | 2.83E-16 | 1.27E-17 | 2.92E+05 | 1.31E+04 | 4.49 | |
| 128620 | Cen A | -1.562 | 0.018 | 2.04E-14 | 3.58E-16 | 1.01E+06 | 1.76E+04 | 1.75 | |
| 128620 | Cen A | -1.564 | 0.018 | 4.27E-16 | 7.57E-18 | 1.57E+05 | 2.79E+03 | 1.77 | |
| 128620 | Cen A | -1.565 | 0.023 | 2.75E-16 | 7.13E-18 | 1.23E+05 | 3.18E+03 | 2.60 | |
| 128620 | Cen A | -1.566 | 0.027 | 5.20E-17 | 1.67E-18 | 5.38E+04 | 1.73E+03 | 3.21 | |
| 133216 | Lib | -1.565 | 0.025 | 2.05E-14 | 5.00E-16 | 1.01E+06 | 2.46E+04 | 2.44 | |
| 133216 | Lib | -1.619 | 0.022 | 4.49E-16 | 9.79E-18 | 1.66E+05 | 3.61E+03 | 2.18 | |
| 133216 | Lib | -1.680 | 0.028 | 3.05E-16 | 9.03E-18 | 1.36E+05 | 4.03E+03 | 2.96 | |
| 133216 | Lib | -1.670 | 0.036 | 5.73E-17 | 2.23E-18 | 5.92E+04 | 2.30E+03 | 3.89 | |
| 135742 | Lib | 2.874 | 0.019 | 3.44E-16 | 6.39E-18 | 1.69E+04 | 3.14E+02 | 1.86 | |
| 135742 | Lib | 2.899 | 0.019 | 7.00E-18 | 1.32E-19 | 2.58E+03 | 4.85E+01 | 1.88 | |
| 135742 | Lib | 2.904 | 0.025 | 4.48E-18 | 1.23E-19 | 2.00E+03 | 5.49E+01 | 2.75 | |
| 135742 | Lib | 2.915 | 0.029 | 8.40E-19 | 2.78E-20 | 8.68E+02 | 2.88E+01 | 3.32 | |
| 150798 | TrA | -1.337 | 0.022 | 1.66E-14 | 3.50E-16 | 8.18E+05 | 1.72E+04 | 2.11 | |
| 150798 | TrA | -1.329 | 0.021 | 3.44E-16 | 6.99E-18 | 1.27E+05 | 2.58E+03 | 2.03 | |
| 150798 | TrA | -1.364 | 0.026 | 2.28E-16 | 6.38E-18 | 1.02E+05 | 2.85E+03 | 2.80 | |
| 150798 | TrA | -1.361 | 0.030 | 4.31E-17 | 1.48E-18 | 4.46E+04 | 1.53E+03 | 3.44 | |
| 167618 | Sgr | -1.731 | 0.022 | 2.39E-14 | 5.08E-16 | 1.18E+06 | 2.50E+04 | 2.13 | |
| 167618 | Sgr | -1.696 | 0.021 | 4.82E-16 | 9.86E-18 | 1.78E+05 | 3.63E+03 | 2.04 | |
| 167618 | Sgr | -1.753 | 0.026 | 3.26E-16 | 9.13E-18 | 1.46E+05 | 4.08E+03 | 2.80 | |
| 167618 | Sgr | -1.786 | 0.031 | 6.37E-17 | 2.25E-18 | 6.59E+04 | 2.33E+03 | 3.53 | |
| 216956 | PsA | 1.002 | 0.019 | 1.93E-15 | 3.62E-17 | 9.49E+04 | 1.78E+03 | 1.88 | |
| 216956 | PsA | 1.001 | 0.019 | 4.02E-17 | 7.65E-19 | 1.48E+04 | 2.82E+02 | 1.90 | |
| 216956 | PsA | 1.004 | 0.025 | 2.58E-17 | 7.11E-19 | 1.15E+04 | 3.18E+02 | 2.76 | |
| 216956 | PsA | 1.008 | 0.029 | 4.86E-18 | 1.62E-19 | 5.02E+03 | 1.67E+02 | 3.33 |
Note. — All stated quantities assume that a KRS-5 dewar window is used. If the KBr window is used, the values are nearly identical (to within 7% of the stated uncertainties).