eurm10 \checkfontmsam10 \pagerange1–8
How does clustering depend on environment?
Abstract
According to the current paradigm, galaxies form and reside in extended cold dark matter (CDM) halos and in turn are key tracers of cosmological structure. Understanding how different types of galaxies occupy halos of different masses is one of the major challenges facing extragalactic astrophysics. The observed galaxy properties depend on the environment surrounding the galaxy. Within the framework of most galaxy formation models the environmental dependence of the galaxy population is mainly due to the change of the halo mass function with large-scale environment. Such models make precise predictions for how galaxy clustering should depend on environment. We will illustrate this by presenting analytical models of dark matter and galaxy clustering along with results obtained from numerical simulations. With these results we can hope to obtain a better understanding of the link between galaxies and dark matter and thereby constrain galaxy formation models.
1 Introduction
The properties of galaxies are determined by the dark matter haloes in which they form. The link between galaxies and haloes is an imprint of various complicated physical processes related to galaxy formation such as gas cooling, star formation, merging, tidal stripping and heating, and a variety of feedback processes. Different types of galaxies have different types of evolutionary histories and clustering properties. For example, observationally it has been found that clustering of galaxies is dependent on their luminosity and color. More luminous galaxies are generally more strongly clustered than fainter ones, whereas red galaxies are more clustered than blue galaxies (Zehavi et al. 2002). On the other hand, haloes of different mass are clustered differently, which in turn are populated by different galaxy types. We can therefore infer the link between galaxies and dark matter haloes directly from the observed clustering properties of galaxies. The halo based description is the backbone of this approach and provides a simple and natural way of modelling the difference between the clustering of galaxies relative to dark matter in the form of the halo model (Cooray & Sheth 2002).
2 Quantifying Clustering with the Correlation Function
Analytical modelling
Within the framework of the halo model the correlation function can be expressed in terms of two components:
| (1) |
where is the overdensity in a region of mass M and volume V which is , being the background density. The first term is the one halo term, which is the contribution from pairs of particles inside the same halo, and the second term is from pairs of particles lying in two different haloes.
The one halo term depends on the conditional mass function, , and on the density profile which is assumed to be NFW (Navarro et al. 1997, Sheth & Tormen 2002). It dominates on small scales and is written as:
| (2) |
where is the probability of finding a region of overdensity , is the background density of the overdense regions, and is the convolution of the density profile with itself (Sheth et al. 2001).
The two halo term depends on the conditional mass function and on the halo-halo correlation function . It dominates on large scales where linear theory is accurate and can be written as:
| (3) |
The halo model has become more and more accurate owing to the fact that detailed analytical descriptions for the structure and clustering of dark matter haloes have become available.
The halo model can be extended to address the bias of galaxies by introducing a model for the halo occupation number, , which describes how many galaxies on average occupy a halo of mass . It is seen that the environmental dependence of the galaxy population is mainly due to the change of the halo mass function with large-scale environment. So we can hope to understand the environmental dependence of the galaxy population by understanding how galaxies occupy dark matter haloes of different masses.
3 Results and Future Work
In this paper we show results for the CDM choice of the initial fluctuation spectrum for which (, h, ) is (0.3, 0.7, 0.9), and = 1 - . Here is the density in units of the critical density today, the Hubble constant today is = 100km s-1 Mpc-1, and describes the amplitude of the initial fluctuation spectrum. In this work we utilized a simulated dataset from the Virgo Consortium (the GIF simulation) that consisted of particles in a box of size Mpc/. The correlation function was calculated using the Landy-Szalay estimator and the NPT code.
Implementing the environmental dependence into the halo mass function, we found that there was an observable upward shift of the correlation function for haloes in dense regions with respect to the correlation function for haloes in all regions. This is shown in the left panel of Fig. 1.
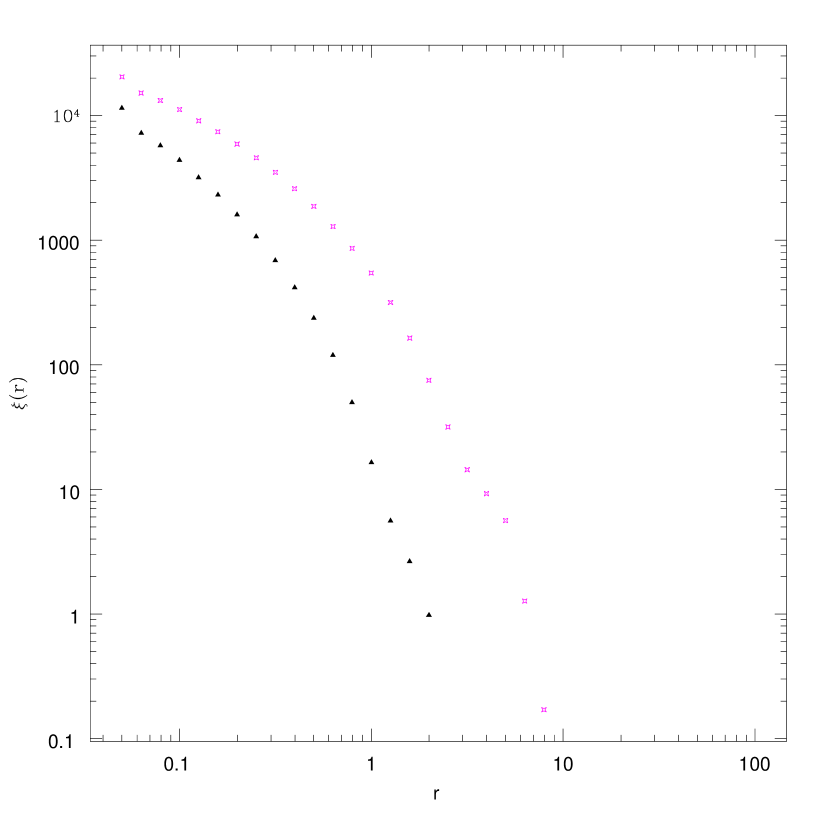
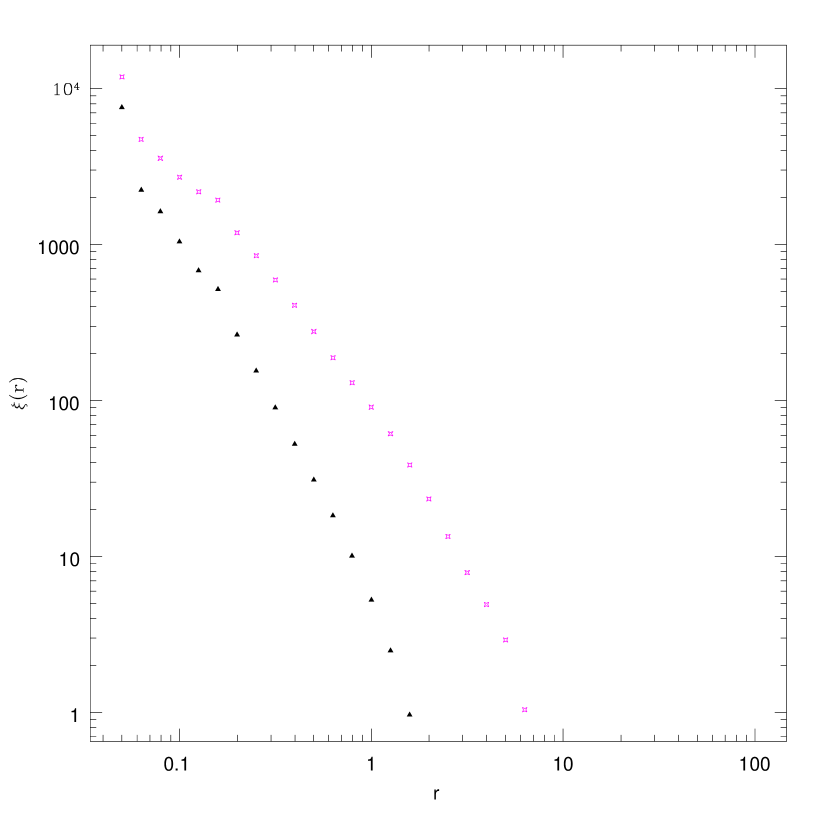
This model was extended to correlation functions describing galaxies by implementing the halo occupation numbers. And once again we measured an observable upward shift for galaxies in haloes that were in denser regions (right panel of Fig 1). The process of ongoing work is to derive a simple summary of simulation results in terms of empirical analytical expressions describing the environmental dependence in terms of specific parameters (ie. the halo mass).
With data from the Sloan Digital Sky Survey (SDSS) the models can be confronted with statistical data of unprecedented quality to obtain stringent constraints on the halo occupation numbers, and therewith on both cosmological parameters and galaxy formation models. This will be the focus of future work.
We will take this approach further by considering the conditional luminosity function (CLF). The advantage of the CLF over the halo occupation function is that it will allow us to address the clustering properties of galaxies as a function of luminosity. In addition, the CLF is a direct link between the halo mass function and the galaxy luminosity function. Therefore, the CLF is not only constrained by the clustering properties of galaxies, as in the case with , but also by the observed galaxy luminosity function.
Acknowledgements.
We would like to thank the Virgo consortium for kindly making the simulations available, and the Pittsburgh Computational Astrostatistics Group (PiCA) for the NPT code.References
- [Cooray & Sheth (2002)] Cooray A., Sheth R.K. 2002 Phys. Rep. 372, 1–129
- [Navarro et al. (1997)] Navarro J.F., Frenk C.S., White S.D.M. 1997 ApJ 490, 493–508
- [Sheth et al. (2001)] Sheth R.K., Hui L., Diaferio A., Scoccimarro R. 2001 MNRAS 325, 1288–1302
- [Sheth & Tormen] Sheth R.K., Tormen G. 2002 MNRAS 329, 61–75
- [Zehavi et al.] Zehavi I.,et al. 2002 ApJ 571, 172–190