Absolute Proper Motion of the Fornax Dwarf Spheroidal Galaxy from Photographic and WFPC2 Data
Abstract
We have measured the absolute proper motion of the Fornax dwarf spheroidal galaxy from a combination of photographic plate material and WFPC2 data that provide a time baseline of up to 50 years. The extragalactic reference frame consists of 8 QSO images and 48 galaxies. The absolute proper motion is mas yr-1 and mas yr-1. The corresponding orbit of Fornax is polar, with an eccentricity of 0.27, and a radial period of 4.5 Gyr. Fornax’s current location is near pericenter. The direction of the motion of Fornax supports the notion that Fornax belongs to the Fornax-LeoI-LeoII-Sculptor-Sextans stream as hypothesized by Lynden-Bell (1976, 1982) and Majewski (1994).
According to our orbit determination, Fornax crossed the Magellanic plane Myr ago, a time that coincides with the termination of the star-formation process in Fornax. We propose that ram-pressure stripping due to the passage of Fornax through a gaseous medium denser than the typical intragalactic medium left behind from the LMC may have caused the end of star formation in Fornax. The excess, anomalous clouds within the South Galactic pole region of the Magellanic Stream whose origin has long been debated in the literature as constituents of either the Magellanic Stream or of the extragalactic Sculptor group, are found to lie along the orbit of Fornax. We speculate that these clouds are stripped material from Fornax as the dwarf crossed the Magellanic Clouds’ orbit.
1 Introduction
The Fornax dwarf spheroidal galaxy (dSph) is the second most luminous of the ten dSph satellites of the Milky Way, just after Sagittarius dSph (Sgr) (e.g., Grebel, Gallagher & Harbeck 2003, hereafter GGH03, Majewski et al. 2003). Among the well-known Milky-Way satellites, Sagittarius and Fornax are the only dSph that have their own system of globular clusters111The recently discovered structure toward the Galactic Anticenter also known as the Monoceros/Canis Major system apparently contains old open clusters as well as globular clusters (e.g., Frinchaboy et al. 2004, Martin et al. 2004). Since it is a system rather poorly characterized at the present time, we chose not to include it in the present discussion. Nevertheless, it is yet another example of a system able to form clusters. (Hodge 1961, Da Costa & Armandroff 1995). Sgr has at least five globular clusters associated with it (Pal 12 besides the four clusters in the main body of Sgr, Dinescu et al. 2000, Martínez-Delgado et al. 2002, Cohen 2004), and arguably even more scattered along its orbit (Bellazzini et al. 2003, Majewski et al. 2004) as the dwarf is in the process of tidal disruption. Fornax is known to have five globular clusters. These clusters show a strong second-parameter effect as recently confirmed by Mackey & Gilmore (2003b), while this is not the case for the known Sagittarius clusters (see Table 4 in Dinescu et al. 2001). Also, the Fornax clusters are all metal poor ( [Fe/H] ) and have rather similar masses, while those of Sgr span a large range in metallicity ( [Fe/H] ) and mass (see Strader et al. 2003, Table 7 in Gilmore & Mackey 2003a, Table 4 in Dinescu et al. 2001).
Fornax itself has a wide metallicity range ( [Fe/H] ) with a mean of -0.9 (e.g., Pont et al. 2004), a characteristic shared only by Sgr among the Milky Way dSph satellites. Fornax’s population consists of old, metal-poor stars, a majority of intermediate-age stars ( Gyr), and young stars formed between 2 Gyr and 200 Myr ago (Pont et al. 2004, Saviane et al. 2000, Stetson, Hesser & Smecker-Hane 1998). One might expect H I to be detected in Fornax, given its recent star formation. However, Young (1999) found no evidence of H I at the galaxy center at a column density detection limit of cm-2, nor at a limit of cm-2 at one core radius (i.e., M⊙, GGH03). If star formation in Fornax has ceased only recently, then it is important to determine the orbit of the satellite and understand whether its interaction with the Galaxy may have been responsible for the abrupt cessation. A much-favored mechanism for removing gas from a dSph is ram-pressure stripping as the satellite moves through the intragalactic medium (e.g., GGH03). It has been suggested that the star formation histories of satellite galaxies may be correlated to their orbits and perigalactic passages (e.g., GGH03 and references therein, Mayer et al. 2001). The complex star formation history of Fornax makes it an interesting subject from this standpoint.
Lynden-Bell (1976, 1982), Kunkel & Demers (1976) and Kunkel (1979) pointed out that the Galaxy’s dSphs, as well as a number of its globular clusters, seem to collect along distinct planar alignments and proposed that these alignments reflect distinct orbital planes. One of these orbital planes is the Magellanic plane which consists of the Magellanic Clouds, the H I gas trailing the Magellanic clouds (also known as the Magellanic Stream, MS hereafter), Ursa Minor, Draco, and Carina. The second plane includes Fornax, Leo I, Leo II and Sculptor. Majewski (1994) reinvestigated this issue and added Sextans and perhaps Phoenix to the Fornax-Leo-Sculptor alignment, which is now known as the FL2S2 plane. To explain the alignments, a common origin via the disruption of larger satellites orbiting in these planes is usually invoked, with the smaller dSphs forming as tidal condensations or broken-off fragments during the dynamical interaction between our Galaxy and a massive satellite (Kroupa 1997), much like the tidal dwarfs seen in extragalactic contexts (e.g., Knierman et al. 2003). The parent satellite has been proposed to be the Large Magellanic Cloud (LMC) for the Magellanic plane, and Fornax for the FL2S2 plane (Lynden-Bell 1982). A real physical association of these spatial alignments can be tested by ascertaining whether the member objects share a common angular momentum, and this requires determining absolute proper motions of the dSphs.
The issues listed above motivate the present study of the proper motion of the Fornax system. A collection of thirteen photographic plates from large aperture telescopes together with numerous frames taken in the field of Fornax collectively spanning a time baseline of up to 50 years now make possible a deep, high-precision proper-motion study. During the course of our work with these data a preliminary absolute proper motion of Fornax using only data was published by Piatek et al. (2002, hereafter P02). Their earlier study, with data spanning an epoch difference of up to two years, used QSO images as references for the determination of the absolute proper motion. Our largely independent measurement allows a comparison with this -only proper-motion determination.
The paper is organized as follows: we describe the observational data and the astrometric reductions in Section 2, and the absolute proper-motion determination in Section 3. In Section 4 we discuss the velocity and orbit of Fornax in relation with its star-formation history and the FL2S2 plane. We summarize our results in Section 5.
2 The Data
2.1 Observational Material
The absolute proper motion of the Fornax dwarf galaxy was determined from the measurement of thirteen photographic plates and from six WFPC2 data sets taken at different pointings in the field of the dwarf galaxy. The various combinations of plate and WFPC2 data coverage lead to epoch differences varying between 20 and 50 years for different areas of the field. The characteristics of the photographic plates are listed in Table 1, while those of the WFPC2 data sets are listed in Table 2. The oldest plates were taken with the Hale 5m reflector (scale = mm-1) in the early fifties. One of these (PH805B) includes Fornax Cluster # 3 (NGC 1049) and the other two include Cluster # 4. Six plates were taken with the CTIO 4m reflector (scale = mm-1) in the mid seventies. Of these, we used only three plates in the astrometric reduction, namely 276, 282 and 287. The remaining three were taken in the blue passband at large hour angles, and a preliminary proper-motion reduction indicated that these plates have very large color terms that could not be entirely modeled and removed from the proper motions. These plates were however used in the calibration of the photographic photometry. Another seven plates were taken with the Las Campanas Du Pont 2.5m reflector (scale mm-1) between 1977 and 2001. Because of the large angular sizes (1.51.5 degrees on 2020 inch plates) and long exposure times for most of the latter plates, special care was taken to observe using two guide probes placed on opposite sides of the plate field. With two probes the effects of differential atmospheric refraction could be observed and partially compensated for by slowly rotating the plate during the exposure.
The WFPC2 data were taken between 1995 and 2000 for various purposes: studying the Fornax clusters (e.g., Buonanno et al. 1999), determining the absolute proper motion of the Fornax dwarf from measurements only (P02), and as parallel observations.
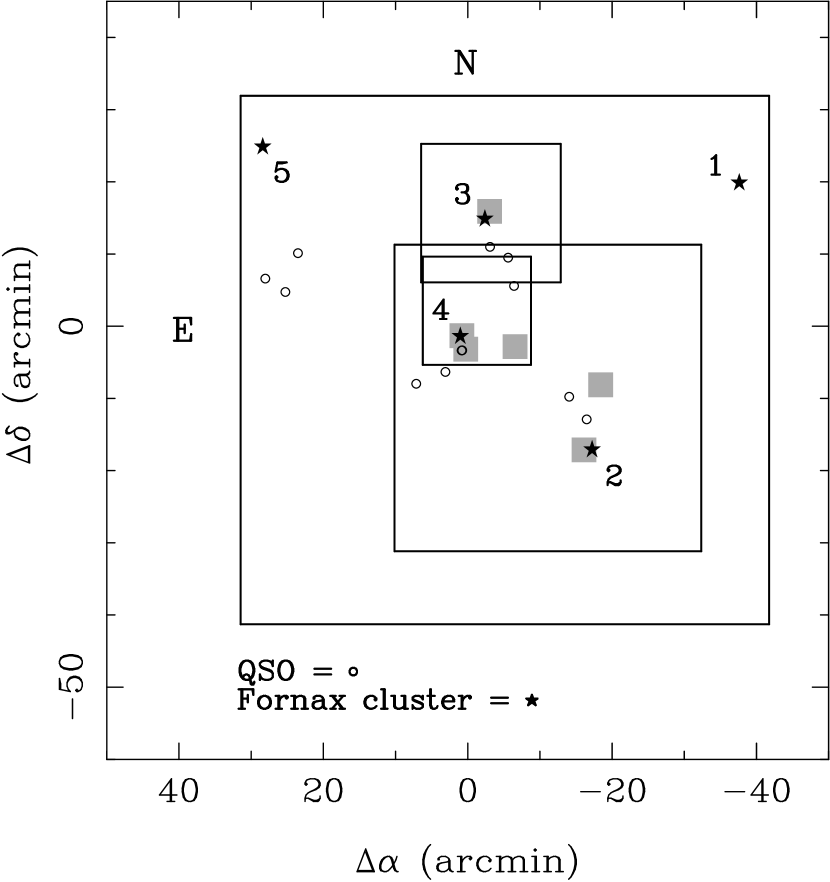
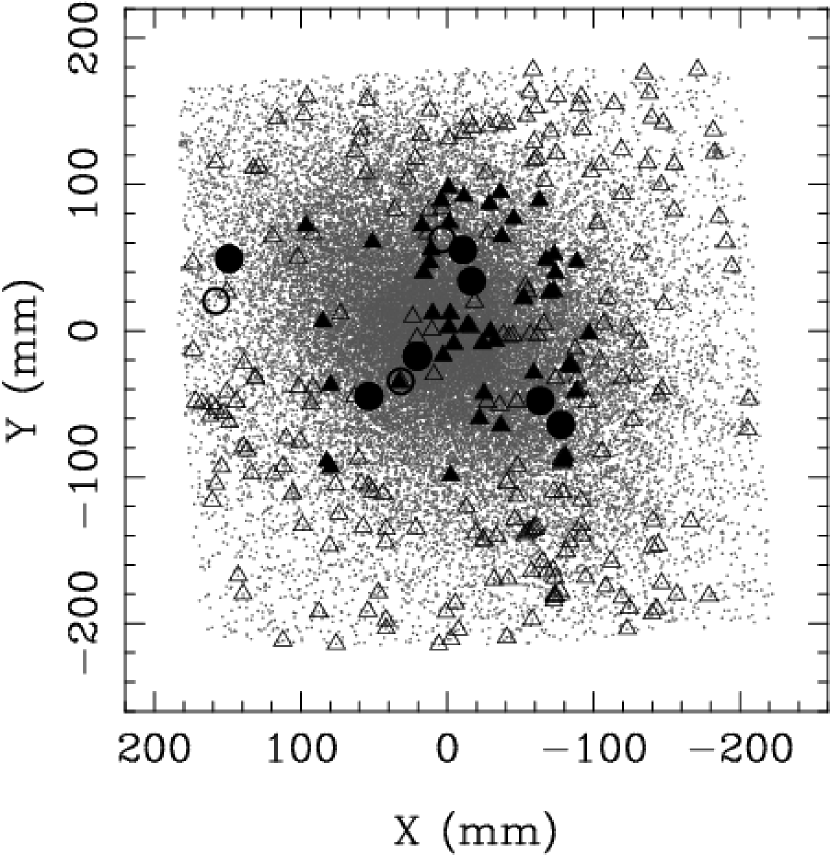
In Figure 1 we show the distribution of the observational material in the field of Fornax dSph. In this plot, the center of Fornax is at (0,0), i.e., at , , J2000, (Walcher et al. 2003). We have also indicated the five globular clusters in Fornax, and the eleven QSOs detected by Tinney, Da Costa & Zinnecker (1997), and Tinney (1999) in the background of the Fornax galaxy. The outermost square shows the boundary of the input catalog determined from the scan of Du Pont plate CD0100. The large Du Pont plates have plate centers that vary by a few arcmin (Table 1). By using the same input catalog, objects on the edges of the input catalog may have been missed in some of the large Du Pont plates. At any rate, these objects were not included in the final proper-motion solution. fields, as well as the CTIO and Hale areas also also indicated.
2.2 Measurements
The photographic plates were scanned with the Yale PDS microdensitometer. First, we have created input catalogs based on the entire digitization of plates CD0100, 288, PH805 and PH863. The area coverage of measurable images is as follows: 1) all Du Pont plates cover 1.221.22 degrees, except CD3302, which is a smaller size plate than the rest at an area of 0.770.77 degrees, 2) all CTIO plates cover 0.700.70 degrees each, 3) the Hale 5m plate PH805 covers 0.320.32 degrees, while Hale plates PH863 and PH275 cover 0.250.25 degrees. Although the area coverage for plate CD0100 includes all of the plates listed in Table 1, we made full-area scans of one CTIO plate and the Hale plates, because these are deeper than CD0100. From these scans, preliminary positions, object diameters, magnitudes and classification were determined with the FOCAS software (Valdes 1982, 1993). Then, based on these input lists, the plates were scanned in a fine-raster, object-by-object mode. For the Du Pont 2.5m and Hale 5m plates we have used a pixel size of 12.7 m, while for the CTIO 4m plates we have used a 10 m pixel, because the plate scale is larger for these latter plates. Image positions and instrumental magnitudes for each plate were determined using the Yale Image Centering routines (two-dimensional Gaussian fit; Lee & van Altena 1983). Objects from various input catalogs were then positionally cross-correlated to create a master list.
Plate solutions that include transformation of coordinates among same-epoch plates give us an estimate of the centering uncertainty per object and plate. Thus, well-measured stars on the Hale 5m plates have a centering uncertainty of 3.0 m (33 mas); on the CTIO plates, 1.4 m (26 mas); and on the Du Pont 2.5m plates, 2.0 to 3.0 m (22-33 mas). The 2001 Du Pont plate is of exceptional quality due to the fine-grained emulsion and seeing conditions. We estimate a centering uncertainty of 1.2 m (13 mas) based on a coordinate transformation into WFPC2 coordinates (see below).
The entire archived data set in the field of Fornax, as retrieved in 2000, consists of 156 WFPC2 images taken between 1995 and 2000. The fields were targeted on all Fornax clusters, on QSO J0240-3434A+B (Tinney et al. 1997), and on two parallel data fields. All of the Fornax fields had multiple exposures in one or two filters except for one parallel data field. We chose not to use the data on clusters # 1 and # 5 in this analysis, because these clusters lie at the edge of our field (Fig. 1) where geometric systematics of the photographic plate material are severe.
The WFPC2 images were processed using IRAF routines. First, they were corrected for the 34th row effect described in Anderson & King (1999), and then cleaned for cosmic rays using the mask technique described in Yanny et al. (1994). One parallel data field that had only one exposure was left uncleaned. For each pointing, all of the frames were aligned and median stacked to create a high signal-to-noise image. Object detection was performed on this stacked image using the DAOFIND routine in IRAF. The list of objects detected was then used on each individual frame to determine their centroids and magnitudes. The centroids were determined with the help of the PSF algorithm in IRAF, for which the analytic part is chosen to be an elliptical Moffat function with . The positions thus obtained were corrected for distortion using the coefficients determined by Anderson & King (2003). Two WFPC2 data sets partly overlap in the region of Fornax cluster 4, namely the 1995 set and the 1999 set. A coordinate transformation for the common stars in these two data sets yields a positional uncertainty of 0.06 WFC pixels per star, or 6 mas. This value is larger than the 0.02-pixel nominal WFPC2 positional precision obtained in studies that use an empirically-determined PSF in rich stellar fields and a wealth of dithered images (e. g., Anderson & King 2000). However, the positional uncertainty of the data is significantly better than the centering uncertainty on the photographic plates. Thus, the random proper-motion uncertainty is dominated by the centering uncertainty on the photographic plates. We have used only WFC data except for the field containing QSO J0240-3434A+B which was centered on the PC. In the rest of the data sets, there are either too few stars in the PC that can be matched with stars on the photographic plates, or there are too many stars when the PC is placed on a cluster. In the latter case, the photographic images are hopelessly blended, and no reliable cross-identification can be achieved. From all of the data sets, we were able to cross-identify only a few extragalactic objects with the photographic plates. One is QSO J0240-3434A+B, a lensed quasar with two distinct images separated by arcsec, and four relatively bright galaxies, all located in the parallel data set taken in 2000 (see Table 1).
3 Proper-Motion Measurement
The reduction procedure is similar to that used in Dinescu et al. (2000 and 2001, hereafter D00 and D01). Since details are described thoroughly there, here we only briefly mention the necessary steps involved in the reduction. All of the photographic-plate coordinates were first corrected for distortion using the coefficients determined by Chiu (1976) for the Hale plates, and by Cudworth & Rees (1991) for the CTIO and the Du Pont plates. Photographic and magnitudes were obtained by calibrating instrumental magnitudes from the Du Pont and CTIO plates in the appropriate passband with Johnson magnitudes from the CCD ground-based study of Saviane et al. (2000). Typical magnitude uncertainties are mags. The colors thus obtained for all of the objects are crucial for modeling color-dependent positional systematics known to affect the photographic astrometry.
Since the Du Pont 2.5m plates have the smallest distortion correction among the three sets of plates, we have selected plate CD2677 to serve as a master plate. This plate has very good image quality and is taken close to the meridian, thus minimizing color systematics in the positions due to differential color refraction. The remaining Du Pont plates were transformed into this master plate using polynomials up to 6th order in each coordinate and, when needed, color terms. The magnitude-dependent systematics were modeled by using Fornax stars selected from the color-magnitude diagram (CMD). Fornax stars represent a system with a common motion while random Galactic field stars do not have this propertry. Thus, using Fornax stars, one can separate the guiding-induced magnitude systematic errors in the proper motions from the true, secular proper motion (for details see D00 and references therein). Since Fornax stars span a magnitude range from down to our plate limit, it is only up to this bright limit that the proper motions are assumed to be free of magnitude systematics. A first iteration that included only the Du Pont plates, in order to minimize systematics, produced preliminary relative proper motions with a time baseline of 24 years. The stars that define the transformation are well-measured and are predominantly Fornax stars. These preliminary proper motions were used to update object positions for each CTIO and Hale plates which were subsequently introduced into the proper-motion solution and modeled in the same manner as the Du Pont plates. A second iteration that included all of the photographic plates was done, and then the WFPC2 data were introduced into the solution. Each WFPC2 chip was transformed independently using up to 2nd order terms, and between 10 and 50 reference stars. No magnitude or color-dependent systematics were detected in these transformations. For the photographic plates, between 3000 and 20,000 stars were used in the plate solutions, depending on the area coverage and depth of the plate. For each object, the proper motion is calculated from an unweighted linear least-squares fit of positions as a function of time. The error in the proper motion is given by the scatter about this best-fit line. Measurements that differ by more than from the best-fit line are excluded. Only objects that have at least three measurements and a 16-year epoch difference were kept, and a relative proper motion and proper-motion uncertainty calculated. For the QSOs, the images on each plate were visually inspected, and poor images were discarded from the fit. The final proper motion catalog includes 38,059 objects.
Based on the FOCAS classification of objects on the digitized plate CD0100, as well as from the plot of image peak as a function of image radius, we selected a preliminary list of galaxies. These were then visually inspected on plate CD0100 to confirm their classification as galaxies rather than blended stars. The final list of galaxies covering the entire area included 315 objects. Of these, only 268 galaxies have measurements that allow a proper-motion determination in our catalog. Similarly, from the initial list of 12 QSO images, only 11 have a proper-motion determination. The QSO that failed to have a proper-motion determination is J0242-3424 (Tinney 1999), which is the easternmost quasar in Fig. 1.
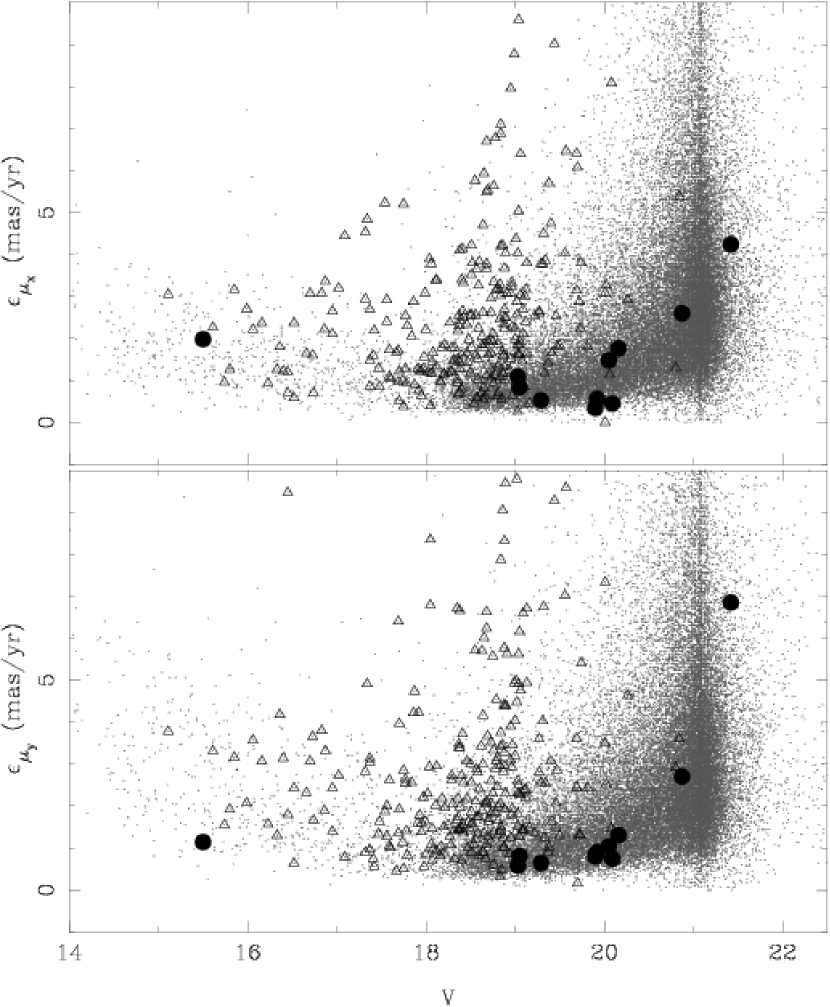
In Figure 2 we show the distribution of the proper-motion uncertainty as a function of magnitude for stars, QSOs and galaxies, in each coordinate. The median value for the proper-motion uncertainty per star, for well-measured stars (i.e., to 20), is between 0.8 and 1 mas yr-1. Galaxies have a median value of the proper-motion uncertainty between 1.3 and 3 mas yr-1 in the range to 20. The well-measured QSOs (i.e. to 20.5 ) have between 1 and 2 mas yr-1 proper-motion error.
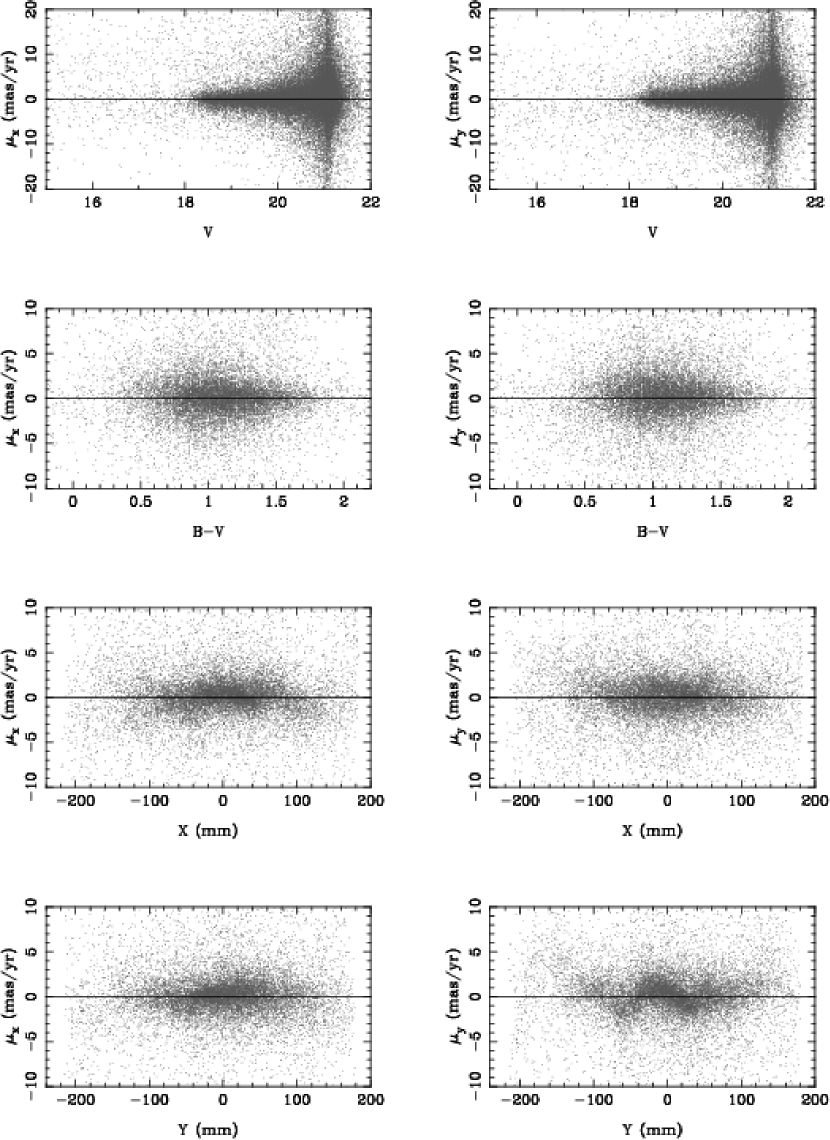
In Figure 3 we show the relative proper motions for all objects in the catalog as a function of magnitude, color and X, Y coordinates. The top panels show the entire magnitude range, while the rest of the panels include objects with magnitudes between and 20.5. The X coordinate is aligned with the right ascension with X increasing eastward, and the Y coordinate is aligned with declination with Y increasing toward north, at a scale of /mm. Therefore, for this small area, is practically identical to , and to . There are no significant trends in the proper motions with either magnitude or color. However, proper motions as a function of position on the plate show that geometric systematics are left in the proper motions determined from the global plate solution. This is because of the limited ability to correct for distortion due to the uncertainty in the position of the distortion center and the uncertainty in the distortion coefficients.
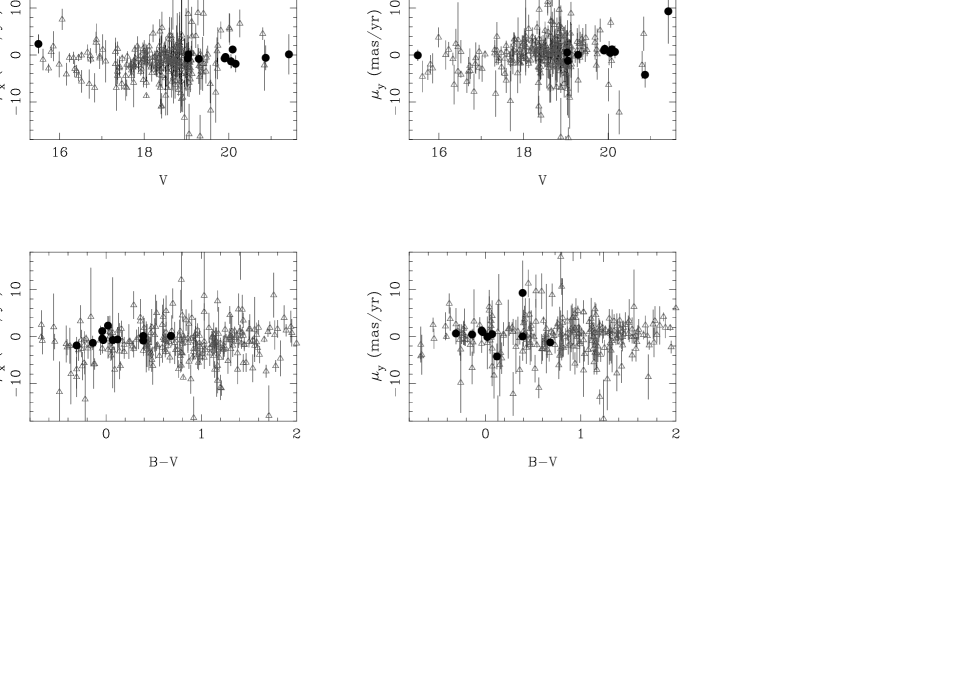
To correct for this, we assume that, locally, all proper motions are systematically affected in the same way (see D00, D01). Thus, for each extragalactic object we define a local reference system comprised of 30 stars. The number of stars to be used in the local solution is determined such that the average radius of the local system is smaller than the size over which systematics become important. In this case the average radius of the local reference systems is 13 mm. We have also performed a solution based on 15 stars in the local reference system, and we found that this solution is indistinguishable from the 30-star solution. The local reference stars are selected from the CMD to belong to the Fornax dwarf. They are well-measured stars, i.e., the proper-motion uncertainty in each coordinate is mas yr-1, with at least six measurements, and they lie in the magnitude range to 21. The proper motion of each extragalactic object obtained from the global solution is corrected by subtracting the average proper motion of the local reference system. This average is defined by the median value of the proper motions of the 30 stars. In Figure 4 we show the proper motions of galaxies and QSOs determined after the local correction has been applied, as a function of magnitude and color. No significant trends are detectable in these plots.
The absolute proper motion of the Fornax dwarf is determined from a selected sample of the extragalactic objects measured, as follows. From the QSOs we keep only those with proper-motion uncertainty mas yr-1 (see Fig. 2). We also discard object J0240-3437 from Tinney’s (1999) list, since this is a large, bright () galaxy. We are thus left with eight images of seven QSOs. From the list of galaxies we keep only objects with to 20, with proper-motion uncertainty 3 mas yr-1 in each coordinate, and that are spatially located within the denser regions of the Fornax dwarf, such that the local reference system is appropriately comprised of Fornax stars. The spatial extent of the galaxies selected matches closely that of the QSOs as seen in Figure 5. The proper-motion error limit for galaxies essentially assures that only well-centered galaxies are used. Well-centered galaxies are those galaxies that have image shapes more closely resembling those of stars. Within this subsample of 54 galaxies, 6 have proper motions that are larger than 5 mas yr-1 in one of the components. These are considered outliers and are discarded from the final absolute proper-motion estimate; we are thus left with 48 galaxies. As a check that our local solution represents an improvement over the global solution we calculate the proper-motion dispersion for the 48 selected galaxies as given by the global solution and by the local solution. We obtain for the global solution, mas yr-1 and, mas yr-1, while from the local solution we obtain mas yr-1 and, mas yr-1. Similarly, for the 8 QSO images we obtain from the global solution mas yr-1 and, mas yr-1, while from the local solution we obtain mas yr-1 and, mas yr-1. In both cases the proper-motion dispersion decreases from the global to the local solution, an indication that geometric systematics left in the global-solution proper motions were lessened from the local-solution proper motions.
We determine a weighted mean average for the absolute proper motion of the Fornax dwarf from the selected QSOs and galaxies. The weights are given by the square of the proper-motion uncertainty of each extragalactic object. The absolute proper motion of the Fornax dwarf galaxy with respect to QSOs is mas yr-1, and mas yr-1, and with respect to galaxies is mas yr-1, and mas yr-1. The two determinations differ by 1.2 of their formal uncertainties. In Figure 6 we show the proper-motion distribution of the selected galaxies and QSOs, and their corresponding averages. For the lensed quasar J0240-3434A+B that has two images within of each other, we obtain the following results: 1) image A has and mas yr-1, with and , and 2) image B has and mas yr-1 with and . While the proper motions agree within their formal uncertainties, we note that the uncertainty in for the B component is rather large, but not unusual for this magnitude (see Fig. 2). The two QSO images have rather different magnitudes and colors, and any residual systematics with these two quantities will be reflected in their proper motions.
The final absolute proper motion of Fornax is taken to be the error-weighted mean of the QSO and galaxy determinations. This is: mas yr-1 and mas yr-1.
The recent absolute proper-motion determination of the Fornax dwarf made by P02, which is based on WFPC2 and STIS data alone and uses 4 QSO images (i.e., the lensed QSO in one PC field, and two QSOs in two STIS fields), gives mas yr-1 and mas yr-1. While the proper motion along right ascension agrees with our value, that along declination is different from ours at the 2- level. Left-over systematics are always invoked to explain the discrepancies between different proper-motion determinations. To the best of our abilities we have studied and hopefully eliminated proper-motions systematics with magnitude, colors and positions to a level below our formal uncertainty, as the comparison of our results for galaxies and QSOs indicate. The P02 result does agree within uncertainties with our QSO-based solution. However, we note that the QSOs have colors significantly bluer than the majority of the Fornax stars used here and in the P02 study. These stars are basically red giants, and the color range of galaxies better overlaps with that of Fornax stars (see Figs. 3 and 4). Therefore we regard the result based on galaxies as extremely helpful in gauging residual systematics.
The QSOs in the P02 study are the brightest (see their Fig. 9) and bluest objects on the frames, and while trends with color and magnitude are not necessarily expected, these were not investigated in the P02 study. Another possible source of error in the P02 result is the distortion correction. For the PC data, they have used the older distortion coefficients (Baggett et al. 2002) rather than the improved, more recent ones determined by Anderson & King (2003) in the densely populated field of Centauri. The fact that the orientation of the P02 frames was chosen to be similar at different epochs would alleviate this problem to some extent. There are however indications that the distortion is time-dependent as a result of the change in the scale of the telescope known as the orbital “breathing” of the optical telesecope assembly (see Anderson & King 2003).
4 Discussion
4.1 Velocities and Orbits
We calculate the velocity components of Fornax assuming that the distance to Fornax is kpc, and the heliocentric radial velocity is km s-1 (Mateo 1998). We have adopted a standard solar motion of km s-1 (Dehnen & Binney 1998) with respect to the Local Standard of Rest (LSR). Here the component is positive outward from the Galactic center, is positive toward Galactic rotation, and is positive toward the North Galactic pole. The adopted rotation velocity of the LSR is km s-1, and the solar circle radius is 8.0 kpc. The uncertainties in the derived Fornax velocity components are determined based on the uncertainties in the distance, radial velocity and proper motions. We also present the proper motion in the Galactic rest frame (i.e., with Solar and LSR motion subtracted), in both equatorial and Galactic coordinates. These proper motions and the velocity components are listed in Table 3. The first row for each object lists the proper motion and velocity components for that object, while the second row lists the 1- uncertainty in our measurement of these quantities. The velocity components are in a cylindrical coordinate system, where is positive outward from the Galactic center, is positive in the direction of Galactic rotation, and is positive toward the North Galactic pole. We also list the radial and tangential velocity components, where the radial component is along the direction from the Galactic center to the object. Along with these, we derive here the same quantities for the Fornax proper-motion measurement of P02, and for the Sculptor proper-motion measurement of Schweitzer et al. (1995).
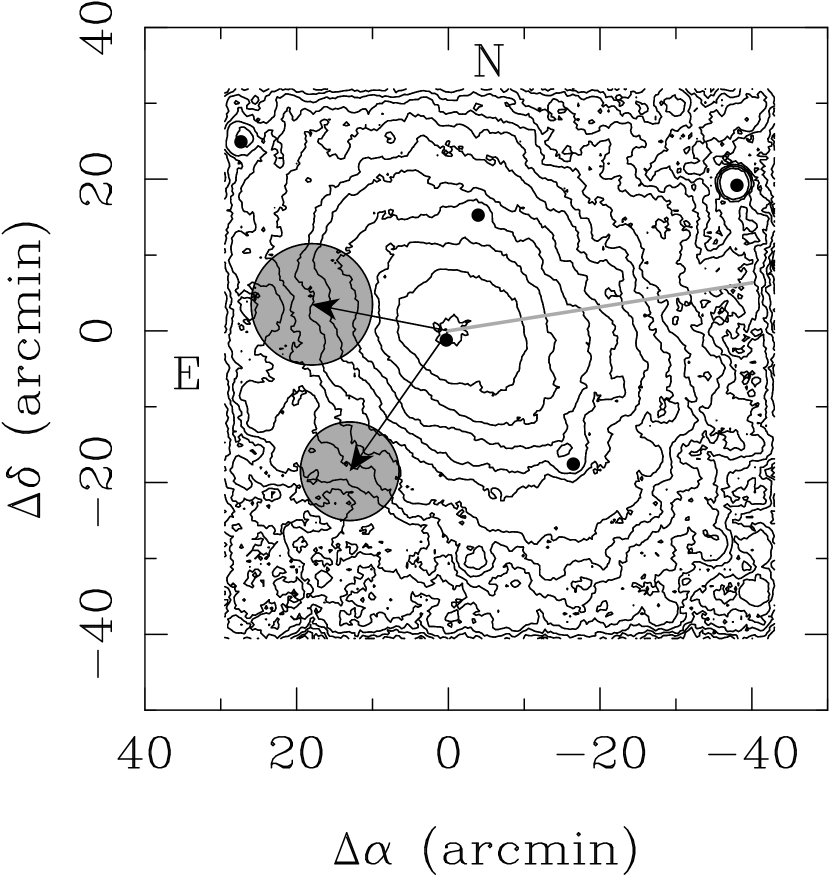
In Figure 7 we show density contour plots of Fornax as derived from the star counts of the raster scan of plate CD0100. The Fornax globular clusters are also marked. Galactic rest frame proper motions are indicated as follows. Our proper-motion determination is represented by the shorter arrow (points ENE), and its uncertainty is defined by the shaded circle. The longer arrow to the SE represents the proper motion as determined by P02. Our proper-motion value indicates a direction of motion closer to the direction of the major axis of the dwarf, while that of P02 is practically perpendicular to the major axis. Also, the size of our proper motion is smaller than that of P02. The position angle of our proper motion is , while that of P02 is . The Sculptor dSph is located at a position angle of from Fornax. The direction toward Sculptor is represented with a gray line in Fig. 7. Thus, our proper-motion determination indicates that Fornax is moving, within errors, along the direction on the sky defined by Fornax and Sculptor, and away from Sculptor (Fig. 7). The position angle of Sculptor’s proper motion is (Schweitzer et al. 1995), while Fornax lies at a position angle of with respect to Sculptor. Therefore Sculptor’s direction of motion is some away from the FL2S2 plane.
We calculate orbital elements by integrating orbits back in time over a period of 20 Gyr and using the Galactic potential model from Johnston, Spergel & Hernquist (1995). The integration time is chosen such that a few orbits are completed, and the orbital elements are averaged over the number of orbits. The uncertainties in the orbital elements are determined from 300 integrations that have initial conditions determined randomly from the uncertainties in the proper motions, radial velocity and distance (see Dinescu, Girard & van Altena 1999, Dinescu et al. 2000). In Table 4 we list the orbital parameters for the current Fornax absolute proper-motion determination and for that of P02, and for the Sculptor dwarf. The total orbital energy should be regarded as being on a relative scale for comparison between measurements and should not be used as a bound versus unbound criterion for Fornax, for example. The orbital inclination is calculated as sin.
Our proper-motion determination implies a low-eccentricity, polar orbit for the Fornax dwarf, with the current location at pericenter. Similar integrals of motion for two or more objects indicate membership to the same stream. Our measurement for Fornax gives , and that are larger than those of Sculptor. However, the uncertainties in these quantities do not allow us to confidently rule out the membership of Sculptor to a stream that includes Fornax, or the proposed FL2S2 stream.
Our estimate of the apocentric radius of Fornax is close to the Galactocentric radii of Leo I (250 kpc) and Leo II (205 kpc) (Mateo 1998), thus reinforcing the hypothesis of the common origin of the FL2S2 stream.
The Sextans dSph with a current Galactocentric distance of 86 kpc (Mateo 1998), may qualify as a member of the FL2S2 stream. While its location on the sky appears farther away from the orbital plane of Fornax (see Figure 9 below) than those of Leo I and Leo II, an overlap of the orbits is within the uncertainties associated with the Fornax orbit.
The Phoenix dSph is located at kpc (Mateo 1998) from the Galactic center, about twice the apocenter distance of Fornax’s orbit, and is therefore a rather unlikely member of any daughter stream of the Fornax dSph, unless substantial orbital decay occurred for the latter.
In contrast to these results, the P02 proper motion measurement for Fornax gives a rather eccentric orbit for Fornax, with the dSph more likely bound to the Local Group than to our Galaxy. Specifically, P02 argue against the membership of Fornax to the FL2S2 stream.
4.2 The Orbit of Fornax and the Missing Gas
The Fornax dSph has a population that consists of predominantly intermediate-age ( Gyr) stars, besides the old, metal-poor stars that are more traditional in dwarf spheroidals (GGH03 and references therein). In addition to these stars, Fornax has relatively young stars with ages between 2 Gyr and 200 Myr (Pont et al. 2004 and references therein). Stars in Fornax have a wide metallicity range, between [Fe/H] = -2.0 and -0.4 as recently demonstrated by Pont et al. (2004). More importantly, Pont et al. (2004) determine an age-metallicity relationship which implies that Fornax underwent an initial enrichment process up to [Fe/H] = -1.0 about 3 Gyr ago, after which continued star formation that lasted until some 200 Myr ago increased the metallicity to [Fe/H] . The inferred star-formation rate increased substantially over the last 4 Gyr (Table 5 in Pont et al 2004). Given this star-formation history, Fornax is expected to have some gas associated with it. However, Young (1999) detected no H I gas within one core radius of the galaxy. Specifically, there were no detections at the column density detection limits of cm-2 at the galaxy center and cm-2 at one core radius. Young (1999) mentions that there may be undetected H I between the core radius and the tidal radius of Fornax. However, if the lack of gas is due to its removal by ram-pressure stripping as Fornax moves through a homogeneous intragalactic medium, then this gas is more easily stripped from the least dense regions of the satellite, and these regions are more likely the outskirts rather than the center of the dSph (GGH03). Also, the bright, blue stars in Fornax associated with young, main sequence stars (Stetson et al. 1998) are located in the central region of the dSph, where there was no H I detection. Thus, as Pont et al. (2004) suggest, it seems that Fornax is now at a particular moment in its history, just after its “gas death”.
GGH03 explored whether ram-pressure stripping as Fornax moves through a uniform, gaseous halo can explain the lack of gas in Fornax. By using the velocity determined by P02 and adopting a gaseous halo density of cm-3, GGH03 estimate an upper limit for the Fornax gas density of cm-3 where ram-pressure stripping is efficient. The Fornax gas density obtained from this simple, pressure-balance estimation is not that of an environment where stars could have formed recently, as is seen in Fornax. Therefore the lack of gas in Fornax has to be explained by a more powerful gas-removal process than the simple one just described. Our lower value of the velocity of Fornax compared to that of P02 (Table 3) would make even less efficient the ram-pressure stripping caused by its motion through a uniform, low-density gaseous halo. The upper limit for the Fornax gas density stated above corresponds to a column density of cm-2, if one assumes a uniform density distribution within one core radius. In this estimation, we have used a core radius of (Walcher et al. 2003), which corresponds to 0.6 kpc.
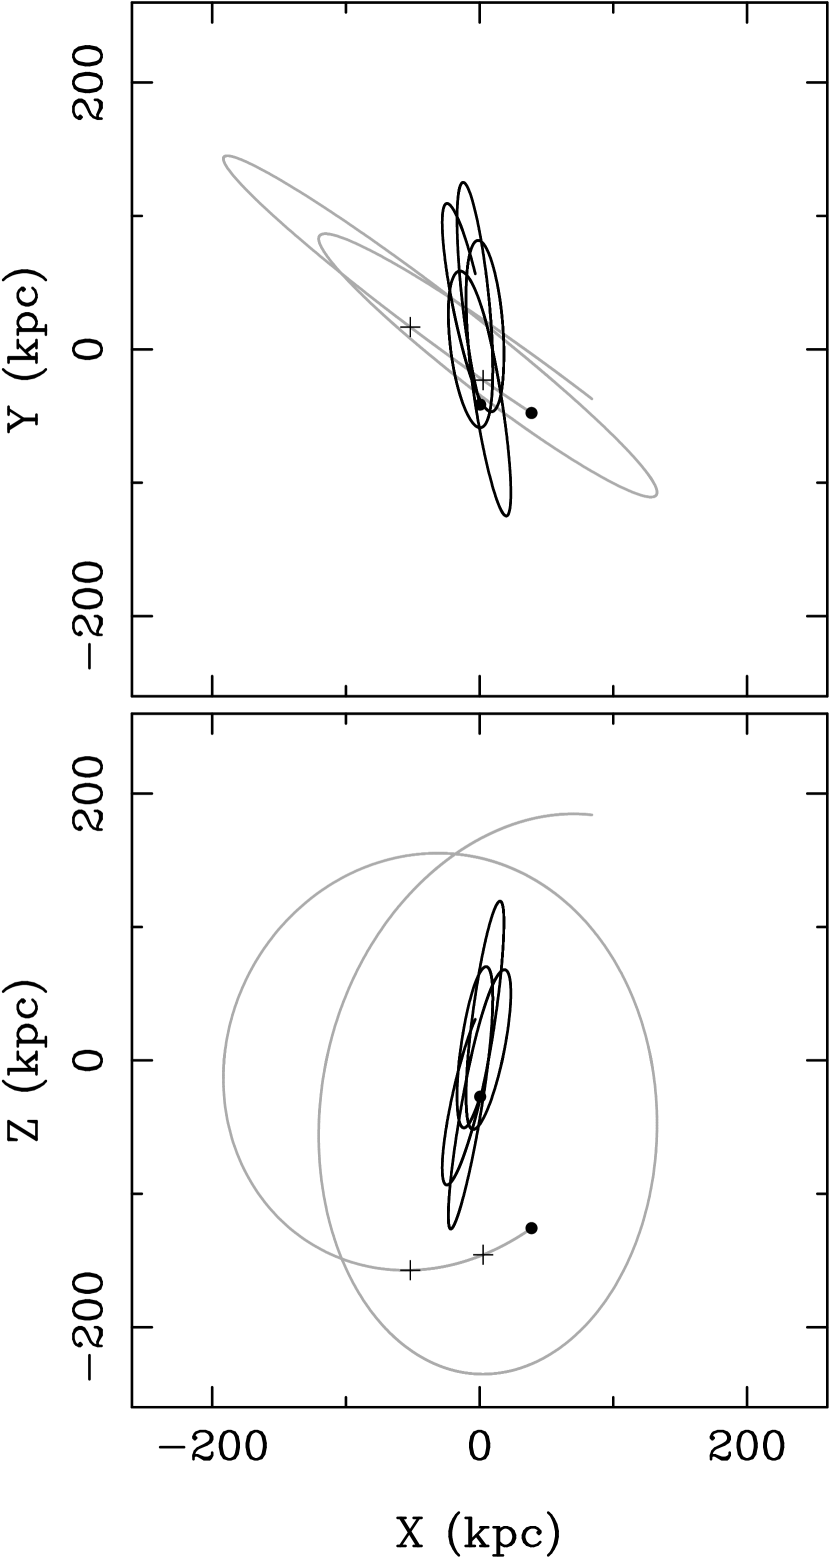
From our orbit determination, there may be another plausible explanation for the lack of gas in a system that was capable of producing stars some 200 Myr ago. Fornax crossed the Magellanic plane relatively recently. Using the velocity and distance data from van der Marel et al. (2002) for the LMC, we have derived its orbit, and therefore the orientation of the Magellanic plane. According to our orbit calculations, Fornax crossed the Magellanic plane about Myr ago, a recent event, considering the 4.5-Gyr orbital period of Fornax (Table 4). At this crossing, Fornax was located kpc from the Galactic center, specifically at (X, Y, Z) = (5, -25, -145) kpc (the Sun is at (8.0, 0.0 0.0) kpc). In Figure 8 we show the orbits of the LMC (dark line) and of Fornax (gray line) in the plane of the Galactic disk, and the X-Z plane perpendicular to the Galactic disk. The orbits represent 10-Gyr integrations backward in time. The current positions of the LMC and Fornax are indicated with filled symbols. We have also marked 200 and 500 Myr ago on the orbit of Fornax with cross symbols. While in the X-Z plot of the orbits, the LMC orbit does not quite reach that of Fornax, moderate uncertainties in the orbits due to proper-motion uncertainties easily allow for their actual crossing.
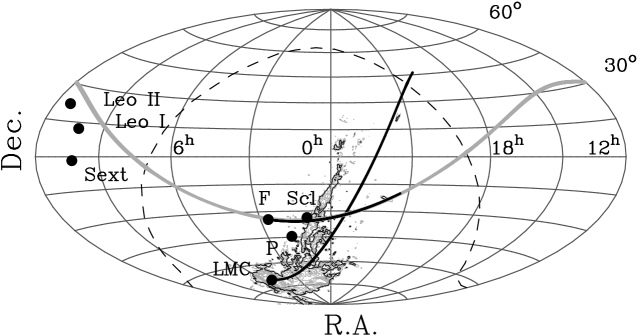
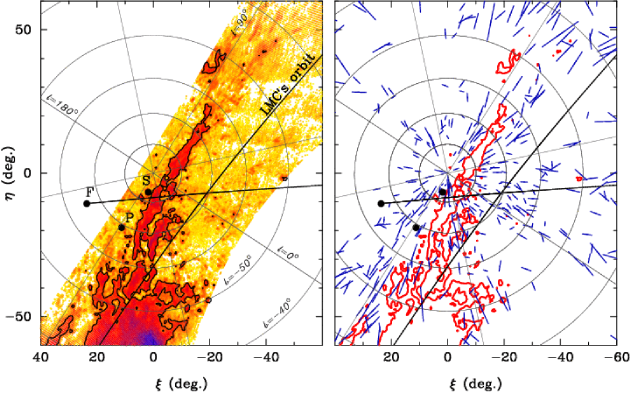
It is conceivable that gas from the LMC trails along its orbit beyond what is now known as the MS, a 100 tidal filament of neutral hydrogen. The recent N-body/SPH simulations of the LMC-Galaxy interaction by Mastropietro et al. (2004) show that a large amount of gas ( M⊙) is lost along the orbit. These simulations include both tidal and ram-pressure stripping. Contrary to previous modeling of this interaction, Mastropietro et al. (2004) find that the amount of stripped stars is negligible compared to the amount of stripped gas. The predictions are that the MS forms a great circle on the sky. Their Figure 2 shows that the lost gas is distributed in the plane of the orbit, and out to distances above and below the Galactic plane of kpc. In fact, Braun & Thilker (2004) report the detection of a diffuse northern () extension of the MS, that has a column density of cm-2. According to the Mastropietro et al. (2004) models, this detection corresponds to the distant, above-the-Galactic-plane part of the LMC orbit. Thus Fornax may have undergone recent, efficient ram-pressure stripping by passing through the denser, inhomogeneous environment of the gas in the Magellanic plane, along the orbit of the LMC. Whether gas from the LMC in this part of its orbit (at Z = -140 kpc) has the appropriate density to cause efficient ram-pressure stripping in Fornax, remains to be determined from detailed models of the Clouds’ interaction with the Galaxy. Nevertheless, based on our calculated orbits, the crossing of the Magellanic plane took place at a time that coincides with the time when star formation ceased in Fornax. To illustrate the geometry, in Figure 9 we show the projection on the sky of the entire (i.e., one period) orbit of Fornax, and the most recent Gyr of the orbit of the LMC. The dark part of Fornax’s orbit represents the most recent Gyr. The current locations of Fornax, the LMC, Sculptor, Leo I, Leo II, Sextans and Phoenix are indicated with filled circles. The MS is indicated as derived from the H I column density data kindly provided to us by Mary Putman (Putman et al. 2003, hereafter P03). In this plot, we highlight the density contour corresponding to N cm-2.
Besides mapping out the large-scale MS structure, P03 also analyze the spatial and velocity distributions of H I clouds in the MS and in the direction of the Sculptor group, as cataloged in a previous paper (Putman et al. 2002). The Sculptor group is an association of galaxies at the South Galactic pole (SGP), and at distances ranging from 2 to 4 Mpc. Roughly half of this group falls on the same line of sight as a part of the MS, namely that section in the vicinity of the SGP. P03 (see also references therein) found that there are more clouds in this region than in any other part of the MS. They also found that the distributions of velocity and orientation of the elongated clouds with respect to the MS do not match those of the clouds in the bulk of the MS (their Figures 11 and 14). In addition, they show that the velocity distribution of the clouds in this region of the MS does not match that of the Sculptor group galaxies either. Unlike distant, extragalactic clouds, these anomalous clouds show diffuse connections between one another, and a likely velocity gradient across the MS (see their Figures 7 and 13). P03 conclude that these “excess” clouds (when compared to the MS cloud distribution) are more likely associated with some halo material rather than the distant Sculptor group. P03 further note that the origin of the clouds may be linked to crossing tidal streams from Galactic satellites with polar orbits. This is exactly the type of orbit that we have calculated from our proper-motion measurement of Fornax dSph.
In Figure 10 (a) (left panel) we show this region of the sky in a gnomonic projection with the SGP at the center of the projection. The orbits of Fornax and the LMC are shown. The Sculptor, Phoenix and Fornax dSphs are indicated, and the H I data from P03 are shown, with the N cm-2 contour highlighted. This panel is to be compared with the density map in P03 (their Figs. 5 and 12), and with the velocity map in P03 (their Fig. 7). A reference feature common to all these figures that can be used to guide the eye, is the bifurcation of the MS at , and . Figure 10(b) is a similar projection in which we show the H I clouds cataloged by Putman et al. (2002) as individual sources. From their catalog we have excluded sources associated with galaxies. Each cloud is represented with a line segment that indicates the orientation and size (major axis) of the cloud. Only elongated clouds (i.e., minor/major axis 0.7) that are small (i.e., semi-major axis ) are included in this plot. The Putman et al. (2002) catalog is comprised of clouds with local-standard-of-rest velocities larger than 80 km s-1 in absolute value, a selection that aims to eliminate features associated with the Galactic disk H I emission. From Fig. 10 (b), one can see that there is an increase in the number of clouds in the SGP region of the MS, specifically near the location on the sky of the Sculptor dSph and between to , and . These excess clouds, already mentioned in P03, are located along the newly determined orbit of Fornax. Moreover, the orientation of the elongation of these excess clouds is aligned with the orbit of Fornax, while the bulk of the clouds along the MS, are aligned with the long axis of the MS. The orientation of the elongation of these two groups of clouds with respect to the long axis of the MS can also be seen in Figure 8 of P03. In addition to the orientation of the clouds, Figure 8 of P03 also shows the head-tail structure of the clouds, i.e., a dense core with diffuse tail structure. P03 note that often the clouds aligned with the MS have the tails point away from the Magellanic Clouds. From Figure 8 of P03, the clouds in the SGP/Sculptor-group region of the MS that have an orientation almost perpendicular to the long axis of the MS have the tails point away from the MS, and, according to our Figure 10 (b), away from Fornax. Therefore the orientation of the elongation and of the head-tail structure of the clouds is similar for these two groups of clouds, provided that for one group the source where they originated is the LMC, and for the other group the source is the Fornax dSph.
From our orbit calculation, Fornax and/or material from Fornax has a Galactocentric radial velocity (in the Galactic rest frame) of km s-1, when it crosses the Magellanic plane. This negative, rather low radial velocity indicates that Fornax is approaching a turning point in its orbit — in this case the pericenter — and it is well within the velocity range of the excess clouds discussed in P03. (See their Fig. 11, in which the Galactic-rest-frame velocities are along the line of sight rather than along the direction to the Galactic center, but these directions are very close for objects located at large Galactocentric radii.)
Therefore we suggest that the excess clouds in the SGP/Sculptor-group region of the MS are stripped material from the Fornax dSph, as it crossed the Magellanic orbit (Fig. 8).
According to our orbit, Fornax’s previous pericenter passage was Gyr ago (Tab. 4). Since there is a significantly larger intermediate-age (4-7 Gyr, e.g., GGH03, Tolstoy et al. 2003) population than old population in Fornax, it is conceivable that the intermediate-age population is the result of the tidal interaction between Fornax and our Galaxy at the previous pericenter passage of the satellite. Between the last pericenter passage and the present time (which practically coincides with pericenter passage), Fornax continues to form stars and consumes most of its gas. The recent crossing of the Magellanic plane (and the supposed left-over gas from the LMC) may have swept away the remaining gas, causing star formation to cease.
4.3 Estimation of the Mass of the Galaxy
If Fornax is gravitationally bound to the Galaxy, then its current velocity is smaller than the escape velocity. By assuming a point-mass Galactic gravitational potential, the limit on the escape velocity gives a lower limit for the Galactic mass as:
| (1) |
where is the Galactocentric radius, and is the total velocity of the dSph. By taking kpc, and the total velocity from the values in Table 3 we obtain M⊙. The uncertainty in the mass estimate is derived from that in the total velocity. This estimate is in reasonable agreement with recent determinations of the Milky Way mass from a large sample of halo objects and satellites (Sakamoto, Chiba & Beers 2003). They find a lower mass limit of M⊙.
5 Summary
We have measured the absolute proper motion of Fornax dSph from a combination of photographic plates and WFPC2 images with a time baseline of up to 50 years. A total of 8 QSO images and 48 galaxies were used in the correction to absolute proper motion. The uncertainty in each proper-motion direction is 0.16 mas yr-1. This measurement implies a polar orbit, with a low eccentricity, and with the current location of Fornax near pericenter. The motion of Fornax supports the notion that Fornax belongs to the plane defined by Leo I, Leo II, Sextans, Sculptor and Fornax. We also note that the orbit of Fornax indicates that the dSph crossed the Magellanic plane some 200 Myr ago, a time that coincides with the termination of the dSph’s star-formation process. It is found that the excess, anomalous H I clouds in the SGP/Sculptor-group region of the MS (P03), are located along the orbit of Fornax. The orientation of the elongation of these excess clouds seems to better align with the orbit of Fornax rather than with that of the LMC. We thus speculate that these clouds were stripped from Fornax, as the dSph crossed the Magellanic orbit.
We acknowledge funding from archive grant 08739. SRM, DID and BK were also supported by NSF CAREER Award AST-9702521, NSF grant AST-0307851, NASA/JPL contract 1228235, a Cottrell Scholar Award from the Research Corporation, and a David and Lucile Packard Foundation Fellowship to SRM. SRM thanks Eduardo Hardy for loan of his early Du Pont plates of Fornax, Allen Sandage for loan of the 200-inch Fornax plates, Oscar Duhalde and Fernando Peralta for assistance during SRM’s Du Pont photographic observing runs, and David Monet for generating early plate scans of the Du Pont Fornax plates. DID thanks Mary Putman for making available the H I density data for the MS.
This research has made use of the database, operated at , Strasbourg, France.
References
- (1)
- (2) Anderson, J. & King, I. R. 1999, PASP, 111, 1095
- (3) Anderson, J. & King, I. R. 2000, PASP, 112, 1360
- (4) Anderson, J. & King, I. R. 2003, PASP, 115, 113
- (5) Baggett, S et al. 2002, in WFPC2 Data Handbook, v 4.0, ed. B. Mobasher, Baltimore, STSci
- (6) Bellazzini, M., Ibata, R., Ferraro, F. R., & Testa, V. 2003, A&A, 405, 577
- (7) Braun, R. & Thilker, D. A. 2004, A&A, in press
- (8) Buonanno, R., Corsi, C. E., Castellani, M., Marconi, G., Fusi Pecci, F., & Zinn, R. 1999, AJ, 118, 1671
- (9) Chiu, L. -T. G. 1976, PASP, 88, 803
- (10) Cohen, J. 2004, AJ, in press
- (11) Cudworth, K. M., & Rees, R. F. 1991, PASP, 103, 470
- (12) Dehnen, W. & Binney, J. J. 1998, MNRAS, 298, 387
- (13) Da Costa, G. S. & Armandroff, T. E. 1995, AJ, 109, 2533
- (14) Dinescu, D. I., Girard, T. M., & van Altena, W. F. 1999, AJ117, 1792
- (15) Dinescu, D. I., Majewski, S. R., Girard, T. M., & Cudworth, K. M., 2000, AJ, 120, 1892
- (16) Dinescu, D. I., Majewski, S. R., Girard, T. M., & Cudworth, K. M., 2001, AJ, 122, 1916
- (17) Frinchaboy, P. M., Majewski, S. R., Crane, J. D., Reid, I. N., Rocha-Pinto, H. J., Phelps, R. L., Patterson, R. J., & Muñoz, R. R. 2004, ApJ, 602, L21
- (18) Grebel, E. K., Gallagher, J. S. & Harbeck, D. 2003, AJ, 125, 1926
- (19) Kroupa, P. 1997, New Astronomy 2, 139
- (20) Kunkel, W. E. 1979, ApJ, 228, 718
- (21) Kunkel W. E. & Demers, S. 1976, Roy. Green. Obs. Bull. 182, 241
- (22) Hodge, P. 1961, AJ, 66, 83
- (23) Johnston, K. V, Spergel, D. N., & Hernquist, L. 1995, ApJ, 451, 598
- (24) Knierman, K. A., Gallagher, S. C., Charlton, J. C., Hunsberger, S. D., Whitmore, B., Kundu, A., Hibbard, J. E., & Zaritsky, D. 2003, AJ126, 1227
- (25) Lee, J. -F. & van Altena, W. F. 1983, AJ, 88, 1683
- (26) Lynden-Bell, D. 1976, MNRAS, 174, 695
- (27) Lynden-Bell, D. 1982, Observatory, 102, 202
- (28) Mackey, A. D., & Gilmore, G. F. 2003a, MNRAS, 340, 175
- (29) Mackey, A. D., & Gilmore, G. F. 2003b, MNRAS, 345, 747
- (30) Majewski, S. R. 1994, ApJ, 431, L17
- (31) Majewski, S. R., Skrutskie, M. F., Weinberg, M. D., & Ostheimer, J. C. 2003, ApJ, 599, 1082
- (32) Majewski, S. R., Kunkel, W. E., Law, D. R., Patterson, R. J., Polak, A. A., Rocha-Pinto, H. J., Crane, J. D., Frinchaboy, P. M., Hummels, C. B., Johnston, K. V., Rhee, J., Skrutskie, M. F., & Weinberg, M. 2004, AJ, in press
- (33) Martin, N. F., Ibata, R. A., Bellazzini, M., Irwin, M. J., Lewis, G. F., & Dehnen, W. 2004, MNRAS, 348, 12
- (34) Martínez-Delgado, D., Zinn, R., Carrera, R. & Gallart, C. 2002, ApJ, 573, L19
- (35) Mastropietro, C., Moore, B., Mayer, L., Stadel, J., & Wadsley, J. 2004, in ASP Conf. Ser. “Satellites and Tidal Streams”, La Palma 2003, ed. F. Prada, D. Martínez-Delgado and T. Mahoney, in press
- (36) Mateo, M. 1998, ARAA, 36, 435
- (37) Mayer, L. Governato, F., Colpi, M., Moore, B., Quinn, T., Wadsley, J., Stadel, J., & Lake, G. 2001, ApJ, 559, 754
- (38) Piatek, S., Pryor, C., Olszewski, E. W., Harris, H. C., Mateo, M., Minniti, D., Monet, D. G., Morrison, H., & Tinney, C. G. 2002, AJ, 124, 3198
- (39) Pont, F., Zinn, R., Gallart, C., Hardy, E.& Winnick, R. 2004, AJ, in press
- (40) Putman, M. E., De Heiji, V., Staveley-Smith, L., Braun, R., Freeman, K. C., Gibson, B. K., Burton, W. B., Barnes, D. G., Banks, G. D., Bhathal, R., De Blok, W. J. G., Boyce, P.J., Disney, M. J., Drinkwater, M. J., Ekers, R. D., Henning, P.A., Jerjen, H., Kilborn, V. A., Knezek, P. M., Koribalski, B., Malin, D. F., Marquarding, M., Minchin, R. F., Mould, J. R., Oosterloo, T., Price, R. M., Ryder, S. D., Sadler, E. M., Stewart, I., Stootman, Webster, R. L. & Wright, A. E. 2002, AJ, 123, 873
- (41) Putman, M. E., Staveley-Smith, L., Freeman, K. C., Gibson, B. K. & Barnes, D. G. 2003, ApJ, 586, 170
- (42) Saviane, I., Held, E. V., Bertelli, G. 2000, A&A, 355, 56
- (43) Schweitzer, A. E., Cudworth, K. M., Majewski, S. R., & Suntzeff, N. B. 1995, AJ110, 2747
- (44) Stetson P., B., Hesser, J. E., & Smecker-Hane, T. A. 1998, PASP, 110, 533
- (45) Strader, J., Brodie, J. P., Forbes, D. A., Beasley, M. A., & Huchra, J. P. 2003, AJ, 125, 1291
- (46) Tinney, C. G., Da Costa, G. S., & Zinnecker, H. 1997, MNRAS285, 111
- (47) Tinney, C. G. 1999, MNRAS303, 565
- (48) Tolstoy, E., Venn, K. A., Shetrone, M., Primas, F., Hill, V., Kaufer, A., & Szeifert, T. 2003, AJ, 125, 707
- (49) Valdes, F. 1982, in Instrumentation in Astronomy IV, S.P.I.E. Proceedings, Vol. 331, p. 465
- (50) Valdes, F. 1993, FOCAS User’s Guide, NOAO document
- (51) (ftp://iraf/noao.edu/iraf/docs/focas/focasguide.ps.Z)
- (52) van der Marel, R. P., Alves, D. R., Hardy, E. & Suntzeff, N. B. 2002, AJ, 124, 2639
- (53) Walcher, C. J., Fried, J. W., Burkert, A., & Klessen, R. S. 2003, A&A, 406, 847
- (54) Yanny, B., Guhathakurta, P., Schneider, D. P., & Bahcall, J. N. 1994, ApJ435, L59
- (55) Young, L. M. 1999, AJ, 117, 1758
| Table 1. Photographic Plate Material | ||||||
| Plate # | Date | H.A. | Exp. Time | Emulsion+Filter | R.A. (J2000) Dec. | |
| (dd.mm.yy) | (hours) | (minutes) | () | () | ||
| Hale 5 m ( mm-1) | ||||||
| PH275B | 09.10.50 | 0.15 | 60 | 103a-E GG11+No. 25 | ||
| PH805B | 04.09.53 | 23.58 | 30 | 103a-D GG11 | ||
| PH863B | 13.09.53 | 23.15 | 60 | 103a-D Corning 3484 | ||
| CTIO 4 m ( mm-1 ) | ||||||
| 276 | 18.12.74 | 23.06 | 45 | IIIa-J GG385 | ||
| 18.12.74 | 20.34 | 60 | IIIa-J GG385 | |||
| 282 | 19.12.74 | 21.53 | 70 | IIa-D GG495 | ||
| 19.12.74 | 20.17 | 50 | IIIa-J GG385 | |||
| 287 | 20.12.74 | 21.80 | 70 | IIa-D GG495 | ||
| 20.12.74 | 20.30 | 60 | IIIa-J GG385 | |||
| Las Campanas DuPont 2.5 m ( mm-1) | ||||||
| CD0100 | 12.10.77 | 22.43 | 90 | 103a-D W16 | ||
| CD0103 | 13.10.77 | 22.60 | 60 | 103a-D W16 | ||
| CD2644 | 16.08.85 | 23.75 | 60 | 103a-O GG385 | ||
| CD2677 | 20.08.85 | 23.45 | 60 | 103a-O W2C | ||
| CD3107 | 02.11.94 | 23.33 | 180 | IIa-D GG495 | ||
| CD3110 | 03.11.94 | 0.07 | 225 | IIa-D GG495 | ||
| CD3302 | 23.01.01 | 20.37 | 120 | IIIa-F GG495 | ||
| 1 These plates were used in the photometric calibration, but not in the astrometric reduction. | ||||||
| Table 2. WFPC2 Data | |||||
| Target | Date | Exp. Time | Filter | R.A. (J2000) Dec. | |
| (dd.mm.yy) | (seconds) | () | () | ||
| Cluster 4 | 10.03.95 | 1100 | F814W | ||
| Cluster 3[NGC 1049] | 04.06.96 | 120-700 | F555W/F814W | ||
| Cluster 2 | 05.06.96 | 120-700 | F555W/F814W | ||
| Fornax Field[Parallel Data] | 25.09.98 | 300 | F606W | ||
| QSO[A+B] & Cluster 4 | 10.03.99 | 160 | F606W | ||
| Fornax Field[Parallel Data] | 08.03.00 | 400 | F606W | ||
| Table 3. Galactic-Rest-Frame Proper Motions and Velocities | |||||||||
| Object | cos | cos | |||||||
| (mas yr-1) | (mas yr-1) | (km s-1) | (km s-1) | ||||||
| Fornax | 0.36 | 0.07 | -0.13 | 0.34 | 197 | 62 | 123 | -23 | 239 |
| 0.16 | 0.16 | 0.16 | 101 | 102 | 44 | 60 | 93 | ||
| Fornax (P02) | 0.26 | -0.37 | 0.32 | 0.32 | 152 | -230 | 116 | -38 | 296 |
| 0.13 | 0.13 | 0.13 | 81 | 82 | 36 | 48 | 79 | ||
| Sculptor | 0.36 | 0.43 | -0.47 | -0.30 | 60 | 193 | -88 | 96 | 199 |
| 0.25 | 0.22 | 0.25 | 90 | 87 | 12 | 16 | 87 | ||
| Table 4. Orbital Elements | ||||||||||
| Object | e | |||||||||
| (km2s-2) | (kpc km s-1) | ( yr) | (kpc) | (kpc) | (kpc) | () | ||||
| Fornax | 5.4 | 0.4 | 3.4 | 6.0 | 4.5 | 239 | 138 | 186 | 0.27 | 83 |
| 0.4 | 1.8 | 2.8 | 139 | 19 | 54 | 0.16 | 14 | |||
| Fornax (P02) | 6.9 | -1.4 | 4.2 | 10.0 | 7.0 | 442 | 138 | 230 | 0.52 | 70 |
| 0.3 | 1.3 | 2.4 | 171 | 7 | 68 | 0.16 | 12 | |||
| Sculptor | 2.8 | 0.2 | 1.6 | 2.8 | 2.1 | 120 | 58 | 91 | 0.35 | 83 |
| 0.1 | 0.9 | 1.1 | 51 | 15 | 31 | 0.10 | 7 | |||