Ultra-high energy cosmic rays from a finite number of point sources
Abstract
We have calculated the probability that the clustering of arrival directions of ultra-high energy cosmic rays (UHECRs) is consistent with a finite number of uniformly distributed proton sources, assuming the case of small deflections by magnetic fields outside the Galaxy. A continuous source distribution is mimicked only by an unrealisticly high source density, . Even for densities as large as , less than half of the observed cluster are on average by chance. For the best-fit value – derived from the AGASA data, the probability that at least one observed cluster is from a true point source is larger than , while on average almost all observed clusters are true. The best-fit value found is comparable to the density of AGNs and consistent with the recent HiRes stereo data. In this scenario, the Pierre Auger Observatory will not only establish the clustering of UHECRs but also determine the density of UHECR sources within a factor of a few after one year of data taking.
PACS: 98.70.Sa
1 Introduction
The acceleration of protons or heavy nuclei to energies eV is difficult for all known astrophysical sources of cosmic rays [1]. Therefore, one expects that only a small fraction of all cosmic ray (CR) sources is able to accelerate beyond eV. The signature of a small number of ultra-high energy (UHE) CR sources is the small-scale clustering of their arrival directions, if the deflection of CRs in magnetic fields can be neglected. The structure and magnitude of the Galactic magnetic field can be estimated observing the Faraday rotation of the polarized radio-emission of pulsars. At energies eV, the deflection of CR protons in this field is less than 4–6 degrees in most directions and decreases to 1–2 degrees at eV [2]. The overall effect on potential CR clusters is even smaller when the energies of the CRs in the cluster are not too different.
The magnitude and structure of extragalactic magnetic fields is more uncertain. Only recently, magnetic fields were included in simulations of large scale structures [3, 4]. It was found that extragalactic magnetic fields are strongly localized in galaxy clusters and filaments, while voids contain only primordial fields. The latter cannot be stronger than G, otherwise the observed field strengths in galaxy clusters would be exceeded. Even if sources tend to sit in regions of high density and thus strong magnetic fields, CRs can be significantly deflected only within clusters. But the angular size of distant galaxy clusters is much less than one degree and thus they appear as point-like sources unless a nearby cluster is on the line of sight. Thus in the part of the sky outside of nearby galaxy clusters astronomy with UHE protons may be possible, unless the observer is embedded in a strongly magnetized region. In the latter case, deflections are important even for UHE protons, and charged particle astronomy may not be possible [4]. A crucial step towards the goal of UHE proton astronomy is the identification of point sources of UHECRs.
The AGASA data on the arrival direction of CRs with energies eV contain a clustered component with five pairs and one triplet within degrees [5, 6]. Neglecting possible systematic errors in energy scales, the sensitivity of the other experiments for clustering at the energies eV is much smaller, either because of the smaller exposure at the highest energies (Yakutsk, HiRes in stereo mode) or because of a poor two-dimensional angular resolution (HiRes in monocular mode). At lower energies, eV, when deflections by magnetic fields become more important, a clustered component still exists in the AGASA, Yakutsk and HiRes stereo data, but with reduced significance.
The small-scale clustering of UHECR arrival directions has been discussed by various authors. These works can be divided into two main groups: The first one calculates the significance of the small-scale clusters [7, 8, 9, 10, 11], while the second group of works uses the data to estimate parameters like the density of sources or the strength of magnetic fields [12, 13, 14, 15, 16, 17]. The authors of Ref. [12] pointed out, to our knowledge for the first time, that the observation of small-scale clusters allows to determine the number density of CR sources. In practice, the observed small-scale clusters of AGASA were used to estimate the number CR sources first in the pioneering work of Dubovsky, Tinyakov and Tkachev [13]. Previous analyses of the significance of the small-scale clusters observed by AGASA used a continuous distribution of sources as a test hypothesis. Such a distribution has the advantage of being model-independent and gives a lower limit on the significance of clustering for a finite number of sources, as long as deflections by magnetic fields can be neglected. Here, we investigate the significance of the small-scale clusters within a realistic model of UHECR protons propagating from astrophysical sources distributed uniformly in the Universe. In particular, we calculate the number of true clusters, i.e. those with CRs from the same source, as function of . We show that the asymptotic limit of a continuous distribution of sources is reached only for an unrealistic high density of sources, , where the latter value corresponds to one source per galaxy. We estimate also the number density of CR sources assuming small deflections of CRs in galactic and extragalactic magnetic fields. Our Monte Carlo procedure is very similar to the one of Ref. [17]. We derive however confidence levels for the consistency of arbitrary source densities with the clustering observed by the AGASA experiment, while Ref. [17] considered exemplary only three values for the source density. Moreover, our analysis shows strong deviations from Gaussianity for the probability distribution of the autocorrelation function. For the best-fit value – derived from the AGASA data, the probability that at least one observed cluster is from a true point source is larger than . For such densities, we predict that the Pierre Auger Observatory (PAO) [18] will be able to determine within a factor of ten at C.L. after one year of data taking. In the same time, the PAO will establish that clustering is not by chance at the at the level for any estimated source density smaller than Mpc3.
2 Analysis of the AGASA and HIRES data
The authors of Ref. [19] used first the angular two-point auto-correlation function discussing the significance of small-scale clustering in the arrival directions of UHECRs. Since the signal of point-like sources should be concentrated around , we restrict our analysis to the value of in the first bin,
| (1) |
where is the angular distance between the two cosmic rays and , the chosen bin size, the step function, and the number of CRs considered.
A draw-back of using only the first bin of the autocorrelation function is the dependence of the results on . As a possible solution, one can perform a scan over different bin sizes and calculate the resulting penalty factor [20]. However, the result then still depends on the minimal and maximal bin size used in the scan: Choosing the scan range too large reduces the signal-to-noise ratio and thus diminishes the signal, while a too small range overestimates the signal. Following a different approach, we generated artificial data sets from a single point source, deflected them in the magnetic field, and finally smeared their arrival directions according to the angular resolution of the experiment. Then we chose the best binning size such that the probability to observe an experimental value by chance is minimized as function of . Here, is the normalized auto-correlation function,
| (2) |
where and denote the solid angle with non-zero exposure of the experiment and of the bin considered, respectively. Without the effect of the Galactic magnetic field, the optimal value for found e.g. for the angular resolution of the AGASA experiment is ; including the effect of the Galactic magnetic field we found as optimal range of values . Similar as for , we could try to find the optimal minimal energy of events taken into account. Earlier analyses found as penalty factor for the scan over in the AGASA data only a factor three [19, 20].
We generate sources with constant comoving density up to the maximal redshift ; we have checked that the flux of sources further away is negligible above eV. Then we choose a source with equatorial coordinates R.A. and at comoving radial distance according to the declination dependent exposure of the experiment and the weight
| (3) |
Here, and are the distance and redshift of the nearest source in the sample, respectively, and we have assumed the same luminosity for all sources. Then CRs are generated according to the injection spectrum , where we fix to reproduce best the AGASA energy spectrum below the GZK cutoff. We propagate CRs until their energy is below or they reach the Earth. In that case, we take into account the energy-dependent angular deflection through the Galactic magnetic field and the angular resolution of the experiment. For the angular resolution, we use a spherical Gaussian density with for AGASA and the PAO, and for HiRes, respectively, and for the Galactic magnetic field we use a shift by .
The basic outcome of a sample of Monte Carlo simulations for fixed parameters is a binned distribution for the values of the auto-correlation function. With how much confidence can we accept or reject the hypothesis that the experimentally measured value is drawn from ? In previous analyses, the test hypothesis was a continuous, isotropic distribution of sources on a sphere for which one expects lower values of than measured. Therefore, the probability that is consistent with was calculated as . This asymmetric definition fails when one wants to reject both cases with too much and with too little clustering. We shall use as a more symmetric measure for the discrepancy between and the area between the measured value and the median of the distribution .
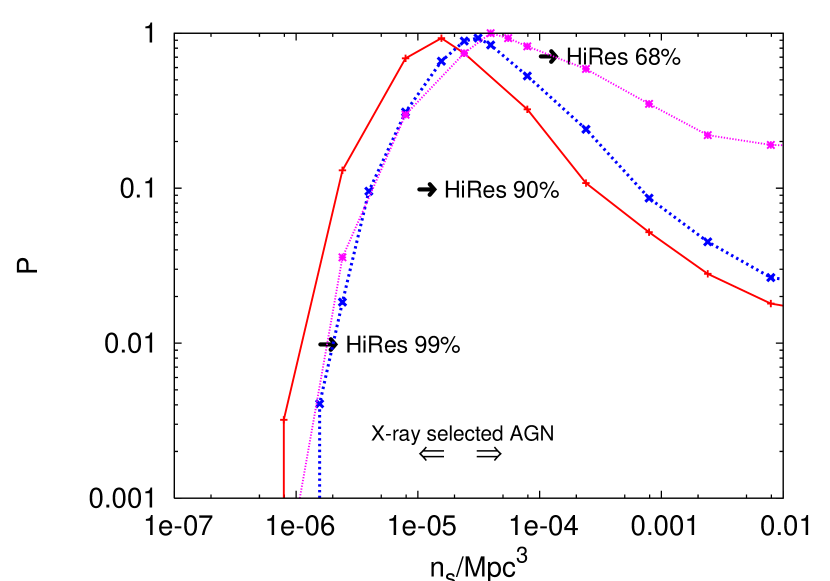
In Fig. 1, we show as function of for three different cases: The publicly available AGASA data set until May 2000 [21] ( or eV) for the two bin sizes () and (), and the complete AGASA data set [22] ( or eV, bin size and ). Remarkably, the most likely value for the source density, – is stable against an increase of the data set and a change in bin size. A similar value for was found previously by the authors of Ref. [17], while earlier analyses [13, 14] using only events above eV obtained larger values for . The steep decrease of for low excludes already now uniformly distributed sources with much lower density than . For comparison, we show also the estimated density of powerful AGNs with -ray luminosity erg/s in the energy range 0.2–5 keV, Mpc3 [23]. The density of Seyfert galaxies is about a factor of 20 higher. Note that most often only very specific subsets of AGNs with much lower densities are discussed as sources of UHECRs. On the other side, decreases only slowly for large . With the present AGASA data set it is therefore difficult to exclude large source densities.
Recently, the HiRes collaboration published an analysis of their stereo data [24]. Their data set with events above eV contains no doublet within and [25]. Therefore, the HiRes data alone are consistent with a continuous source distribution. But since the number of events is small and is a broad distribution, the HiRes data are also consistent with the best-fit value for from the AGASA data, at and C.L. for and , respectively. In Fig. 1, we show also lower limits on for from the HiRes stereo data. Similar conclusions were recently obtained in Ref. [11]. The HiRes data favor a larger value of than AGASA and may indicate that practically all Seyfert galaxies contribute to the CR flux above eV.
The effect of extragalactic magnetic fields on the above results is negligible, if the deflection is on 500 Mpc propagation distance as found for a large part of the sky in Ref. [3]. The assumption of equal luminosity of all sources gives a lower bound on the possible number of sources [13]. A large additional population of faint sources cannot be excluded, if their contribution to the UHECR flux is sufficiently small. However, it is unlikely that any large population of sources can accelerate CRs to energies eV.
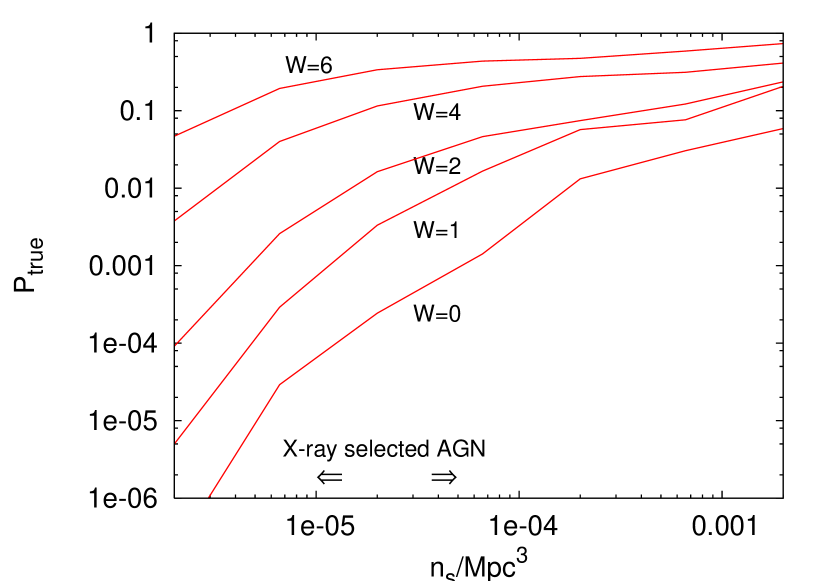
Apart from the auto-correlation function of the observed arrival directions of CRs, i.e. including deflections and the finite experimental resolution, we can calculate also the auto-correlation function of the sources, , with when the two CRs are from the same source and otherwise. Using only simulations which reproduce the observed value defines . In Fig. 2, we show the probability to have a value of the auto-correlation function smaller or equal than , as function of for events, and . Since the difference between the emitted and the observed direction of the CRs can be larger than , the values of can exceed for finite .
The asymptotic behavior of is easily understandable: For a single source, i.e. , and for observed events. On the other hand, for all clusters are by chance and thus . A priori, it is unclear if for source densities typical for, e.g., AGNs the distribution is still close to its limiting value for or already strongly changed. We find that the limit is approached only for unrealistic high source densities, , where the latter value corresponds to the density of ordinary galaxies. For smaller , the probability that at least one cluster observed by AGASA is real increases very fast and reaches 99.97% at . But even for densities as large as , less than half of the cluster are on average by chance.
3 Prediction for the PAO
The value of the auto-correlation function is dominated by clusters with high multiplicities and, thus suffers from large cosmic variance. Moreover, the overlap of the distributions for different will be only very slowly reduced by collecting more data. We have found that the fraction of singlets is a more stable quantity against cosmic variance: singlet events can come from larger distances than multiplets and are thus less affected by variations of the source distributions. Therefore we propose to use the distribution of the number of singlet events instead of to estimate from the PAO data.
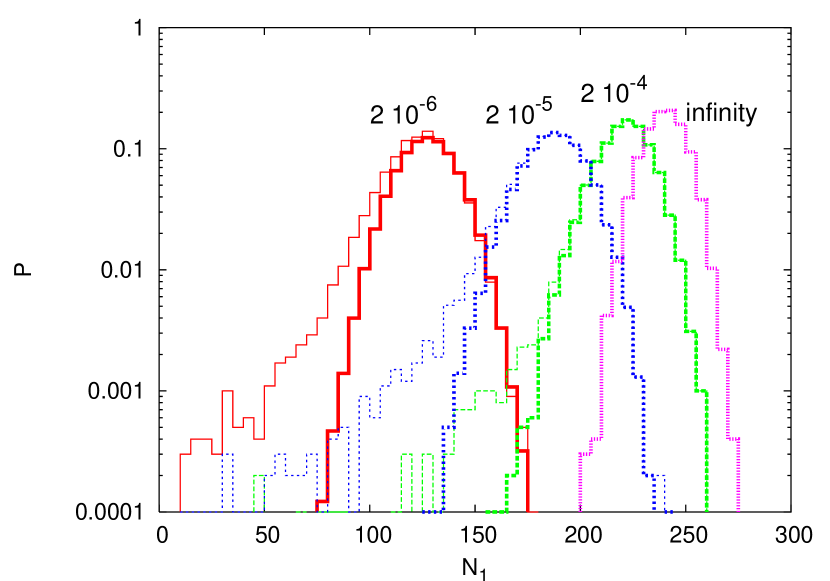
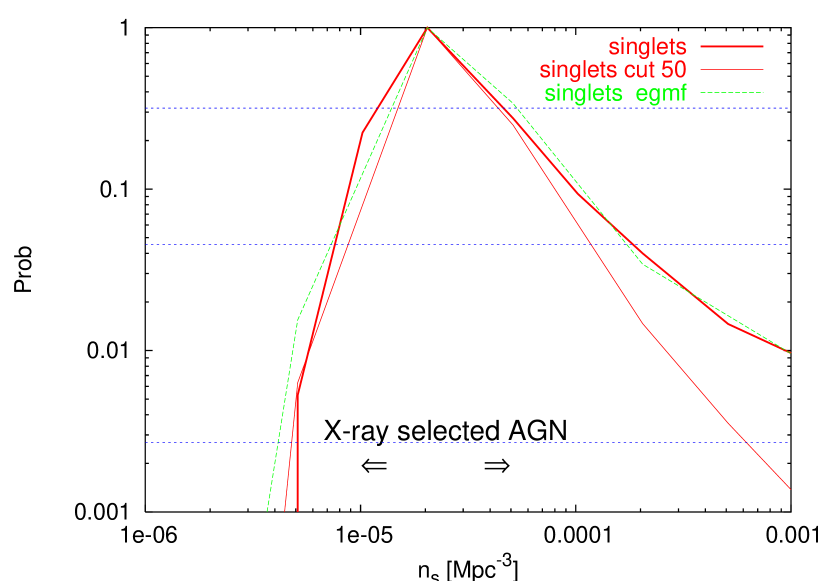
In Fig. 3, we show the distributions for events expected in one year running of the PAO for , and , together with the one for the limit . The distributions are characterized by power-law tails towards small , and these tails seem to prevent a clear separation of different densities. However, a very small fraction of singlet events is caused in most cases by a single nearby source producing clusters with very high multiplicity. We eliminate these exceptional cases by considering only samples where the highest multiplet is a 50-plet for . This would corresponds to 10 events from a single source in the case of AGASA. If indeed an exceptionally bright source would be found by the PAO, the region around this source should be excluded from the analysis. As an example, we show in Fig. 4 for the probability with which the PAO estimates the value of . The elimination of clusters with very high multiplicity reduces the cosmic variance and thereby increases the precision of the estimate for . The influence of extragalactic magnetic fields on is clearly negligible, if the average deflection with on 500 Mpc is as small as found in Ref. [3]. If the average deflection is closer to the values found in Ref. [4], the average number of singlet events for a fixed number of sources would increase and become more and more indistinguishable from the case of an infinite number of sources.
Finally, we want to estimate how well the PAO can establish that the clustering is not by chance, or equivalently, that the number of sources is finite. From an experimental point of view, the PAO will measure a certain value of the auto-correlation function. From this measurement. one can estimate the density of sources. For and the mean of is . On the other hand, the largest value found in simulations for a continuous distributions is . Thus for any estimated source density smaller than Mpc3 the PAO can establish clustering with chance probability smaller than . The smallest value compatible at 99% C.L. with a true density Mpc3 is only at compatible with an infinite number of sources.
4 Summary
We have investigated the significance of the small-scale clustering of the arrival directions of UHECRs assuming a finite number of uniformly distributed proton sources and small deflection of CRs in extragalactic magnetic fields. The AGASA data favor as source density Mpc3, a value where the probability that at least one observed cluster is from a true point source is larger than . Even for densities as large as , less than half of the cluster are on average by chance.
At present, the sparse AGASA data set cannot exclude firmly that the clustering is by chance without the prior knowledge of the source density. In contrast, the PAO will confirm clustering from a finite number of point sources within one year of data taking at the the level for any source density Mpc-3. The PAO will also measure the density of UHECR sources within a factor of a few, and check the assumption of uniformly distributed sources. If the PAO detects no significant clustering, then two possible explanations are that the extragalactic magnetic fields are, especially in the voids, larger than expected or that the UHECR primaries are nuclei.
Acknowledgments
We are grateful to V. Berezinsky, R. Cousins, C. Finley, G. Raffelt and M. Teshima for helpful discussions. M.K. acknowledges support by an Emmy-Noether grant of the DFG, and D.S. was supported in part by the NASA ATP grant NAG5-13399. D.S. thanks the MPI for hospitality during part of this work.
References
- [1] R. J. Protheroe and R. W. Clay, “Ultra high energy cosmic rays,” Publ. Astron. Soc. of Australia 21, 1 (2004) [astro-ph/0311466].
- [2] M. Prouza and R. Smida, “The Galactic magnetic field and propagation of ultra-high energy cosmic rays,” Astron. Astrophys. 410, 1 (2003) [astro-ph/0307165].
- [3] K. Dolag, D. Grasso, V. Springel and I. Tkachev, “Mapping deflections of Ultra-High Energy Cosmic Rays in Constrained Simulations of Extragalactic Magnetic Fields,” JETP Lett. 79, 583 (2004) [Pisma Zh. Eksp. Teor. Fiz. 79, 719 (2004)] [astro-ph/0310902]; “Constrained simulations of the magnetic field in the local universe and the propagation of UHECRs,” JCAP 0501, 009 (2005) [astro-ph/0410419].
- [4] G. Sigl, F. Miniati and T. Enßlin, “Ultra-High Energy Cosmic Ray Probes of Large Scale Structure and Magnetic Fields” Phys. Rev. D 70, 043007 (2004) [astro-ph/0401084].
- [5] M. Takeda et al., “Small-scale anisotropy of cosmic rays above 10**19-eV observed with the Akeno Giant Air Shower Array,” Astophys. J. 522 225 [astro-ph/9902239];
- [6] M. Takeda et al., Proc. 27th ICRC, Hamburg, 2001.
- [7] Y. Uchihori, M. Nagano, M. Takeda, M. Teshima, J. Lloyd-Evans and A. A. Watson, “Cluster analysis of extremely high energy cosmic rays in the northern sky,” Astropart. Phys. 13, 151 (2000) [astro-ph/9908193].
- [8] H. Goldberg and T. J. Weiler, “Directional clustering in highest energy cosmic rays,” Phys. Rev. D 64, 056008 (2001) [astro-ph/0009378].
- [9] W. S. Burgett and M. R. O’Malley, “Hints of energy dependences in AGASA EHECR arrival directions,” Phys. Rev. D 67, 092002 (2003) [hep-ph/0301001].
- [10] D. Harari, S. Mollerach and E. Roulet, “Statistics of cluster multiplicity and the nature of UHE cosmic ray sources,” JCAP 0405, 010 (2004) [astro-ph/0404304].
- [11] H. Yoshiguchi, S. Nagataki and K. Sato, “Statistical significance of small scale anisotropy in arrival directions of ultra-high energy cosmic rays,” astro-ph/0404411.
- [12] E. Waxman, K. B. Fisher and T. Piran, “The signature of a correlation between eV cosmic ray sources and large scale structure,” Astrophys. J. 483, 1 (1997) [astro-ph/9604005].
- [13] S. L. Dubovsky, P. G. Tinyakov and I. I. Tkachev, “Statistics of clustering of ultra-high energy cosmic rays and the number of their sources,” Phys. Rev. Lett. 85, 1154 (2000) [astro-ph/0001317].
- [14] Z. Fodor and S. D. Katz, “Ultra high energy cosmic rays from compact sources,” Phys. Rev. D 63, 023002 (2001) [hep-ph/0007158].
- [15] H. Yoshiguchi, S. Nagataki, S. Tsubaki and K. Sato, “Small scale clustering in isotropic arrival distribution of ultra-high energy cosmic rays and implications for their source candidate,” Astrophys. J. 586, 1211 (2003) [Erratum-ibid. 601, 592 (2004)] [astro-ph/0210132].
- [16] H. Yoshiguchi, S. Nagataki and K. Sato, “Arrival distribution of ultra-high energy cosmic rays: Prospects for the future,” Astrophys. J. 592, 311 (2003) [astro-ph/0302508].
- [17] P. Blasi and D. De Marco, “The small scale anisotropies, the spectrum and the sources of ultra high energy cosmic rays,” Astropart. Phys. 20, 559 (2004) [astro-ph/0307067].
- [18] J. W. Cronin, Nucl. Phys. Proc. Suppl. 28B (1992) 213; see also http://www.auger.org/
- [19] P. G. Tinyakov and I. I. Tkachev, ‘Correlation function of ultra-high energy cosmic rays favors point sources,” JETP Lett. 74, 1 (2001) [Pisma Zh. Eksp. Teor. Fiz. 74, 3 (2001)] [astro-ph/0102101];
- [20] C. B. Finley and S. Westerhoff, “On the evidence for clustering in the arrival directions of AGASA’s ultrahigh energy cosmic rays,” Astropart. Phys. 21, 359 (2004) [astro-ph/0309159].
- [21] N. Hayashida et al., “Updated AGASA event list above 4*10**19-eV,” astro-ph/0008102.
- [22] M. Teshima, private communication.
- [23] A. T. Steffen et al., “The Changing AGN Population,” Astrophys. J. 596, L23 (2003) [astro-ph/0308238].
- [24] R. U. Abbasi et al. [The High Resolution Fly’s Eye Collaboration (HIRES)], “Study of small-scale anisotropy of ultrahigh energy cosmic rays observed in stereo by HiRes,” Astrophys. J. 610, L73 (2004) [astro-ph/0404137].
- [25] C. Finley, private communication.